All Analyst Stories
 Data
DataNow Available: Salesforce Canvas Documentation for Embedding Tableau
 March 28, 2014
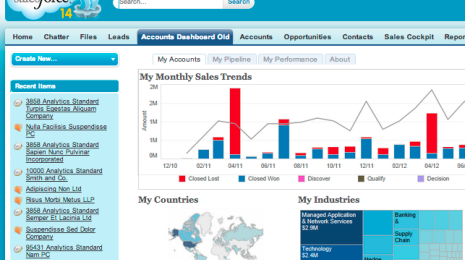
A few months ago we released a video about embedding Tableau dashboards into Salesforce using Canvas. This lets you get data to your Salesforce users, in the context of their everyday work, so they have the information to make the right decisions. Many of you asked for the documentation for this, and today we're releasing that.
March 28, 2014
A few months ago we released a video about embedding Tableau dashboards into Salesforce using Canvas. This lets you get data to your Salesforce users, in the context of their everyday work, so they have the information to make the right decisions. Many of you asked for the documentation for this, and today we're releasing that.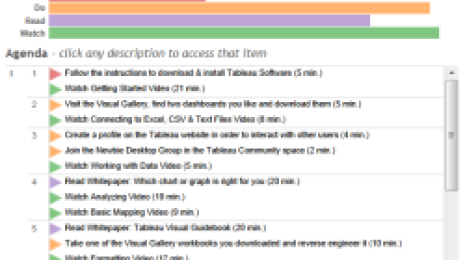 Product
20 days to Tableau success
 March 26, 2014
When I joined Tableau's Product Marketing Team in January, I immediately sat down and asked myself "How can we make it easier to learn to use Tableau Desktop?" Getting basic familiarity with the product shouldn't be a daunting experience. Thus the Starter Kit was born. Have you downloaded Tableau but don’t quite know where to start? Tried a few things but don’t yet know what you don’t know? Look no further; the Tableau Desktop Starter Kit is here to help.
March 26, 2014
When I joined Tableau's Product Marketing Team in January, I immediately sat down and asked myself "How can we make it easier to learn to use Tableau Desktop?" Getting basic familiarity with the product shouldn't be a daunting experience. Thus the Starter Kit was born. Have you downloaded Tableau but don’t quite know where to start? Tried a few things but don’t yet know what you don’t know? Look no further; the Tableau Desktop Starter Kit is here to help. Visualizations
Chocolate + Data = One Delicious Must-Read
 March 17, 2014
In 1947, Kilwins opened its first chocolate shop in Petoskey, Michigan. Since then, nearly 100 franchises have opened their doors across the country. And with decadent offerings such as fudge, ice cream, and a signature treat called the Tuttle, it's no wonder this chocolatier has been so successful! But even with such a delicious existence, something was missing from this business' life. We know, it's hard to believe. But in a recent interview with Jeff Hall—Kilwins' Director of Marketing, Commerce, and IT—we learned what happened when Kilwins added a new ingredient: a better business intelligence tool.
March 17, 2014
In 1947, Kilwins opened its first chocolate shop in Petoskey, Michigan. Since then, nearly 100 franchises have opened their doors across the country. And with decadent offerings such as fudge, ice cream, and a signature treat called the Tuttle, it's no wonder this chocolatier has been so successful! But even with such a delicious existence, something was missing from this business' life. We know, it's hard to believe. But in a recent interview with Jeff Hall—Kilwins' Director of Marketing, Commerce, and IT—we learned what happened when Kilwins added a new ingredient: a better business intelligence tool. Tableau Community
Examples of data journalism from around the world
 March 12, 2014
Last month was Data Journalism Month over on the Tableau Public site, and we had the pleasure of shining the spotlight on the women and men who tell the world's data stories for their profession. We interviewed Sarah Ryley from the New York Daily News and Claire Miller from the Trinity Mirror in the UK. We shared our thoughts on how data visualization enhances the news, and we announced a 5 week online course for journalists. We joined journalists at news:rewired, Tapestry and NICAR, and posted some of the training materials we covered.
March 12, 2014
Last month was Data Journalism Month over on the Tableau Public site, and we had the pleasure of shining the spotlight on the women and men who tell the world's data stories for their profession. We interviewed Sarah Ryley from the New York Daily News and Claire Miller from the Trinity Mirror in the UK. We shared our thoughts on how data visualization enhances the news, and we announced a 5 week online course for journalists. We joined journalists at news:rewired, Tapestry and NICAR, and posted some of the training materials we covered. Data
DataNumber-Crunching for a Cause: A Seattle-Area School Principal Tells His Data Story
March 10, 2014
Pete Misner, a principal in a school district that's located just northeast of Seattle, is passionate about data. And he has always valued its use in the classroom to better understand student needs. In a recent interview, Misner discussed how data can improve decision-making in schools. And as a grassroots data analyst who’s never been afraid to crunch the numbers in Excel, he also explained why better visualization tools can save time and other sparse resources in the educational space. Data
DataOne Kings Lane: Disrupting the Décor Industry with Data
March 4, 2014
We visited One Kings Lane in San Francisco for an on-site interview with the folks behind this retailer's growing success. A rising e-commerce star, One Kings Lane is shaking up the home décor industry with online sales on designer and high-quality vintage items. In this interview, employees at One Kings Lane told us how visual analytics are helping users across the company make speedy, insightful decisions every day. Data
DataHow Data Insight Helps Princeton Support Student Financial Aid
February 25, 2014
The Office of Development at Princeton University is responsible for fundraising efforts that ultimately help thousands of students pursue their dreams. And with the major role it plays in financial-aid efforts, it’s no surprise that this office deals with a lot of data. While the Development Office had been using Tableau for years, it hadn’t really tapped into the full potential of the tool—until it connected it to its Oracle database in 2012. The result was a “paradigm shift,” which we recently discussed with Heather Campbell, the Associate Director of Development Research Analytics at Princeton University. Tableau Community
Best of the Tableau Web... January 2014
 February 12, 2014
Happy 2014! Hope your new year is off to a great start. Things are definitely great in the land of Tableau blogs. Here's the list of awesome content I've seen during the month of January. I'm filling in for Andy this month, you can always follow him on twitter (@acotgreave) if you want to hear about these posts the moment they are published.
February 12, 2014
Happy 2014! Hope your new year is off to a great start. Things are definitely great in the land of Tableau blogs. Here's the list of awesome content I've seen during the month of January. I'm filling in for Andy this month, you can always follow him on twitter (@acotgreave) if you want to hear about these posts the moment they are published. Data
DataASM Research Deploys Tableau, Saves Millions of Dollars for Army National Guard
January 17, 2014
A savings of $20 million. That was the immediate benefit of a Tableau dashboard created by ASM Research for the Army National Guard. Founded in 1975, ASM provides professional services and IT solutions for government organizations—and has worked with such clients as the Department of Defense and the Department of Veterans Affairs. In this video, experts at ASM Research, including Data Analyst Scott Cochran, describe the recent project that saved the National Guard millions of dollars. Says Cochran, “that makes me feel great because it makes me feel like I’m helping reduce the national debt."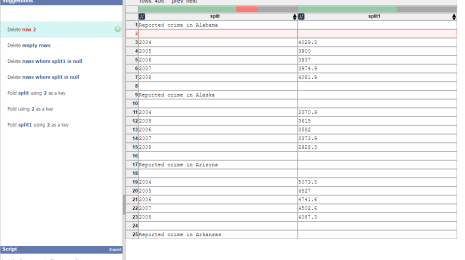 Data
DataMagnifying Output and Time Savings: Usability Sciences on Tableau
January 17, 2014
Usability Sciences specializes in user experience research. Founded in 1988, the company helps a diverse range of clients develop seamless experiences for their customers. And since its analysts began using Tableau, they’ve been gaining insights into online user experiences more quickly than ever before. We talked to Rebecca Ratliff, Director of Operations at Usability Sciences. In this video, she explains how Tableau helps Usability Sciences zoom in on the tiny details that cause visitors to leave a website. Data
DataMultiple Data Sources? Not a Problem for this Marketing Maven
January 16, 2014
As a major marketing company, Merkle is used to handling data from all kinds of sources. And with a number of big-name clients in multiple industries—including Dell, MTV, Susan G. Komen, and Bank of America—the marketing giant is regularly using Tableau with myriad data sources. “It’s actually spreading like wildfire across our entire organization,” says Senior Business Intelligence Analyst David Andrade about Tableau. In this interview, he explains why Merkle uses Tableau for both internal projects and client-facing communications. Data
DataIGT Builds a Better Slot Machine with Data
January 15, 2014
For nearly 30 years, International Game Technology (IGT) has been designing and manufacturing computerized gaming equipment for clients around the world. Lon O’Donnell, IGT’s manager of professional services, knows the data-driven science behind casino gaming. In this interview, he explains how IGT is using Tableau to optimize slot machine features in ways that were previously unimaginable. “A single slot machine spits out six to ten fields per hour multiplied by a thousand machines multiplied by 24 hours, multiplied by 365 days,” O’Donnell emphasizes. “So you're looking at about a billion fields per year that a single casino will analyze.”