All Stories
 Best of Tableau Web
Best of the Tableau Web: New features and growth opportunities
 February 14, 2020
In this month’s Best of the Tableau Web, Andy Cotgreave shares the blogs he loves from January. Dive in to get inspired, learn new tips and tricks, and more.
 Tableau Community
Announcing the 2020 Tableau Zen Masters
 February 13, 2020
We are excited to announce the inductees into our 8th cohort of Zen Masters!
February 13, 2020
We are excited to announce the inductees into our 8th cohort of Zen Masters!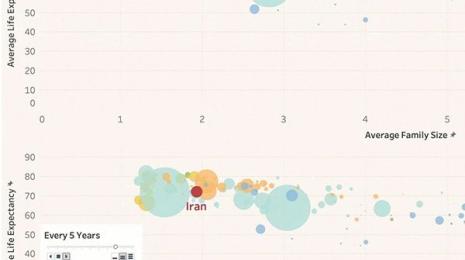 Product
Create data that moves you with viz animations
 February 12, 2020
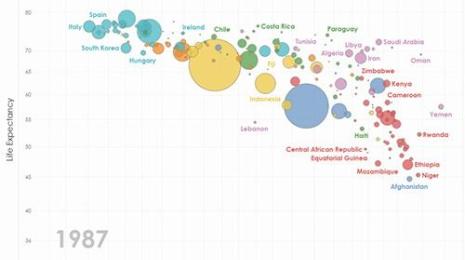
Viz animations help you see and understand your changing data. Dive into the blog to learn more about viz animations.
 Data Skills
How to make sales data actionable with TC sessions
 February 11, 2020
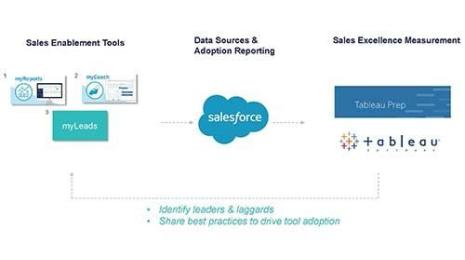
We've highlighted a few sessions with tips and best practices you can begin using today to optimize sales tools, speed up and simplify territory creation, and make sales data relevant to your entire organization. Discover key takeaways with links to the recording for you to watch and share with your teammates.
February 11, 2020
We've highlighted a few sessions with tips and best practices you can begin using today to optimize sales tools, speed up and simplify territory creation, and make sales data relevant to your entire organization. Discover key takeaways with links to the recording for you to watch and share with your teammates. Tableau Public
Behind the Viz: A look into Zunaira Rasheed's data visualization journey
 February 7, 2020
 Product
New connectors for the new year: Alibaba, Qubole, Kyvos, LinkedIn Sales Navigator
 February 7, 2020
Here’s a snapshot of Tableau’s new connectors: from data services in China’s leading cloud platform, Alibaba, to Qubole - which brings the power of business intelligence (BI) to any data lake, to the revolutionary OLAP technology of Kyvos, and to LinkedIn’s powerful Sales Navigator Application Platform (SNAP). Here’s a snapshot of Tableau’s new connectors.
February 7, 2020
Here’s a snapshot of Tableau’s new connectors: from data services in China’s leading cloud platform, Alibaba, to Qubole - which brings the power of business intelligence (BI) to any data lake, to the revolutionary OLAP technology of Kyvos, and to LinkedIn’s powerful Sales Navigator Application Platform (SNAP). Here’s a snapshot of Tableau’s new connectors.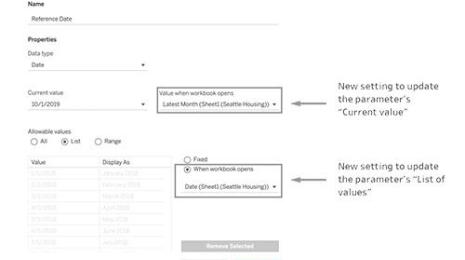 Product
Keep up with dynamic data changes using dynamic parameters
 February 6, 2020
Say goodbye to republishing workbooks with parameters every time the underlying data changes. Set your parameter once, and Tableau will automatically update the parameter’s list of values every time someone opens the workbook.
February 6, 2020
Say goodbye to republishing workbooks with parameters every time the underlying data changes. Set your parameter once, and Tableau will automatically update the parameter’s list of values every time someone opens the workbook. Tableau Community
Taking your data viz show on the road: Lessons from a non-linear career journey
 February 5, 2020
Siddharth Dayama discusses data visualization and his “non-linear” career journey. He explains that cruising at 8,000 feet incites his love for geospatial mapping and that he gets some of his best visualization ideas after completing a lesson.
February 5, 2020
Siddharth Dayama discusses data visualization and his “non-linear” career journey. He explains that cruising at 8,000 feet incites his love for geospatial mapping and that he gets some of his best visualization ideas after completing a lesson.
 Developer
New year, new updates: Analytics Extensions API, Hyper API, JavaScript API, and REST API
 January 30, 2020
New Year, new Developer Program Sprint Demos. The developer team shares updates for Analytics Extensions API, Hyper API, JavaScript API, and REST API.
January 30, 2020
New Year, new Developer Program Sprint Demos. The developer team shares updates for Analytics Extensions API, Hyper API, JavaScript API, and REST API.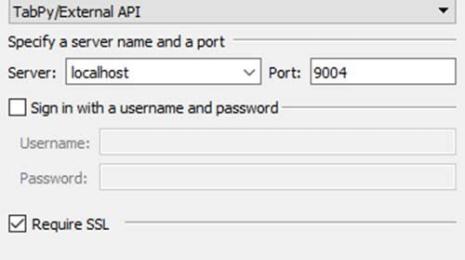 Product
TabPy 1.0 brings data science to decision makers
 January 30, 2020
Check out the latest Python integration features we’ve built to support data science and diverse analytics environments in Tableau.
January 30, 2020
Check out the latest Python integration features we’ve built to support data science and diverse analytics environments in Tableau. Tableau Blueprint
Better Government with Data Analytics: Plotting the way forward with Tableau Blueprint
 January 29, 2020
Welcome to Part Four of our four-part blog series, Better Government with Data Analytics. So far, we have shared thoughts and strategies with you, as you begin or resume an analytical journey at your organization. Conveniently, Tableau created a framework to enable that journey. The framework is Tableau Blueprint, and you can use it to build a roadmap to success.