6 tips to make your dashboards more performant
We here at Tableau are very proud of how easy it is to see and understand data with Tableau. Once you get started, it’s intuitive to dive deeper by adding more and more fields, formulae, and calculations to a simple visualization—until it becomes slower and slower to render. In a world where two-second response times can lose an audience, performance is crucial. Here are some tips on making your dashboards more performant.


Note: Ryan Lempa and Darren McGurran also contributed to this piece.
We here at Tableau are very proud of how easy it is to see and understand data with Tableau. Once you get started, it’s intuitive to dive deeper by adding more and more fields, formulae, and calculations to a simple visualization—until it becomes slower and slower to render. In a world where two-second response times can lose an audience, performance is crucial.
So where do I start?
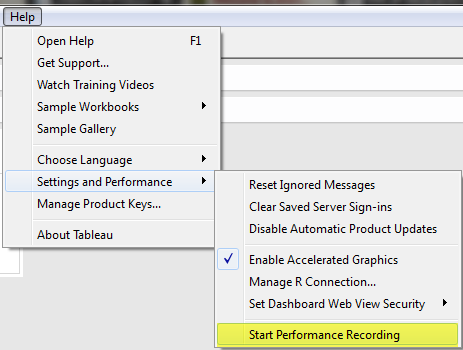
So how can you make your dashboards run faster? Your first step is to identify the problem spots by running and interpreting your performance recording. The performance recorder is every Tableau speed demon’s ticket to the fast lane. The performance recorder can pinpoint slow worksheets, slow queries, and long render-times on a dashboard. It even shows the query text, allowing you to work with your database team on optimizing at the database level.
Now that you know which views or data connections are slowing you down, below are six tips to make those dashboards more performant. For each tip, we’ve listed the most common causes of performance degradation as well as some quick solutions.
1. Your data strategy drives performance
Extracts are typically much faster to work with than a live data source, and are especially great for prototyping. The key is to use domain-specific cuts of your data. The Data Engine is not intended to be a replacement for a data warehouse. Rather, it’s meant to be a supplement for fast prototyping and data discovery.
 Since an extract is a columnar store, the wider the data set, the slower the query time.
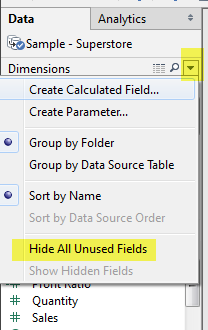
- Minimize the number of fields based on the analysis being performed. Use the hide all unused fields option to remove unused columns from a data source.
- Minimize the number of records. Use extract filters to keep only the data you need.
- Optimize extracts to speed up future queries by materializing calculations, removing columns and the use of accelerated views.
Keep in mind: Extracts are not always the long-term solution. The typical extent of an extract is between 500 million to one billion rows; mileage will vary. When querying against constantly-refreshing data, a live connection often makes more sense when operationalizing the view.
For more information on data extracts, check out these additional resources:
Video: Using and Refreshing Extracts
Online Help for Extracting Data
Understanding Tableau Data Extracts (three-part series)
2. Reduce the marks (data points) in your view
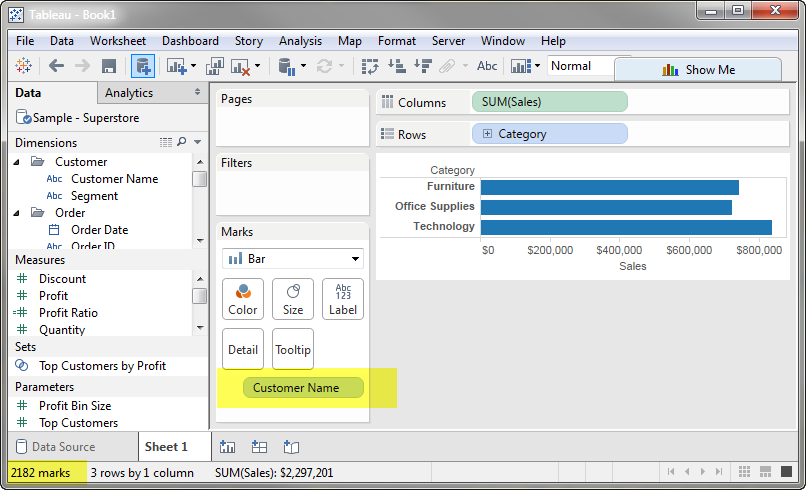
When data is highly granular, Tableau must render and precisely place each element. Each mark represents a batch that Tableau must parse. More marks create more batches; drawing 1,000 points on a graph is more difficult than drawing three bars in a chart.
Large crosstabs with a bevy of quick filters can cause increased load times when you try to view all the rows and dimensions on a Tableau view.
Excessive marks (think: data points) on a view also reduce the visual analytics value. Large, slow, manual table scans can cause information overload and make it harder to see and understand your data.
Here’s how you can avoid this trap:
- Practice guided analytics. There’s no need to fit everything you plan to show in a single view. Compile related views and connect them with action filters to travel from overview to highly-granular views at the speed of thought.
- Remove unneeded dimensions from the detail shelf.
- Explore. Try displaying your data in different types of views.
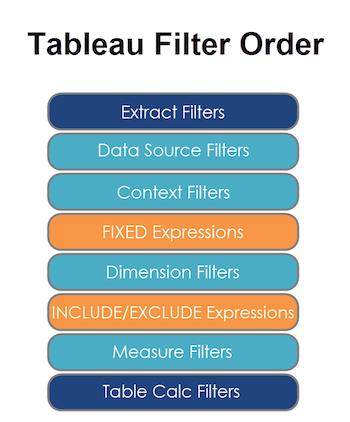
3. Limit your filters by number and type
Filtering in Tableau is extremely powerful and expressive. However, inefficient and excessive filters are one of the most common causes of poorly performing workbooks and dashboards. Note: Showing the filter dialog requires Tableau to load its members and may create extra queries, especially if the filtered dimension is not in the view.
- Reduce the number of filters in use. Excessive filters on a view will create a more complex query, which takes longer to return results. Double-check your filters and remove any that aren’t necessary.
- Use an include filter. Exclude filters load the entire domain of a dimension, while include filters do not. An include filter runs much faster than an exclude filter, especially for dimensions with many members.
- Use a continuous date filter. Continuous date filters (relative and range-of-date filters) can take advantage of the indexing properties in your database and are faster than discrete date filters.
- Use Boolean or numeric filters. Computers process integers and Booleans (t/f) much faster than strings.
- Use parameters and action filters. These reduce the query load (and work across data sources).
4. Optimize and materialize your calculations
- Perform calculations in the database. Wherever possible, especially on production views, perform calculations in the database to reduce overhead in Tableau. Aggregate calculations are great for calculated fields in Tableau. Perform row-level calculations in the database when you can.
- Reduce the number of nested calculations. Just like Russian nesting dolls, unpacking a calculation and then building it takes longer for each extra layer.
- Reduce the granularity of LOD or table calculations in the view. The more granular the calculation, the longer it takes.
- LODs - Look at the number of unique dimension members in the calculation.
- Table Calculations - the more marks in the view, the longer it will take to calculate.
- Where possible, use MIN or MAX instead of AVG. AVG requires more processing than MIN or MAX. Often rows will be duplicated and display the same result with MIN, MAX, or AVG.
- Make groups with calculations. Like include filters, calculated groups load only named members of the domain, whereas Tableau’s group function loads the entire domain.
- Use Booleans or numeric calculations instead of string calculations. Computers can process integers and Booleans (t/f) much faster than strings. Boolean>Int>Float>Date>DateTime>String
5. Take advantage of Tableau’s query optimization
- Blend on low-granularity dimensions. The more members in a blend, the longer it takes. Blending aggregates the data to the level of the relationship. Blends are not meant to replace row-level joins.
- Minimize joined tables. Lots of joins take lots of time. If you find yourself creating a data connection with many joined tables, it may be faster to materialize the view in the database.
- Assume referential integrity if your database is configured with this option.
- Remove custom SQL. Tableau can take advantage of database optimizations when the data connection does not use custom SQL.
6. Clean up your workbooks!
- Reduce dashboard scope. Excess worksheets on a dashboard can impact performance.
- Delete or consolidate unused worksheets and data sources. A clean workbook is a happy workbook.
For more details on these areas and many more, check out our whitepaper on designing efficient workbooks.
Related Stories

5 Ways to Use Tableau Public to Achieve Your Goals
 January 11, 2025

World Mental Health Day: Elevating Awareness Through Data Visualization
 October 10, 2024

From TV Screens to Tableau: Visualize Your Favorite Shows with IMDb
 August 31, 2024