Building a culture of self-service analytics? Start with data sources


Note: This is the first installment of a three-part series exploring Tableau's own culture of self-service analytics.
In order to build a culture of self-service analytics, you need two things: the right tool, and the right support.
Here at Tableau, we’re building that culture at scale with our own Drive methodology for company-wide implementation, and we’re seeing the benefits.
Every Tableau employee gets a copy of Tableau Desktop as well as access to the data. We use our own product to engage with our data, and an internal team provides enablement support. The enablement process begins with what is perhaps the most crucial step: enabling users with data.
How we use data sources
One of the most common complaints we used to hear was: “The data is too hard.” We found that many of our employees weren’t using Tableau because the database was too complex. Many people were overwhelmed with the sheer volume of data options available. And they often grew discouraged while trying to join multiple tables to get to the right data.
Now, with data sources, users get up and running with data in minutes. They no longer have to sift through database schemas to answer a simple question, or tackle complex joins to get to a basic data set. For more complex questions, we still leave direct access to the database (no single data source can answer every question, after all). But we’ve made the common questions easy to answer.
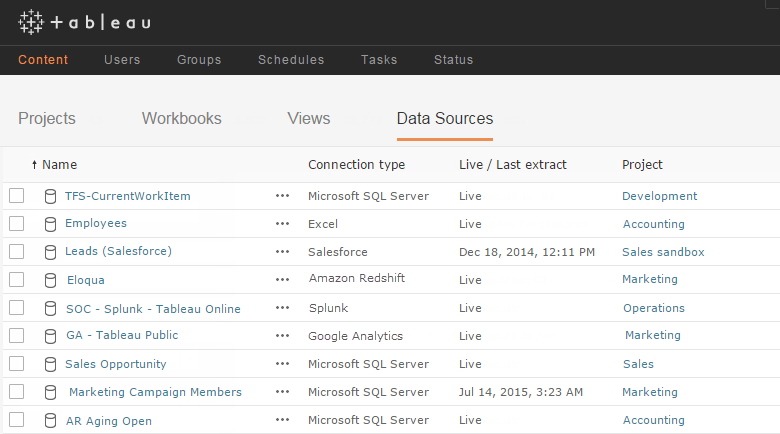
We use data sources across every department. The marketing team monitors campaigns, and the sales team analyzes the sales pipeline. Developers track software bugs, and the support team tracks customer cases. IT tracks system availability, and the operations team tracks project management. These data sources utilize many connection types including Microsoft SQL Server, Google Analytics, Amazon Redshift, Splunk, and Excel.
Our most popular data sources are accessed thousands of times each week. On any given week, more than half of our organization utilizes data sources. Data sources empower our users to make data-driven decisions every day without specialized knowledge of data structures.
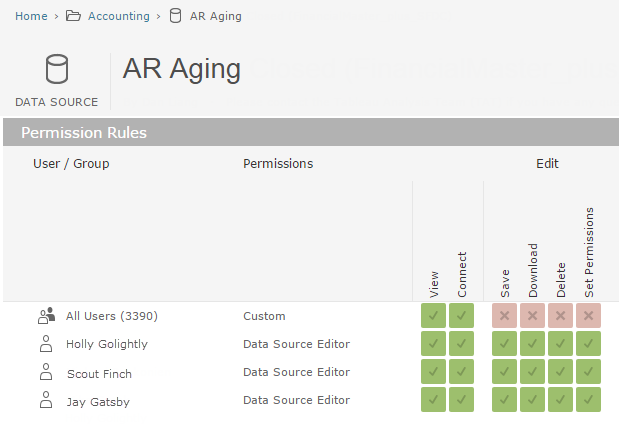
For data sources that require a bit of extra care—financial data, for instance—we manage with a light governance process. We restrict permissions to edit and download to just a few authors.
Why you should use data sources
Complex, inaccessible databases can cause users to abandon their question before they ever see their data, let alone explore it. Data sources are Tableau’s way of simplifying that complexity and jumpstarting analysis.
Data sources free the average user from having to directly interact with databases. One power user can take on the initial data discovery and prep work, then share the prepared source with a large group of people. A central team can serve this function across the organization.
This solution makes data more intuitive and approachable for the business user. It also saves time since the entire group benefits from one person’s data prep work.
This model has propelled our entire company toward self-service analysis. Our sales team can dive into the data without having to understand joins or schemas. Our colleagues in marketing have graduated to creating their own data sources for deeper analysis. And teams in tech support and development also benefit from this time-saving approach.
Create user-friendly data sources
Data sources are only useful if they’re user-friendly. Here are some tips to ensure your data sources are easy to use.
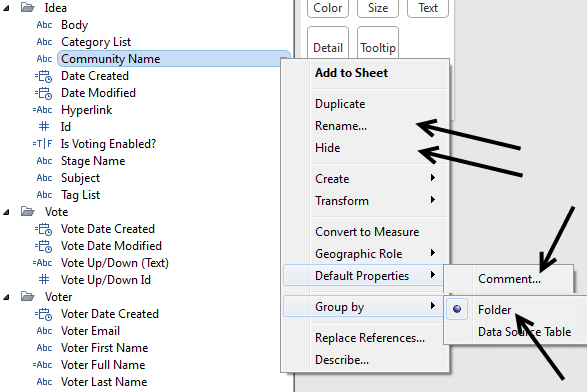
Rename fields: Make them more intuitive to users. What are they used to seeing something called in Salesforce? Is that term consistent with how it is named in the data? Remove any database-centric naming conventions like underscores.
Hide unused fields: Show the fields that you know are valuable and accurate to showcase in the data source. Hide everything else. A great data source can be ruined by too much noise. It’s better to miss a couple of fields that someone may use at some point than to add 100 superfluous fields just in case they are needed. Keep in mind that it’s much easier to unhide a field later if someone requests it than it is to hide something already being used in the data source.
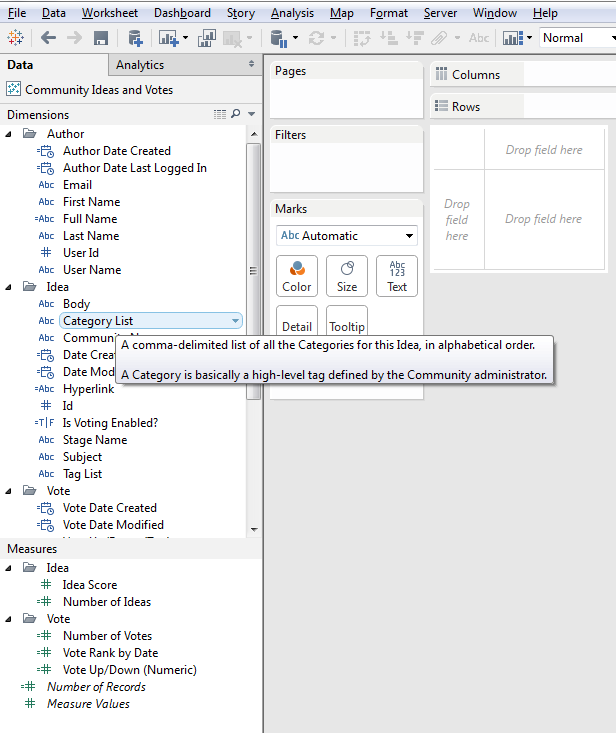
Add definitions in line: You can use Default Properties > Comment to add a definition to a field. This definition will appear when users hover over the field. You don’t have to do them all, but defining the commonly-used fields can be very helpful.
Use folders: Use folders to help users quickly find the data they need.
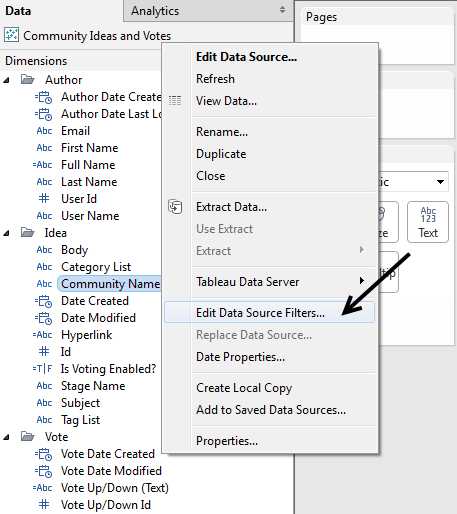
Filter out extra data: Use data source filters to filter out data that will never be needed (i.e. we remove complimentary copies from data sources intended for the sales audience).
Add a description: When you publish a version to Tableau Server, write out a description. Specify the intended audience, and the source of the base data. This will allow users to quickly scan through data sources when connecting.
Make data sources fast & agile
Data sources can be used and shared for both direct connections and extracted connections. In the event that your live connection is not fast, use extracts whenever possible. (But do make sure to hide unused fields and filter out extra data as mentioned above.)
Many of our data sources have more than 10 million records. By running these data sources off extracts, we can deliver data that’s both user-friendly and lightning-fast.
It’s also important to be agile. Iterate quickly, then roll out. View your data as a starting point, not the end. It can be tempting to try to create a data set that answers every question. Instead, focus on delivering a data set that can answer the most important questions. This will get the analytic journey started. You can always dig into more data later on.
And start collaborating in the early days. When you are building data sources, seek the perspective of a power user or an expert on the data’s subject matter.
Once you’ve got a data source, run a short pilot period (~1 week with ~20 users). Ask them to try it out and give feedback. You can make major changes during this period, even structural, without worrying about workbooks breaking.
Using this process, we’ve been able to roll out enterprise-ready data sources in a matter of weeks.
Once you’ve refined the data source, share it more widely. Write a note on your shared wiki, and send out an email to anyone who might want to use the data source. It’s better to overshare here. People want this data and will be excited to have a tool that makes their lives easier.
Read the rest of this series
Learn more about Tableau data sources
Learn more about building a culture of self-service analytics
Related Stories
How EMD Serono is improving patient care with personalized, AI-powered insights from Tableau
 September 30, 2024

Embedded Analytics: Should you build or buy?
 June 7, 2022

Data fabric’s value to the enterprise
 May 11, 2022