5 stylish chart types that bring your data to life
5 chart types you may have never used that add flair to any dashboard.


As our community members show every day, there are endless inventive ways to visualize your data. And while bar graphs and pie charts have their place, sometimes an advanced chart can be the perfect fit to convey the most important insights, on sight.
Here we offer 5 advanced chart types to bring your data to life:
1. Treemap
Treemaps are a powerful and compact way to visualize hierarchical and part-to-whole relationships. Each branch of the tree is represented as a rectangle, with the size of a branch proportionate to a specified measure of the data. A lot of people like treemaps because they're visually attractive, so understanding how to leverage color is a plus. Color is often used to show dimensions in a treemap—heat maps work well if you want to show a spectrum.
What’s more, you can go way beyond the standard treemap in Tableau. For example, here’s an interactive chart of treemaps mashed up with a bar chart:

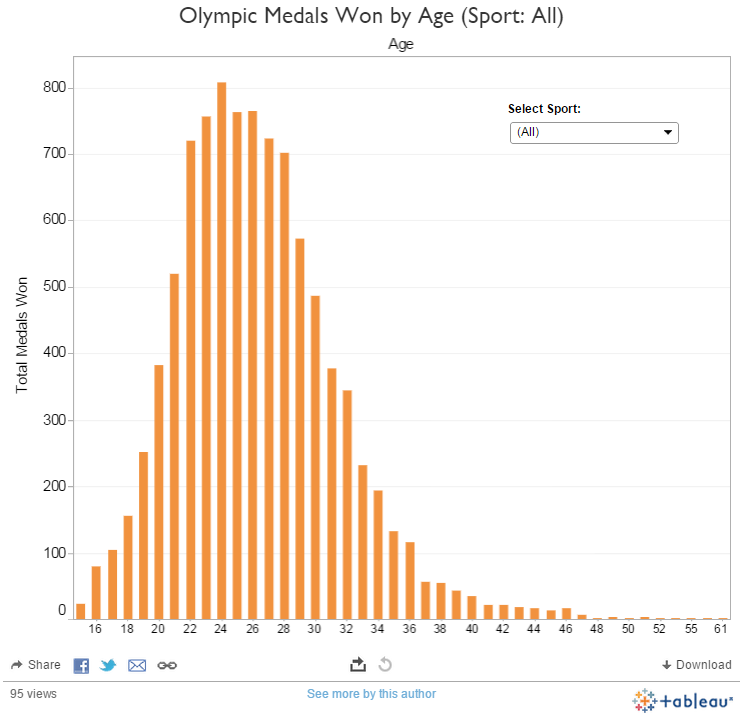
2. Histogram
Histograms plot the number of occurrences of a given variable in a set of data. They’re a great tool for getting an overview of the entire distribution of a variable, and they take the form of a bar chart. Imagine using histograms for retail analytics, to count the number of sales of individual products by category. Or in customer analytics, to tally the range of spending in a certain demographic.
Here’s a fun example, where you can explore how many medals were won by Olympic athletes of a certain age:

3. Box plot
A box plot (or box-and-whisker plot) is a diagram of a distribution of data best known for highlighting these values:
- first quartile
- median
- third quartile
- whiskers (1.5 times the interquartile range away from the mean)
- outliers
Box plots are useful for comparing sets of data—especially the variations in the data. They're a favorite of statisticians, and used commonly in statistical analytics. Tableau can plot hundreds of thousands of rows per second, so it can convey much more information than the standard box plot.
Ideal for the housing market, the following example shows home sales in five cities. At a glance you can see that the median price in San Francisco is the highest, but Los Angeles has the most expensive house sold:


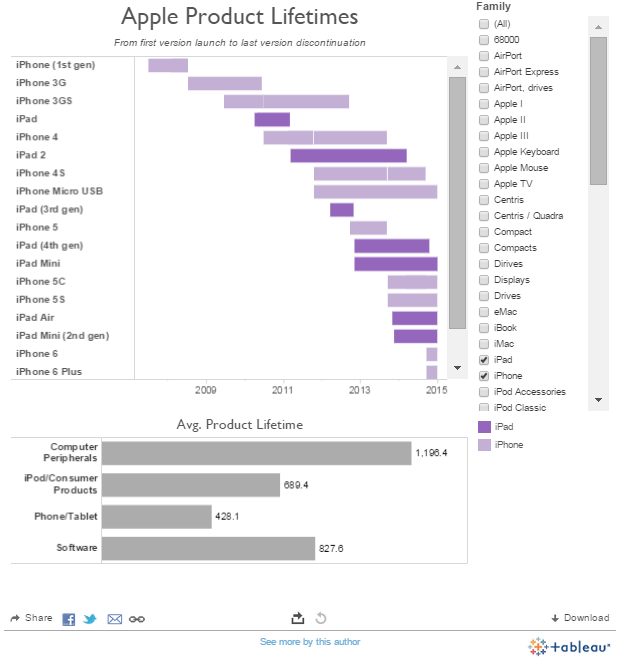
4. Gantt chart
Gantt charts are the enemy of procrastination, keeping those micro-deadlines between projects well in view. They’re great for displaying a timeline such as project stages or a product release—to ensure you release the beta before the product.
The viewer can instantly see when parts of a project begin and end in relation to each other, without having to cross check between pages or sheets. Did you know? The first Gantt-type chart was developed in 1896, and was called a harmonogram. So all your departments can work in harmony.
And as Henry Gantt would tell you, it's not a Gant chart.
Here's an example, showing the launch/discontinuation dates of all of Apple's products:

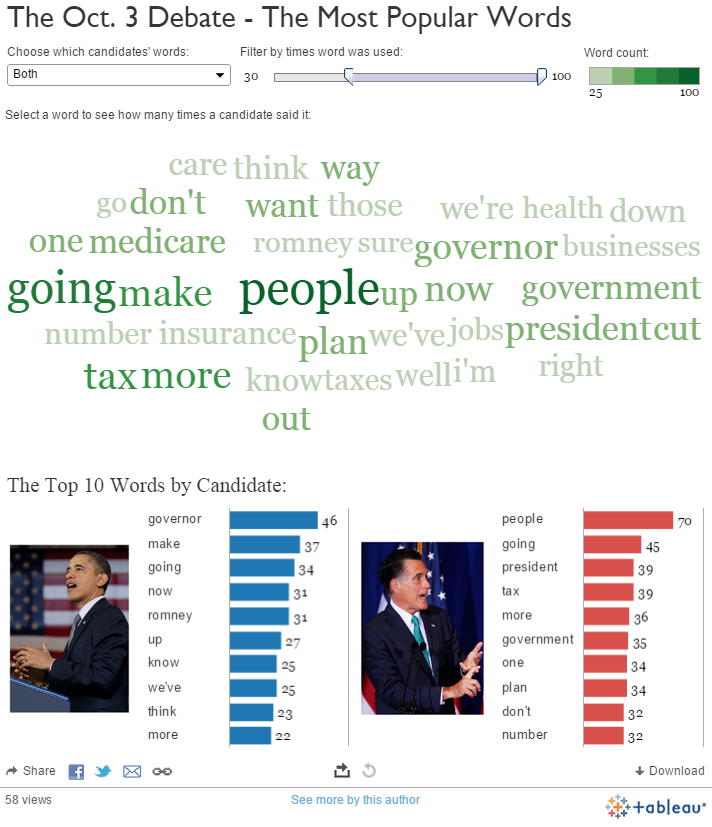
5. Word cloud
Word clouds are like bubble charts in that words are sized according to some numerical measure and all packed into a designated space. They’re useful for presenting data about—you guessed it—words. While word clouds are not the best for accurate interpretation, sometimes they add impact to a dashboard and encourage more people to engage with the data.
Here's a word cloud of frequencies in the last presidential debates. (See any political jargon?)

Learn how to build a treemap (or word cloud) in Tableau
Hopefully you now feel confident using these advanced chart types to invigorate your dashboards. What's more, 4 out of 5 of these are in Show Me—go ahead and give them a try!
Related Stories

5 Ways to Use Tableau Public to Achieve Your Goals
 January 11, 2025

World Mental Health Day: Elevating Awareness Through Data Visualization
 October 10, 2024

From TV Screens to Tableau: Visualize Your Favorite Shows with IMDb
 August 31, 2024