Data Blending in Tableau: An Academic Perspective


Recently Kristi Morton of the University of Washington’s Computer Science department has been a regular presence at Tableau talking with various members of the development team as part of her research. She’s just published the result of all that work in a new academic paper called Dynamic Workload Driven Data Integration in Tableau. It covers use cases, architecture and background for Dynamic Workload Driven Data Integration—the feature we call Data Blending.
"This is an important area because data comes in many different forms (just look at the availability of data on the Web!), and if we make it easy to combine data in a meaningful way, we can gain insight into new realms.”

Kristi Morton of the University of Washington computer Science Department
In the paper, Kristi talks about why Tableau’s Data Blending has taken us closer to that scenario: “Because our data blending is workload-driven, we are able to bypass many of the pain points and uncertainty in creating mediated schemas and schema-mappings in current pay-as-you-go integration systems.” In other words, Data Blending can eliminate the need to combine data into a warehouse or cube before performing analysis on it—and therefore makes it much easier and faster to explore relationships across data sets.
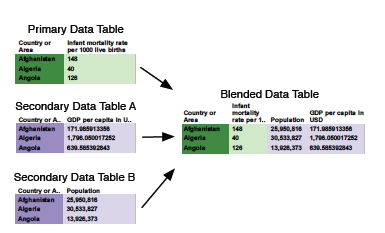
Data blending explained, from Kristi's paper.
Kristi also writes on why post-aggregate joins are most natural for exploratory analysis and describes in detail how different data sets would be joined based on their data. It’s a great read for anyone interested in understanding better how Data Blending works, or anyone interested in the problems of working with disparate data sets in general.
Data Blending was the sleeper hit of Tableau’s 6.0 release. It lets you combine disparate data sets on the fly simply by connecting to them and dragging fields into the view. Customers have loved the feature since we launched it. I’ve heard from customers who say it’s saved them months of work or let them do analyses they would not have even attempted before.
Kristi also deserves some congratulations, because the paper is going to appear in the 2012 ACM SIGMOD International Conference on Management of Data in the Industrial Track. It's considered the big databases/information management conference, so if you’re not in the computer science world you should know that this is a really big deal.
Also at SIGMOD, Tableau’s very own Pat Hanrahan will be one of the keynote speakers. Says Kristi: “I know that may seem strange at first blush that a professor of graphics is giving the keynote at *the* big databases conference, but I think that speaks volumes about the community and the challenges that we've faced and how we need to turn to unconventional approaches to solve hard problems.”
Co-authors of the paper are Ross Bunker, Jock Mackinlay, Robert Morton, and Chris Stolte.
You can download the paper here. Or to see this capability in action, watch a Data Blending video or take a training on Data Blending.