Overall Satisfaction and View of Vendor’s Future Go Hand in Hand


This blog entry is part of a series that reviews and discusses recent reports from Gartner.
In their analysis of business intelligence software vendors, Gartner also examines customers' satisfaction with their vendor's support and quality. As many software buyers know, the overall satisfaction with a software provider is based on many dimensions including product quality, response times, business relationship, support quality, website resources, and so on.
And in making a purchase decision, software buyers also know they are not just buying software for today; it likely is software that will be used for years to come. So having satisfaction with the vendor’s product of today and confidence in that vendor’s future is important.
In the graph below, the Overall BI Platform Success score on the horizontal axis represents composite ratings for product capabilities, support, sales experience, product quality and performance, with equal weightings for each — the higher the composite score, the more positive the overall experience with the vendor. The vertical axis records responses to a question about whether respondents were more concerned about the vendor in 2010, more positive, or unchanged in their view. We're pleased with Tableau's position and very much appreciate our customers' opinions about our current overall success and their opinions about our future.
Figure 1. Satisfaction With Vendors, Change in Future Outlook and Average Business Benefits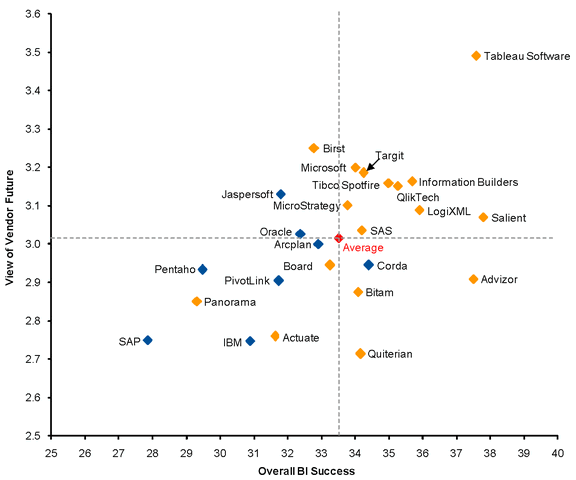
Source: BI Platforms User Survey, 2011: Customers Rate Their BI Platform Vendors, 31 March 2011, Rita L. Sallam, Gartner Research Note G00211769. Chart represents customer perception and not Gartner's opinion.The chart may feature vendors that (in Gartner's opinion) do not deliver the functional capability described.N=1,127
A related chart is the scatterplot of sales experience and overall customer experience. According to Gartner, “there does appear to be a direct correlation between sales and experience and overall customer experience.” Notice that there are no real “outliers” – vendors who have a great sales experience but terrible software/support quality, or vendors who have terrible sales experiences but great software/support quality.
Figure 2: Overall Customer Experience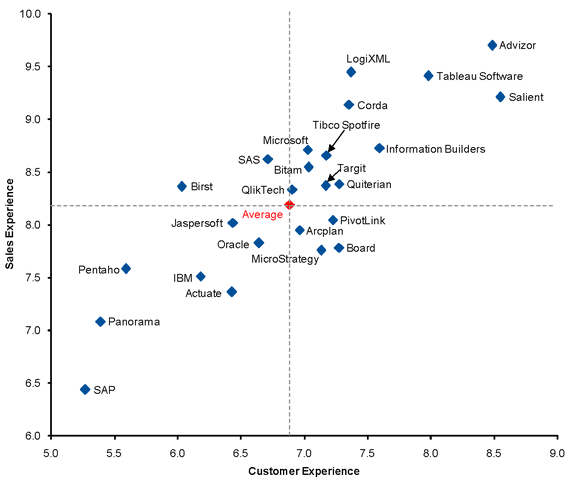
Source: ibid. Chart represents customer perception and not Gartner's opinion.The chart may feature vendors that (in Gartner's opinion) do not deliver the functional capability described.N=1,127
Tableau has made the full Magic Quadrant report and the supporting Gartner detailed reports available at no charge at http://www.tableau.com/gartner-2010-overview.
Subscribe to our blog
Get the latest Tableau updates in your inbox.