Tableau August 2026 Release
Tableau Next Semantic Model Builder, MCP Authoring, and more
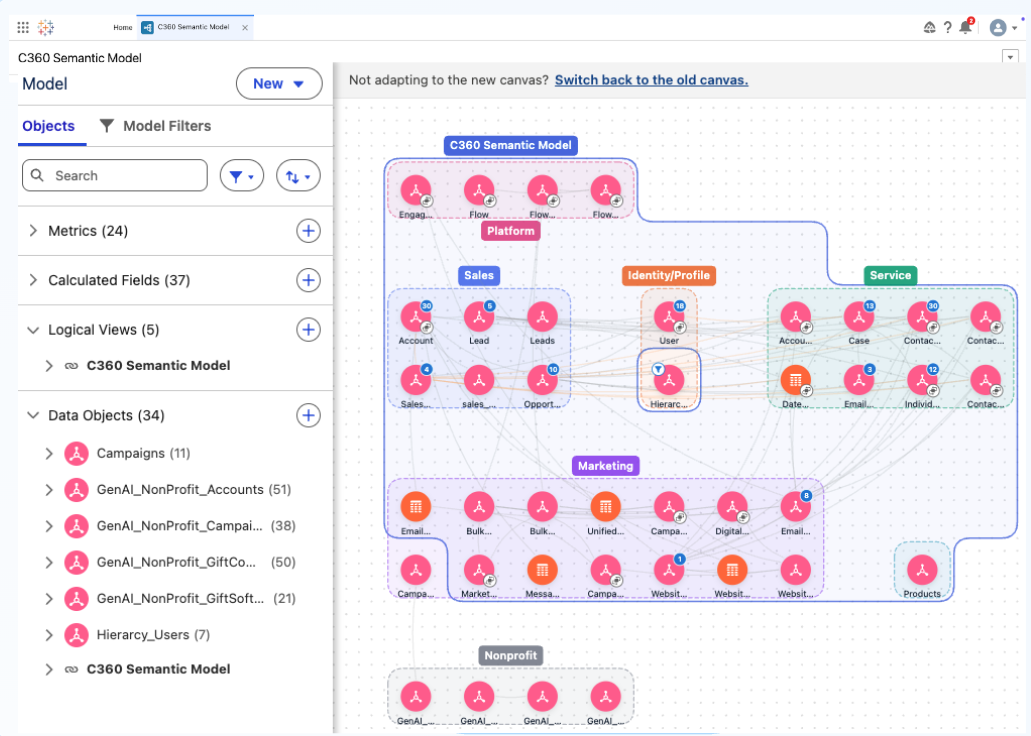
Tableau Next: Semantic Model Builder, Smart Canvas
Author and explore semantic models at any scale with an enhanced canvas experience in Tableau Semantics. Smart auto-layout, infinite navigation, inline editing, and domain-based grouping handle enterprise complexity so your team can iterate faster.
Semantic Model Builder - Smart Canvas is generally available in Tableau Next
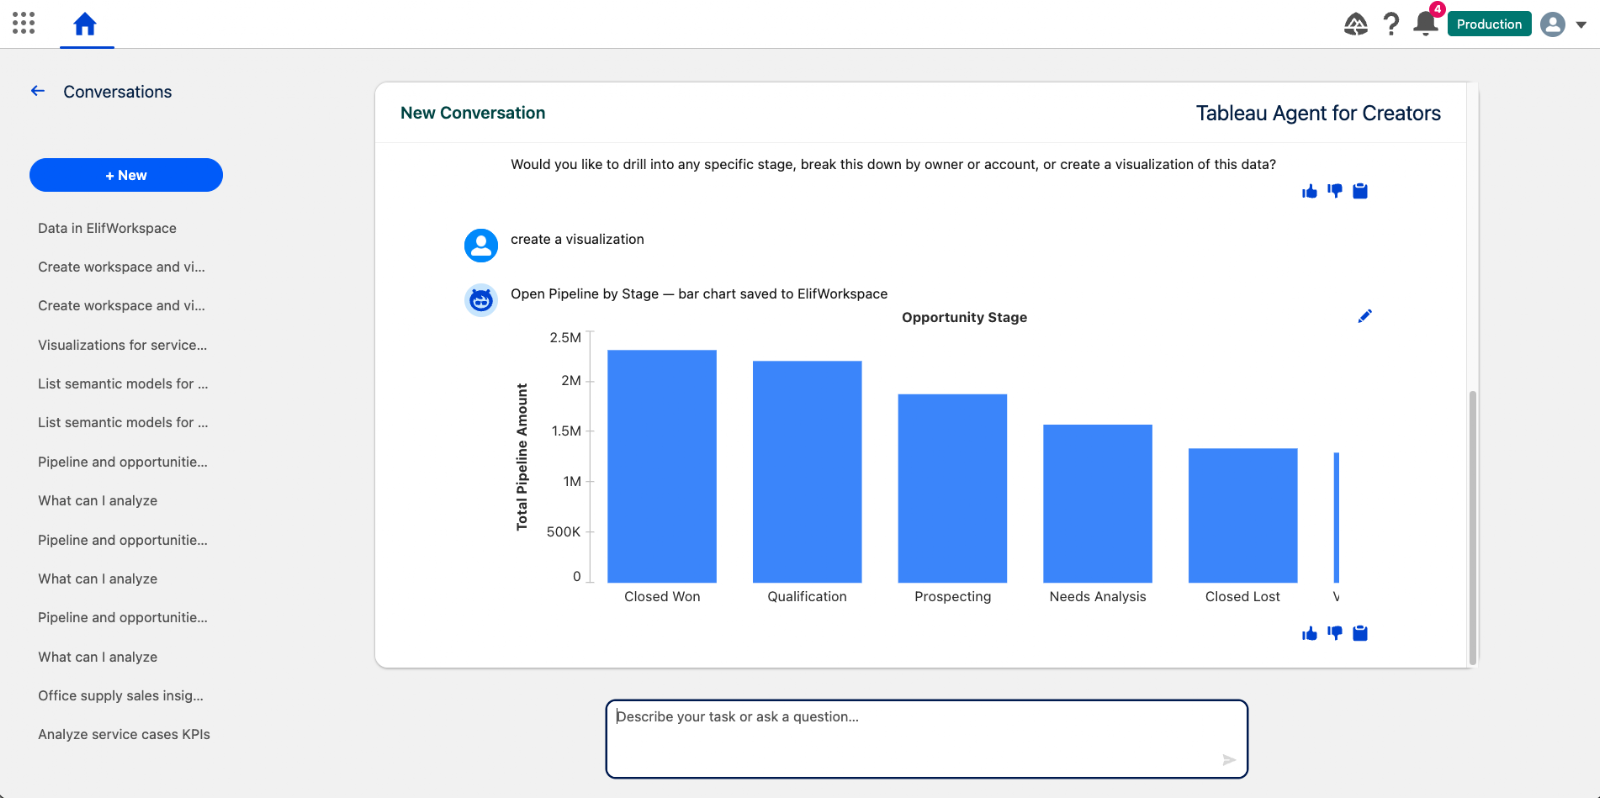
Tableau Next: Tableau Agent - Data Connection and Analytics Creation (Beta)
Accelerate data discovery, semantic modeling, and viz building conversationally with Tableau Agent. Automatically locate semantic models, enrich data relationships, and generate editable visual assets to move from data to insight faster.
Tableau Agent - Data Connection and Analytics Creation is available in Beta in Tableau Next.
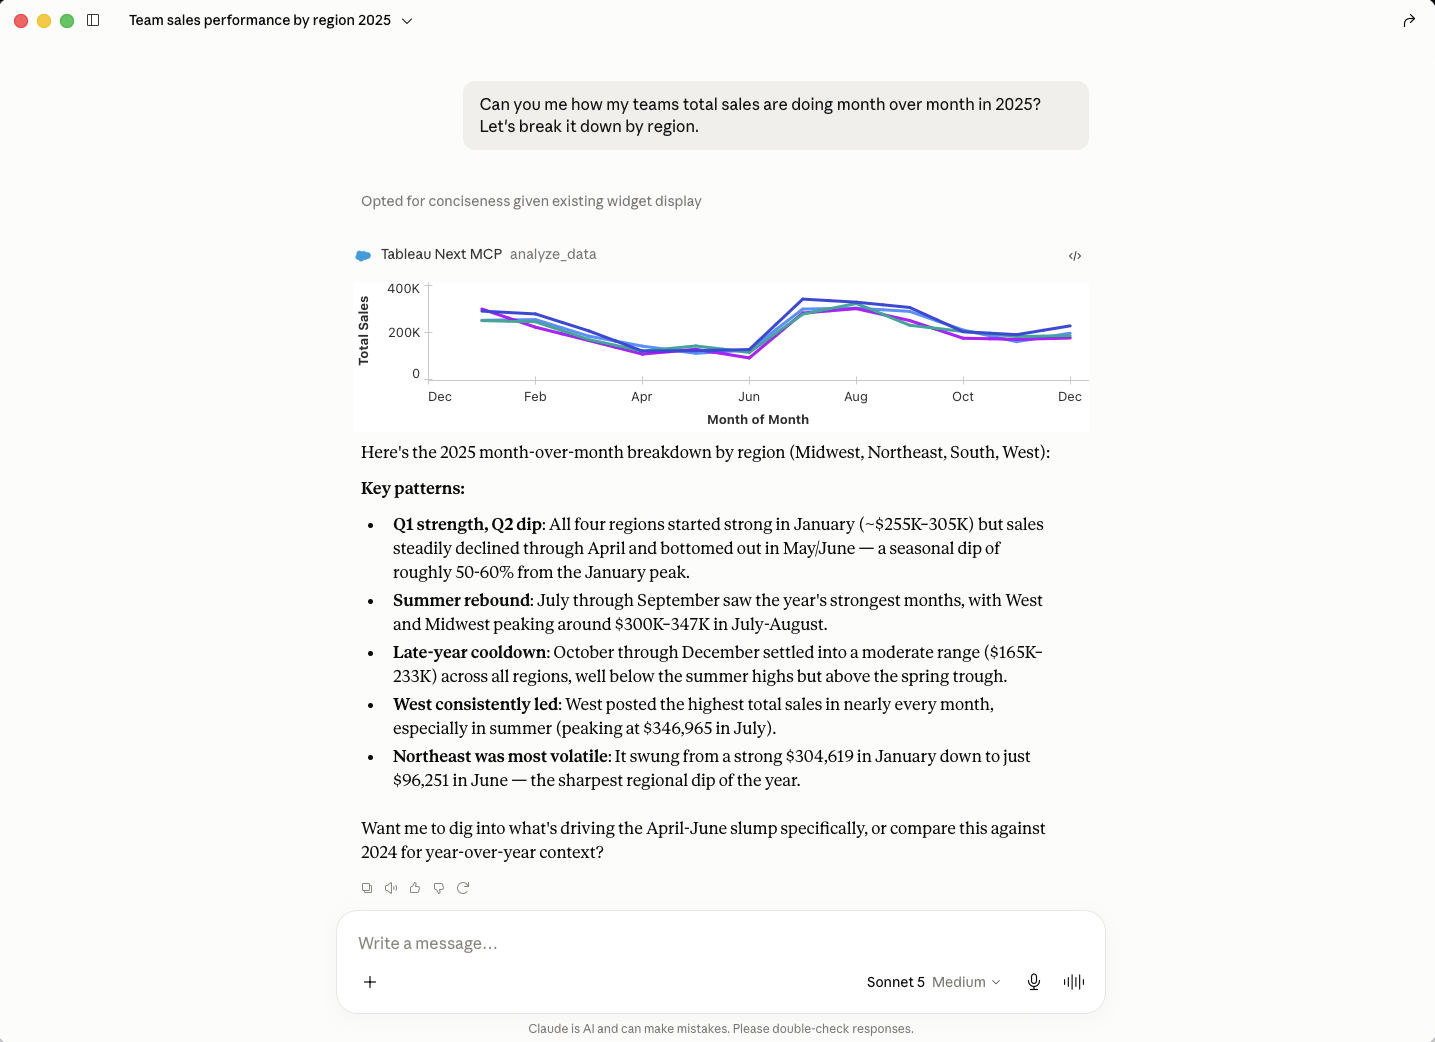
Tableau Next MCP: Authoring (Beta)
Gain early access to next-generation AI analytics capabilities across dashboards, semantic modeling, and proactive alerting. Opt-in to test emerging tools and shape product quality while accelerating conversational workflows.
Tableau Next MCP: Authoring is coming soon in Beta.
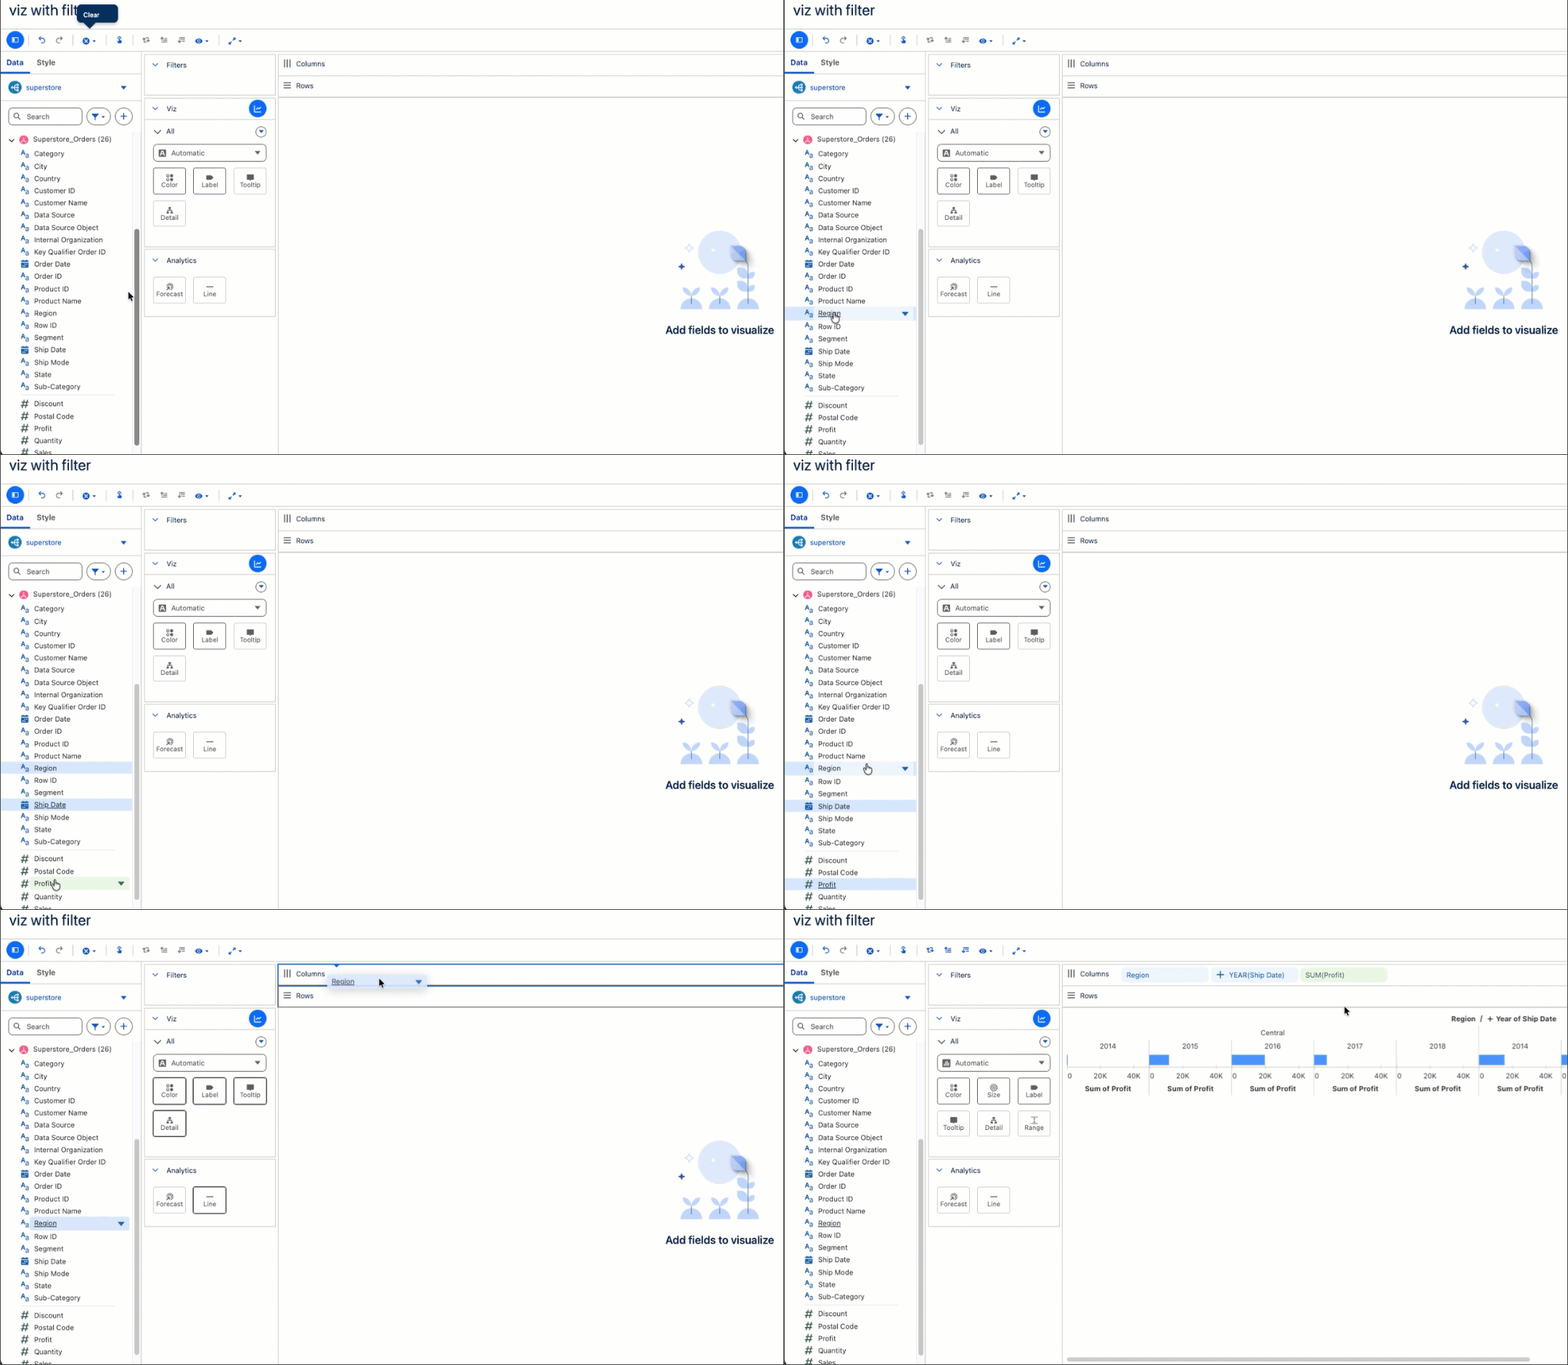
Tableau Next: Viz and Dashboard Authoring Enhancements
Tableau Next takes the friction out of building, from your first viz to the finished dashboard. Select multiple fields at once, drop them onto the canvas, and build complex charts like waterfalls faster. Duplicate widgets, copy styles, and manage multi-page dashboards with simple right-clicks, so you spend less time on layout and more time on analysis.
Viz and Dashboard Authoring Enhancements are generally available in Tableau Next.
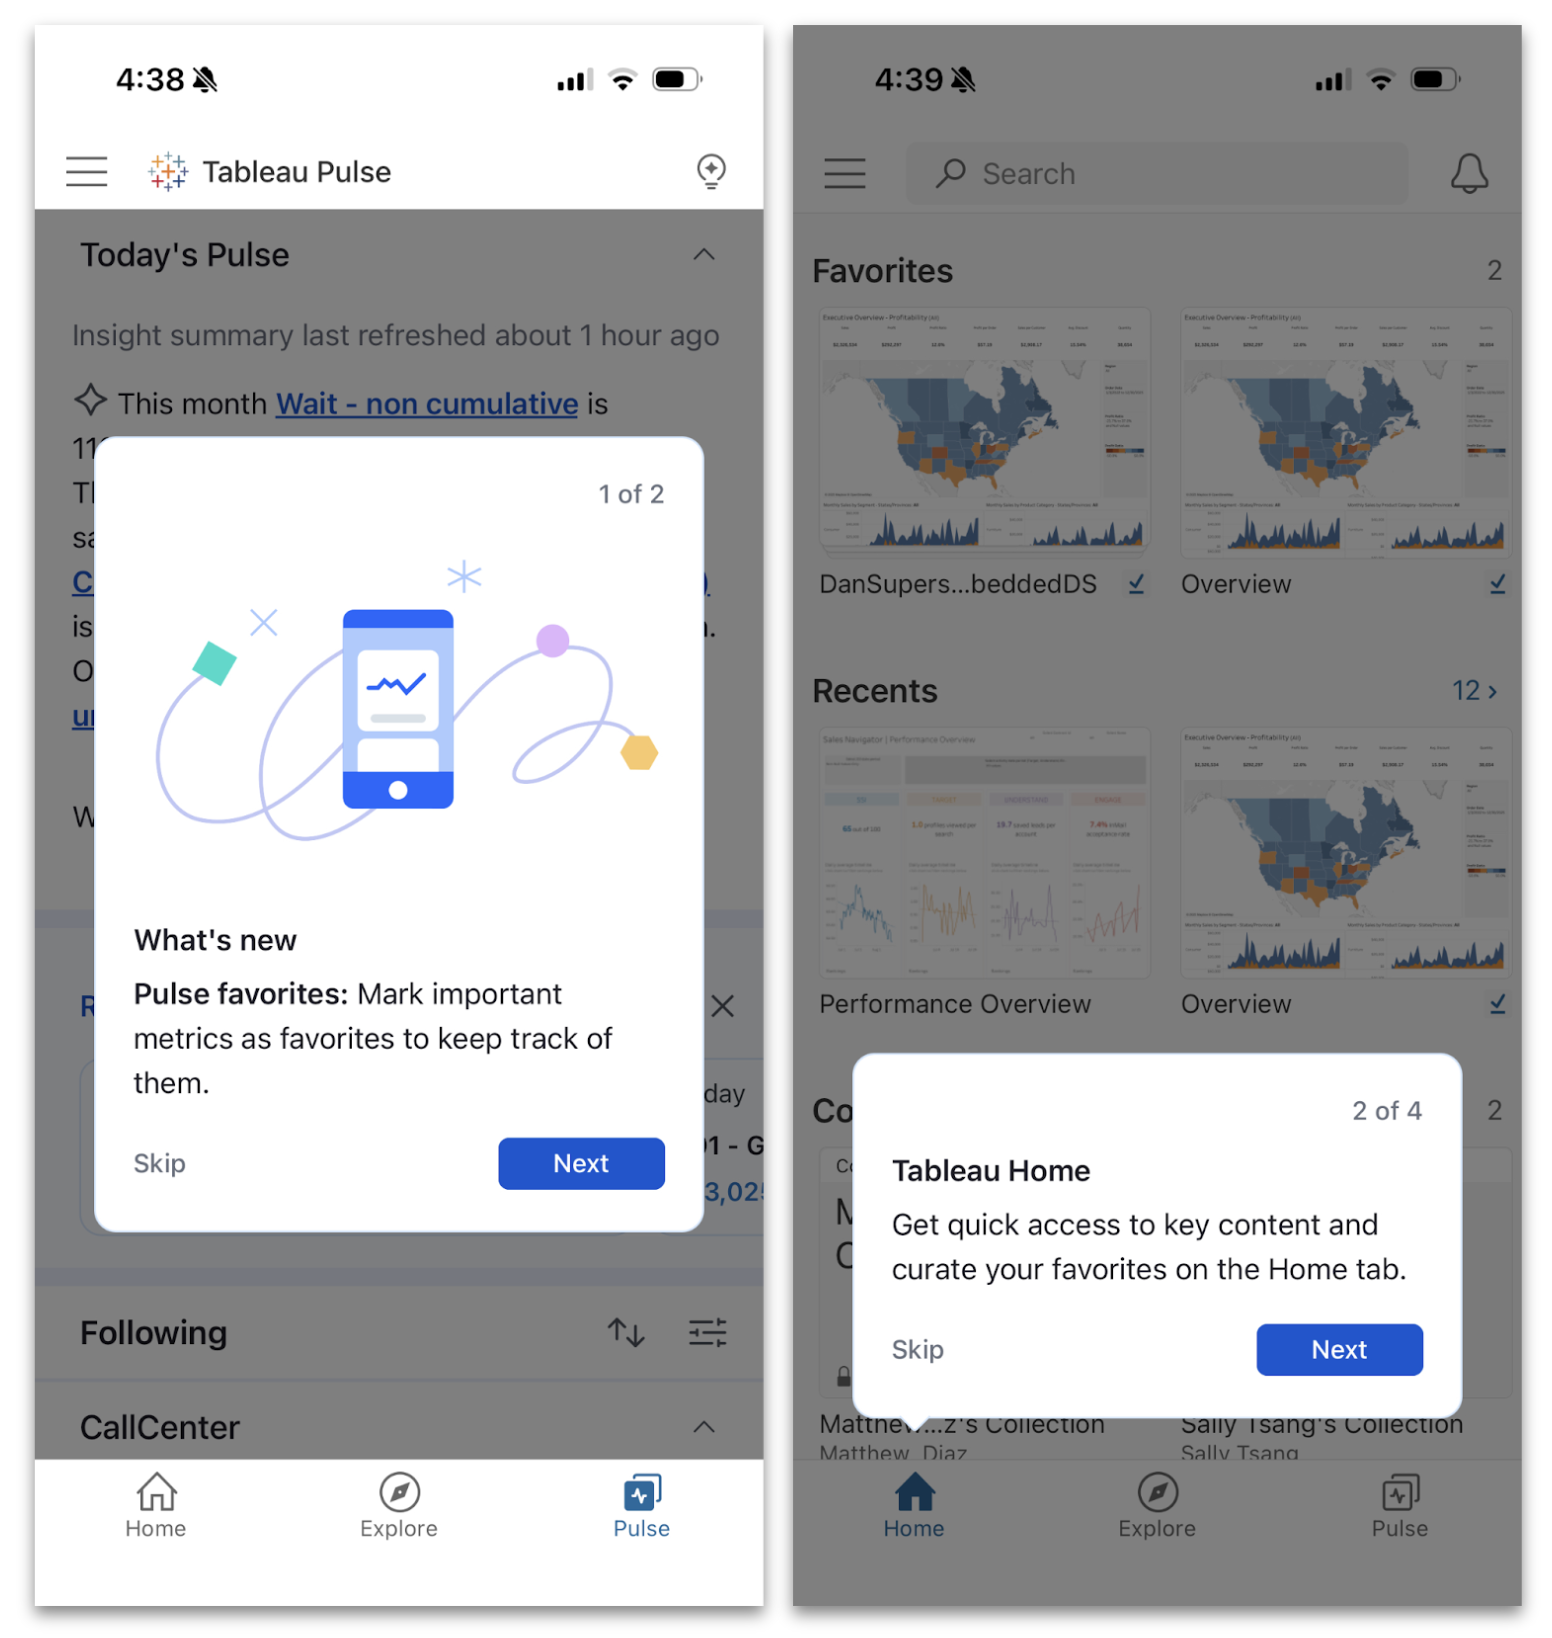
Tableau Mobile Enhancements for Clarity, Confidence, and Comfort
We're making it even easier to stay connected to your data on the go with a more intuitive mobile experience at every step. Unlock value faster by walking through key features with guided onboarding prompts, confirm a viz's data lineage and metadata with data details, and enjoy a more relaxed view of your Pulse insights in dark mode. With these updates, you're not just checking in on your phone, you're making smarter decisions from anywhere, with less friction
Guided Onboarding Prompts, Data Details, and Dark Mode in Tableau Pulse are generally available in Tableau Mobile.

Get the Inside Track on Tableau Releases
Learn from Tableau Product Managers about the new features we're releasing on our DataFam Discovery User Group.
Join Now
All Features
September

Tableau Pulse and Tableau Agent are now Geo-Aware
Experience faster, more secure AI in Tableau. Now, Pulse and Agent automatically connect to the nearest LLM provider based on your Data Cloud region. This boosts performance and keeps your data in-region.
Note: Currently limited to one LLM

Tableau Pulse: Recommended Metrics on Mobile App
Discover metrics that matter to you with new recommended metrics on the Tableau Mobile app. You no longer need to leave the mobile app and search manually for metrics. Simply follow recommended metrics and instantly start receiving insights on the go.
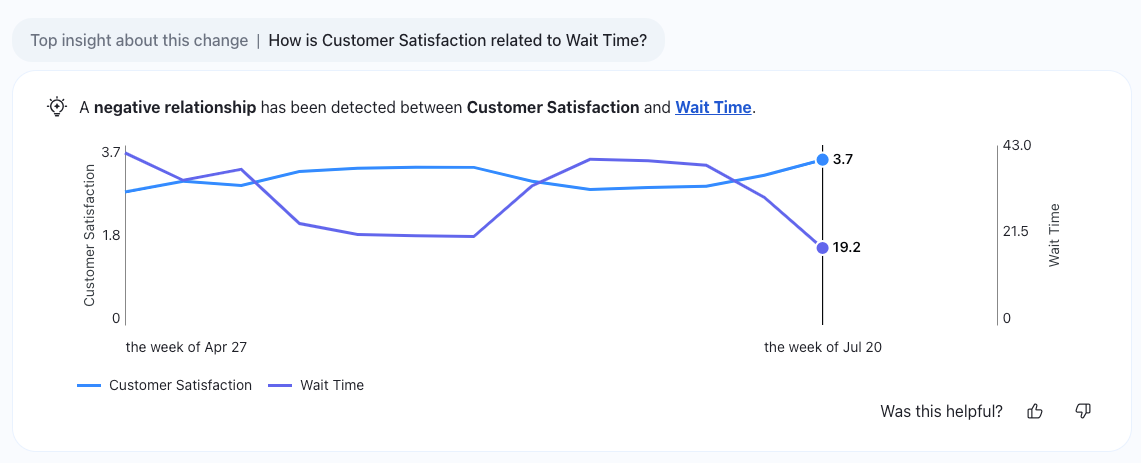
Tableau Pulse: Correlated Metrics Insights
Get even deeper insights in Tableau Pulse with a new insight type. Correlated Metrics helps you find significant relationships between metrics by identifying key correlations in your data.
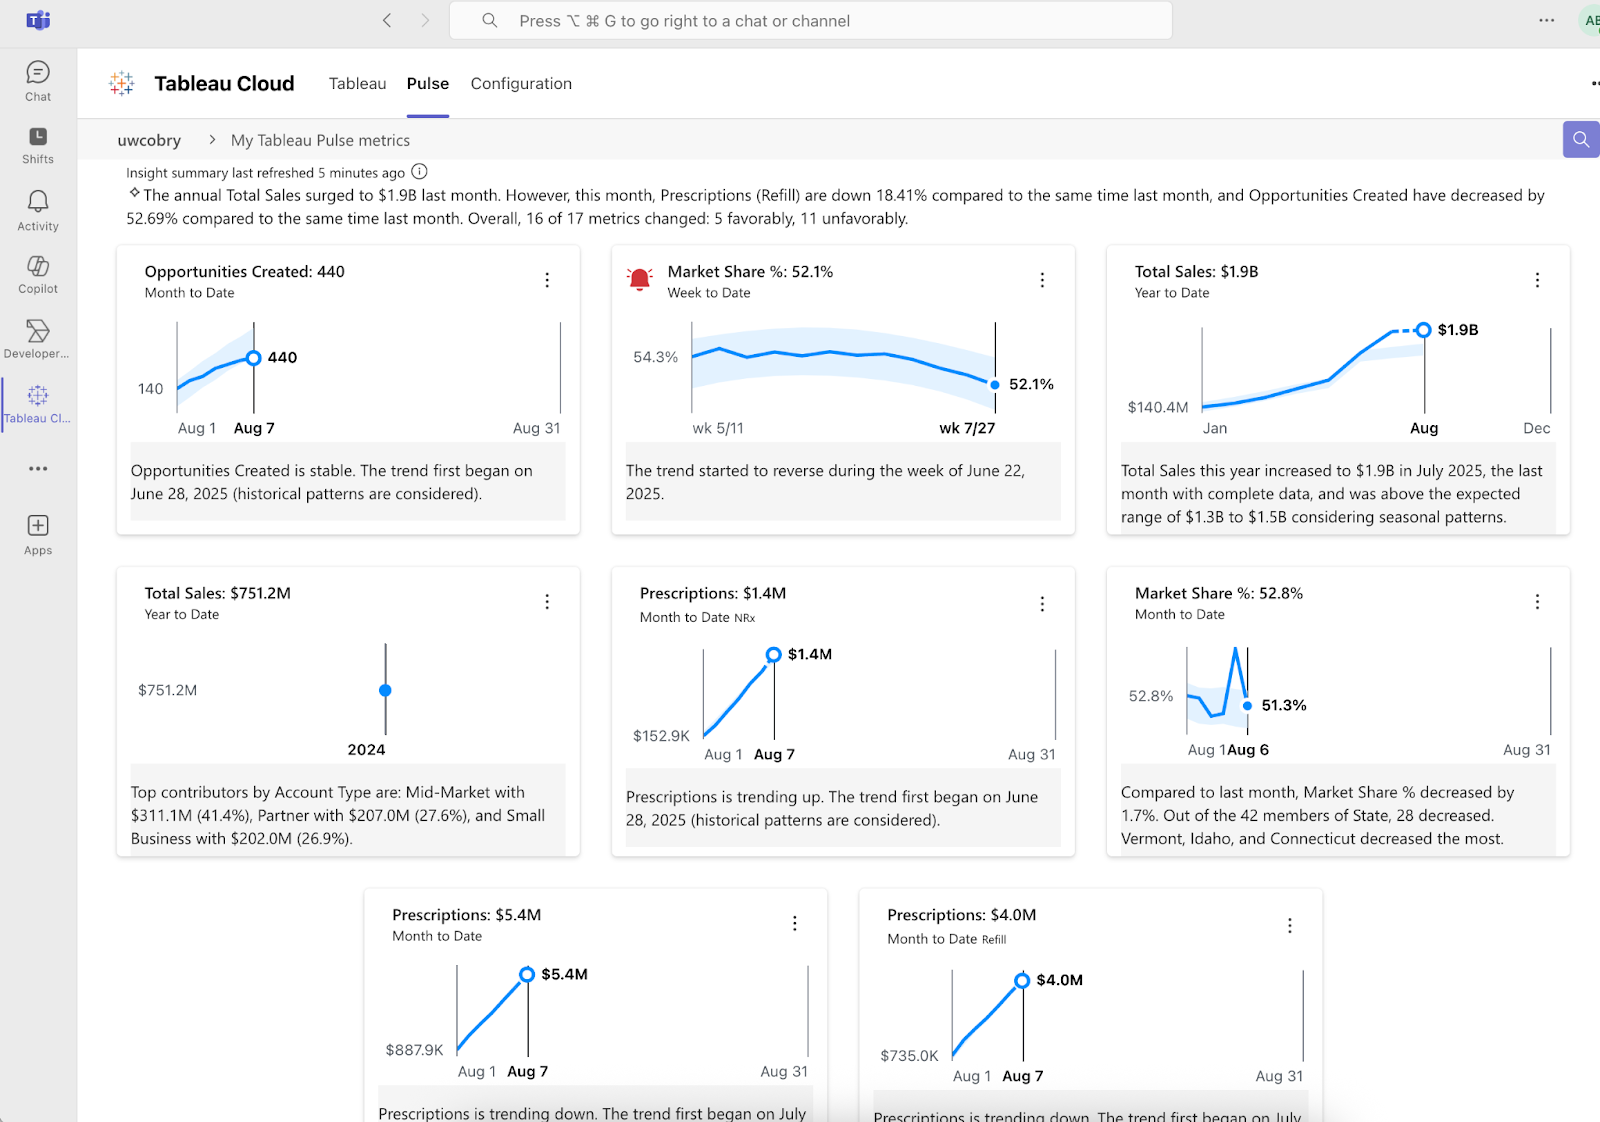
Tableau Pulse: Improvements to Teams Integration
Get more insights delivered into your Microsoft Teams workflow with deeper integrations that bring more of the Pulse experience to Teams. Get your Insight Summary, localized insights, and alerts right in your flow of work.
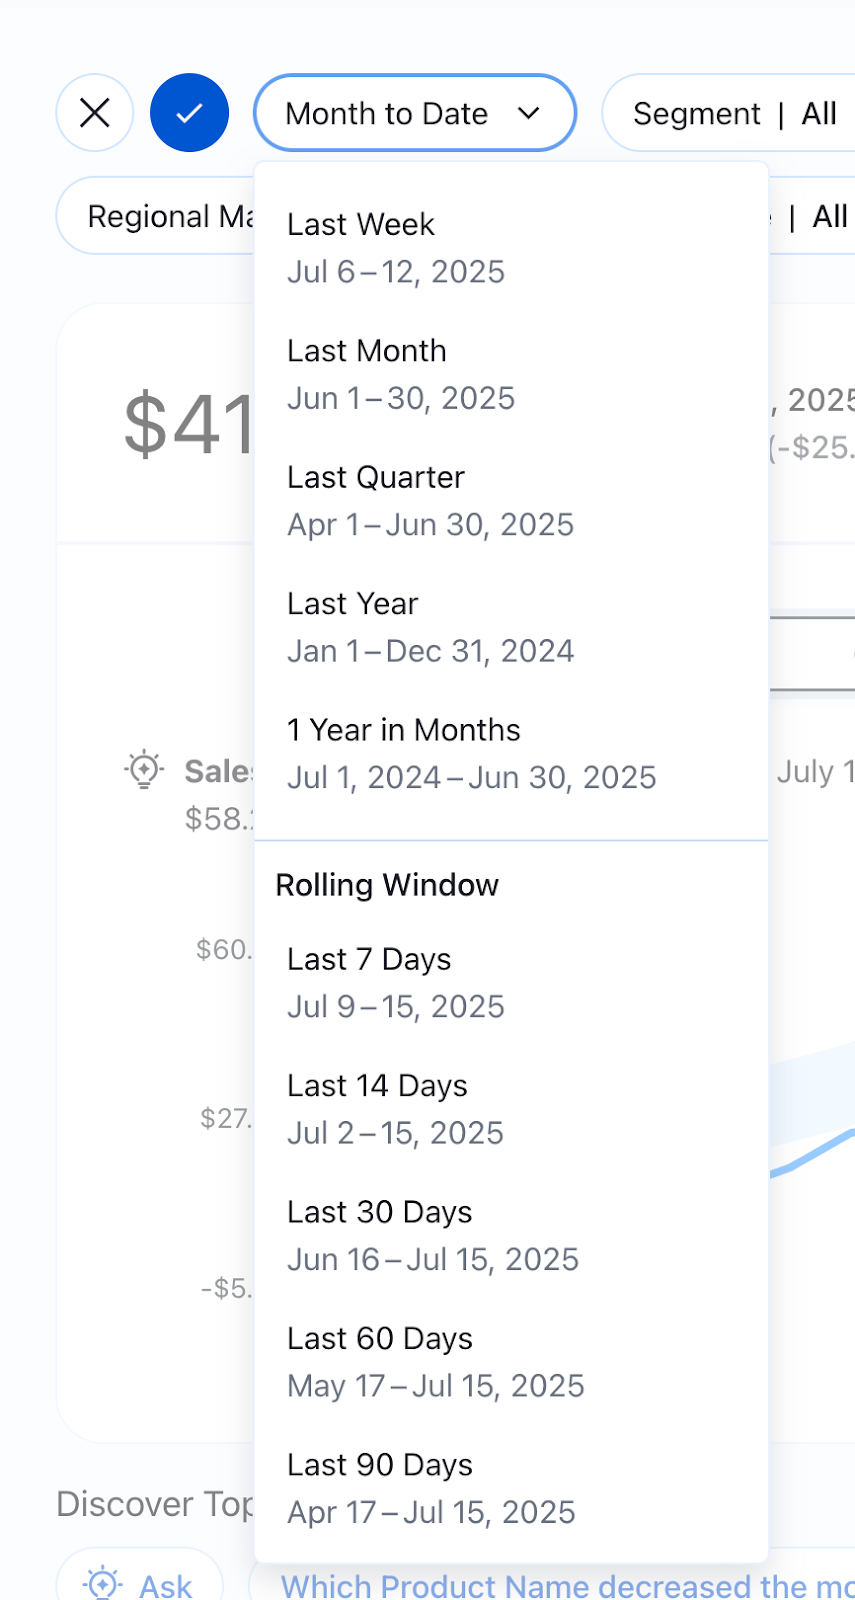
Tableau Pulse: Rolling Time Ranges
Examine the performance of your key metrics with a wider selection of time ranges to get a more precise understanding. Broader time ranges now include rolling time ranges like the last 7 days or last 90 days and more
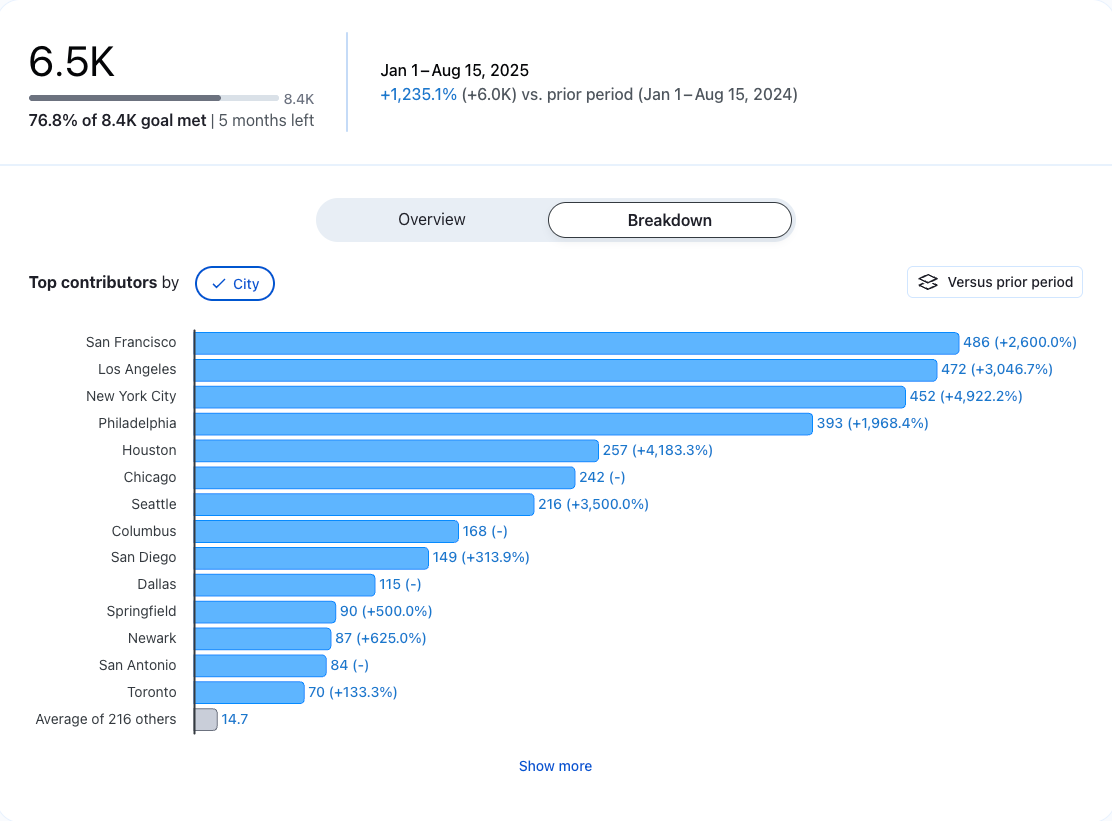
Tableau Pulse: See More Data on Breakdown Charts
Gain a more complete picture of the drivers behind a metric or goal with the “Show More” button on breakdown charts. See beyond the top 7 contributors to the insight to dig deeper and see the more minor contributors easily.
This feature addresses or partially addresses the following request on the Salesforce IdeaExchange: Reload Current Tab.
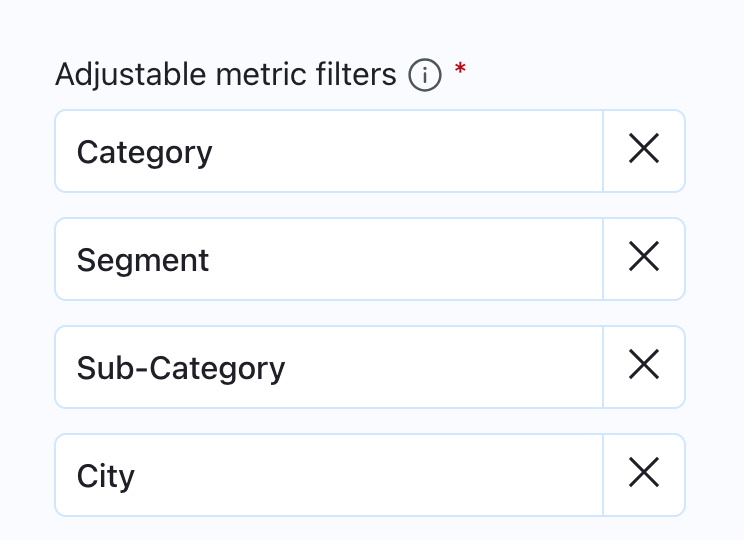
Tableau Pulse: Breakdown Chart Filtering Enhancements
Get a more consistent experience on metric detail breakdown charts with static ordering of dimension pills. Order is now based on the adjustable metric filters set on the metric definition instead of changing based on data conditions to offer a more predictable user experience.
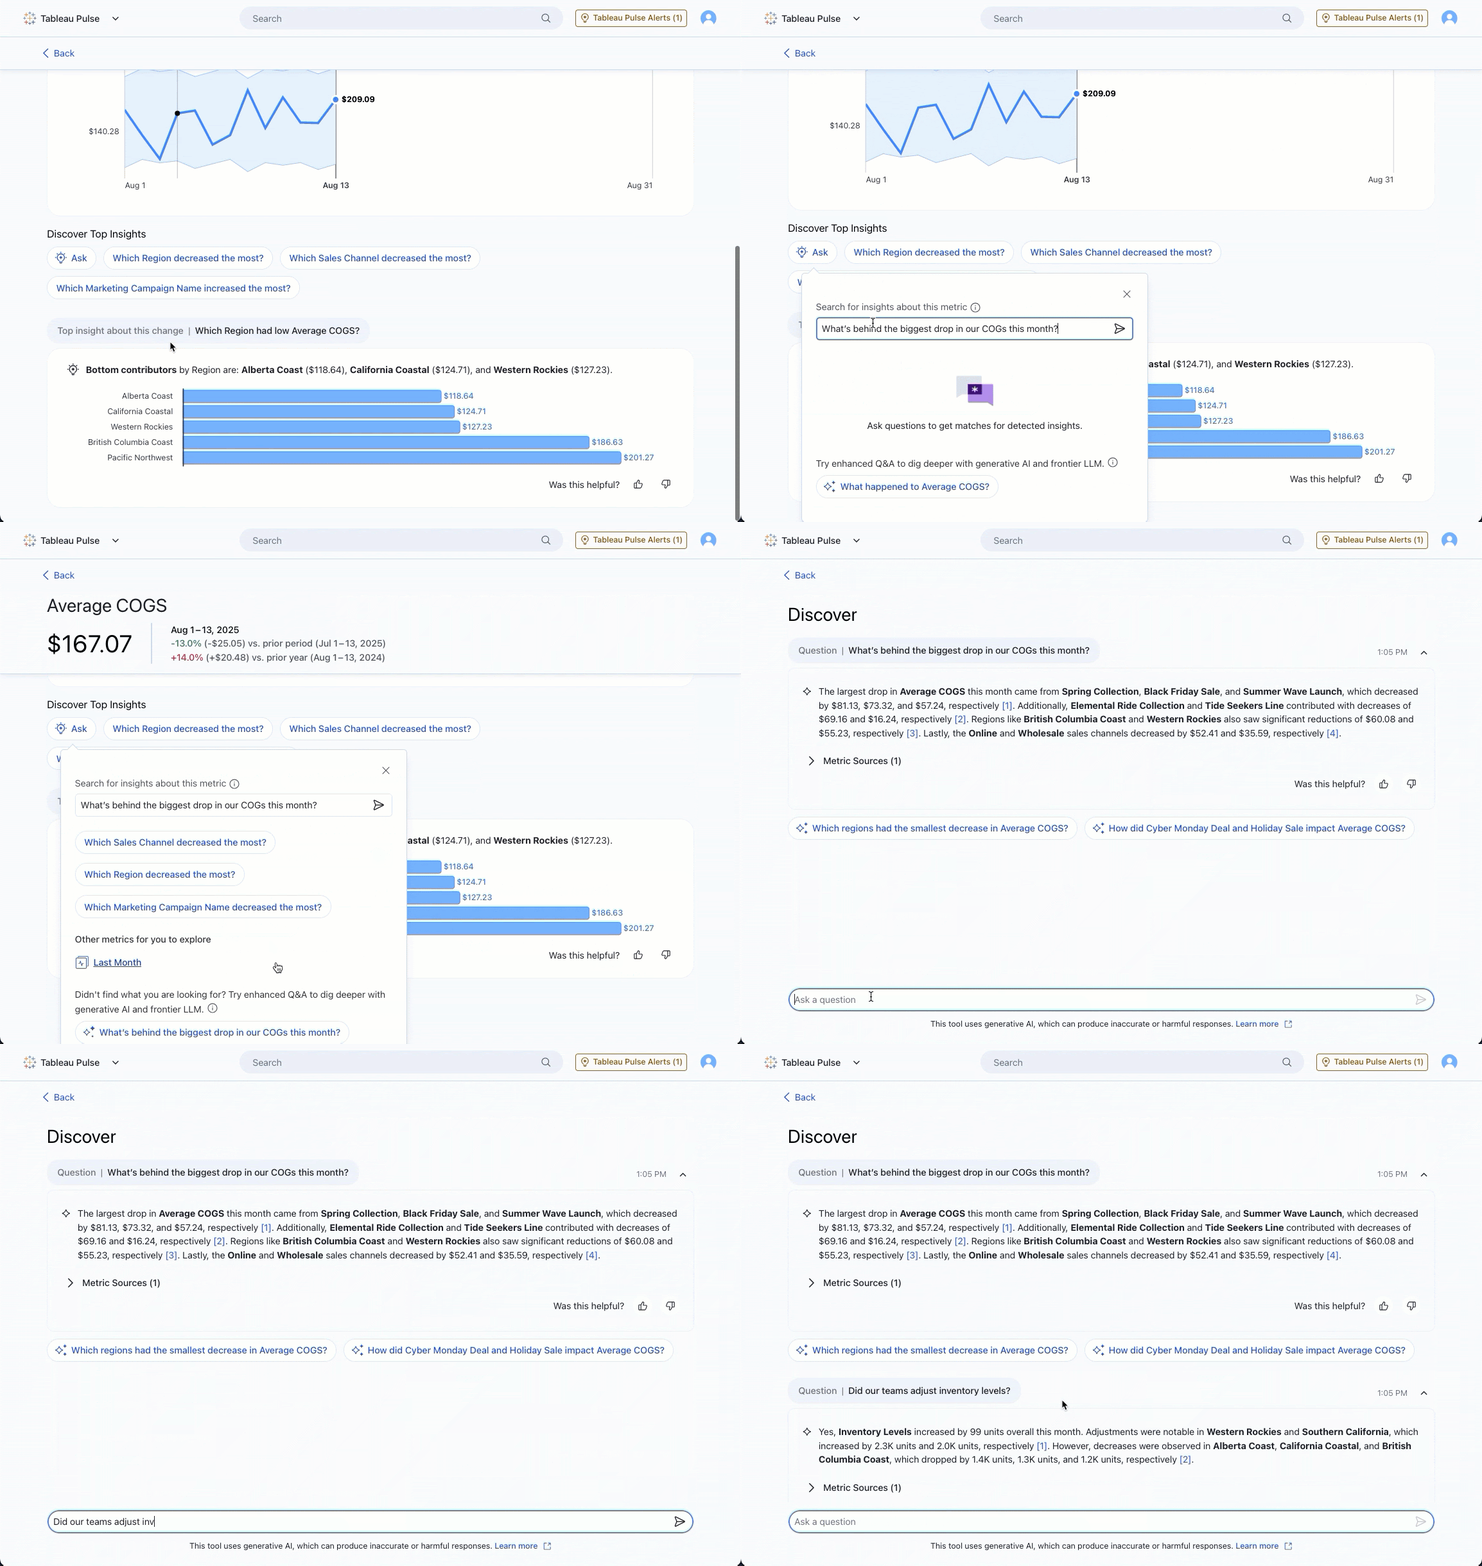
Tableau Pulse: New Enhanced Q&A Entry Points
Launch conversational AI from more parts of the Pulse experience and dig into metrics with Enhanced Q&A from the homepage and insight exploration page.
Note: Enhanced Q&A is available in Tableau+.
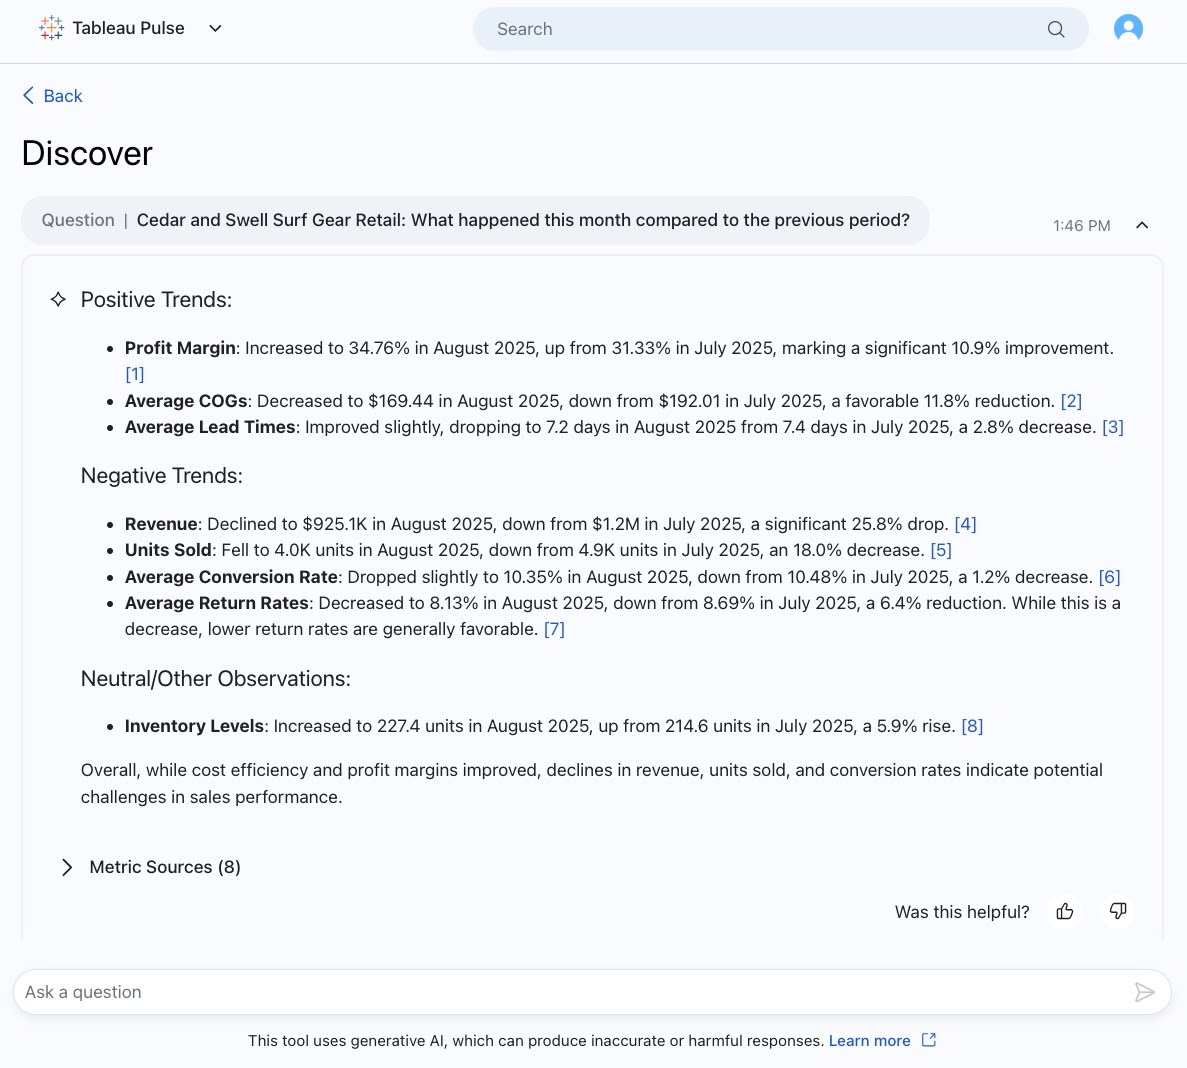
Tableau Pulse: Improved Output Text in Enhanaced Q&A
Get clearer insights in Enhanced Q&A with improved text formatting that makes outputs easily readable. Bolded text brings your attention to the most important info and bulleted, organized text makes info more digestible.
Note: Enhanced Q&A is available in Tableau+.
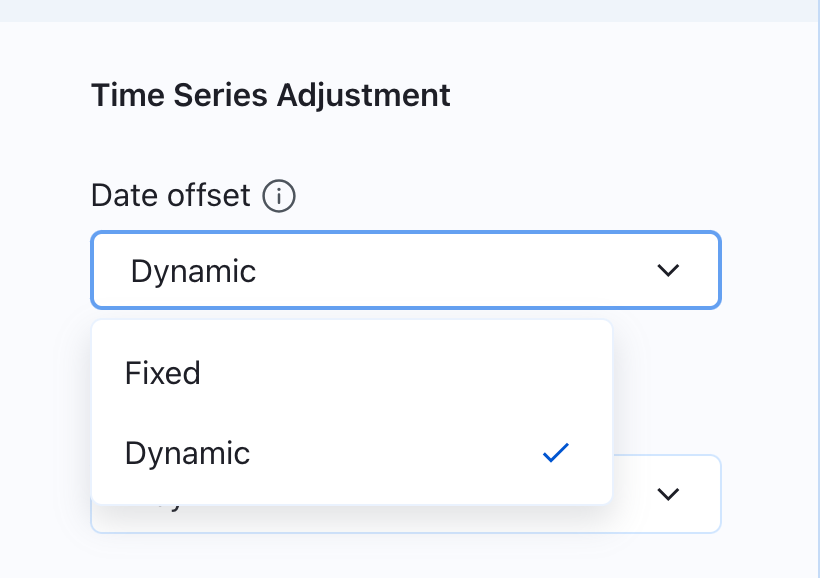
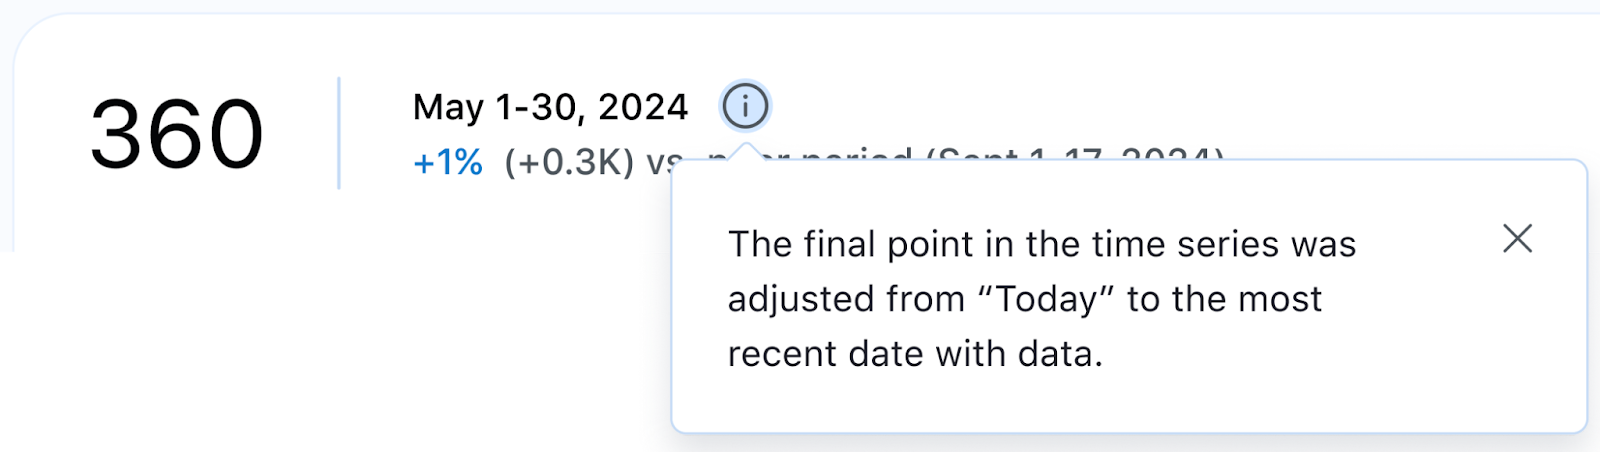
Tableau Pulse: Dynamic Date Offset
Get the most accurate view of your data over time. Set your time series to reflect the most recent data available to ensure a complete picture even when today's data hasn't been populated yet.

Ensure data residency and reliable availability and speed in Switzerland, India, and South Korea. Cloud Admins can now create sites in Switzerland and India. Availability in South Korea is planned by the end of September.
August
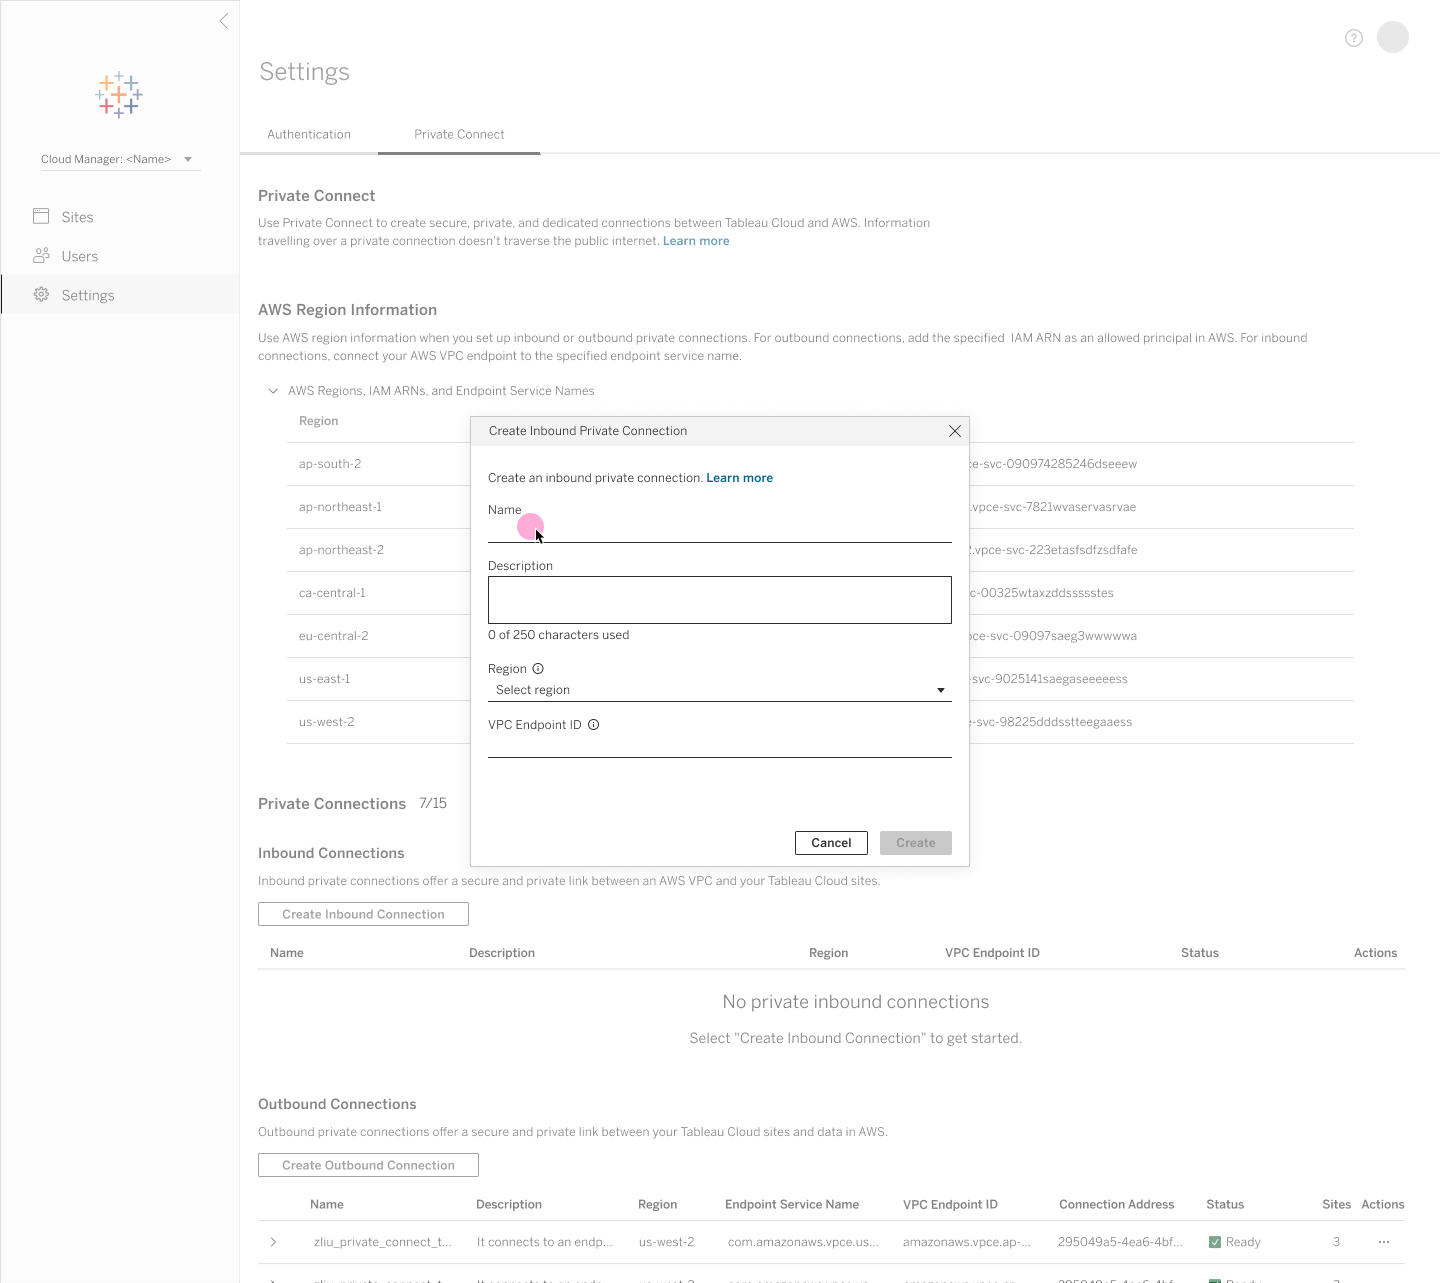
Inbound Private Connect
Establish dedicated, private connections from your corporate network to Tableau Cloud via AWS PrivateLink to protect sensitive analytics traffic. All web sessions, API calls, and publishing workflows route securely across private IP space without traversing the public internet.
Inbound Private Connect is generally available in Tableau Cloud.

External Key Management
Maintain direct control over your encryption key lifecycle by leveraging customer-managed KMS keys for extract encryption at rest. Centralized key management reinforces compliance, security posture, and data sovereignty across enterprise deployments.
External Key Management is generally available in Tableau Cloud.
2026.2

Hosted Tableau MCP
Tableau MCP now runs as a fully cloud-hosted service on Tableau Cloud, removing the need for customers to self-host and maintain their own MCP server. This means you can connect any MCP-compatible AI agent to your trusted Tableau analytics faster and with significantly less overhead. With built-in OAuth 2.1 support, governance, and reliability, you get secure, enterprise-ready AI integration right out of the box.
Hosted Tableau MCP for Tableau Cloud is coming soon, across all editions.
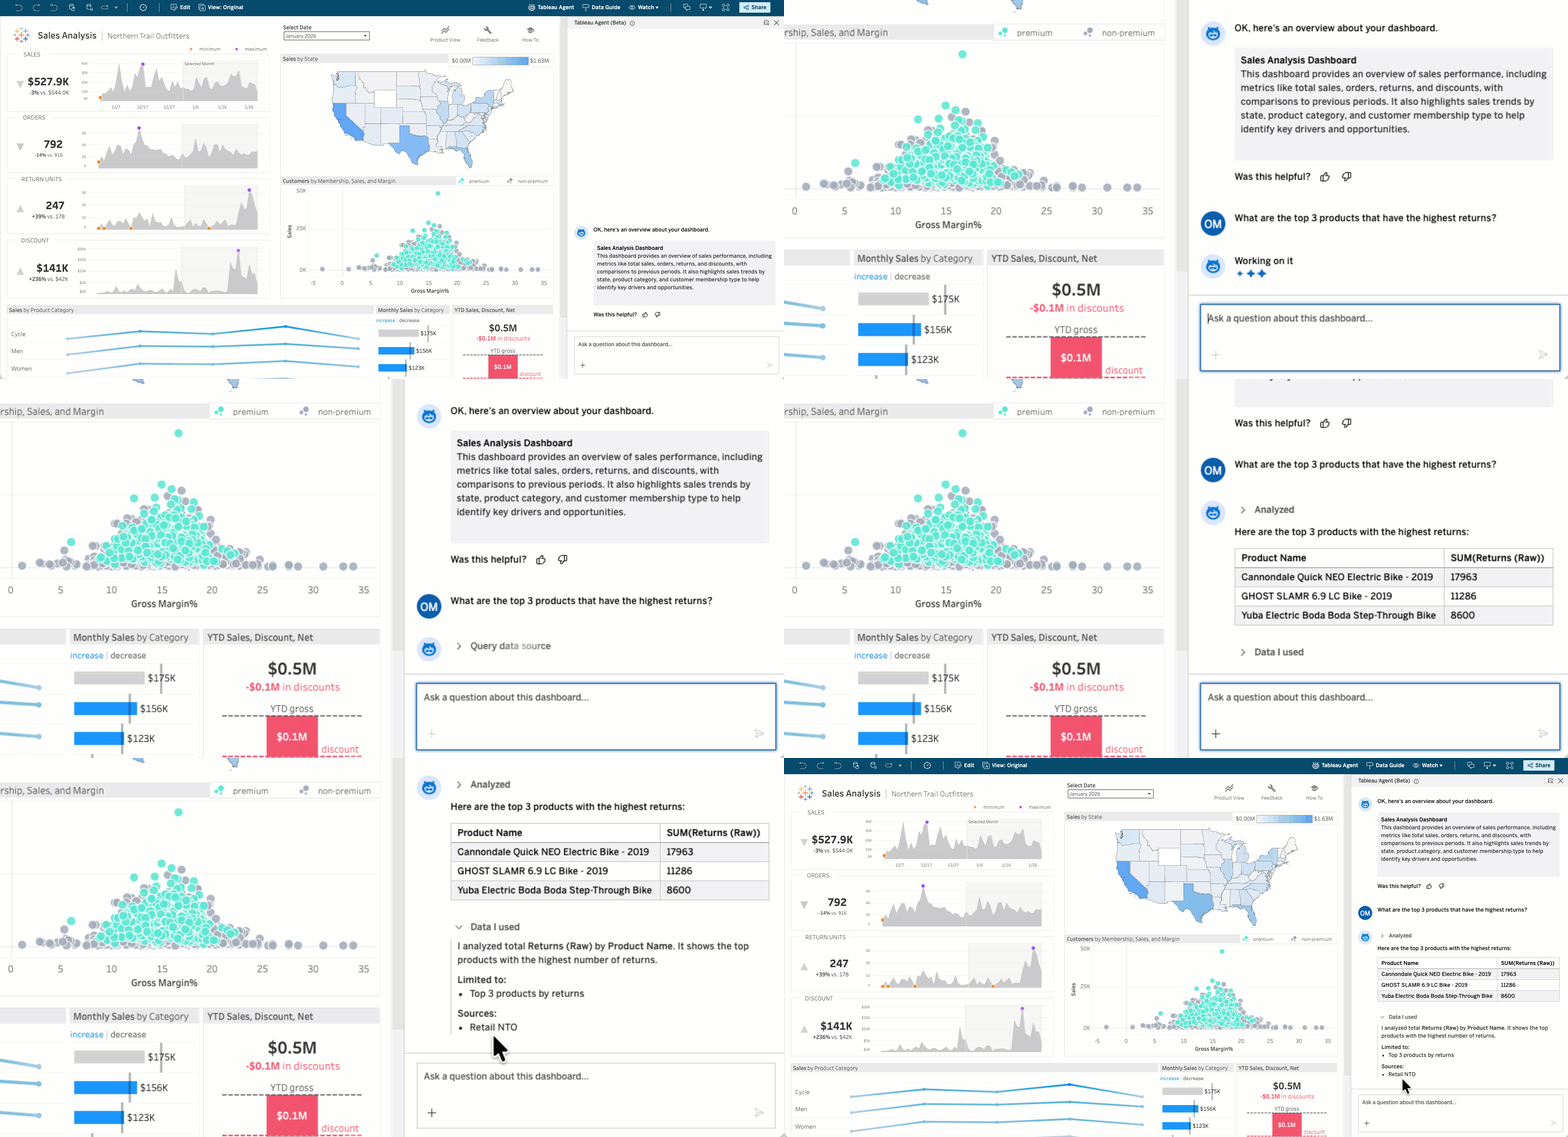
Tableau Agent in Dashboards: Conversational Analytics (Beta and Pilot)
Business users no longer have to wait to get answers to their data questions. With Tableau Agent in Dashboards, anyone can ask their data questions in plain language and get actionable information immediately. This self-service capability enables every user to get deeper insights from their dashboards by intuitively querying the underlying data source.
Tableau Agent in Dashboards: Conversational Analytics will be available in July as a Beta in Tableau Cloud and a Pilot in Tableau Server.
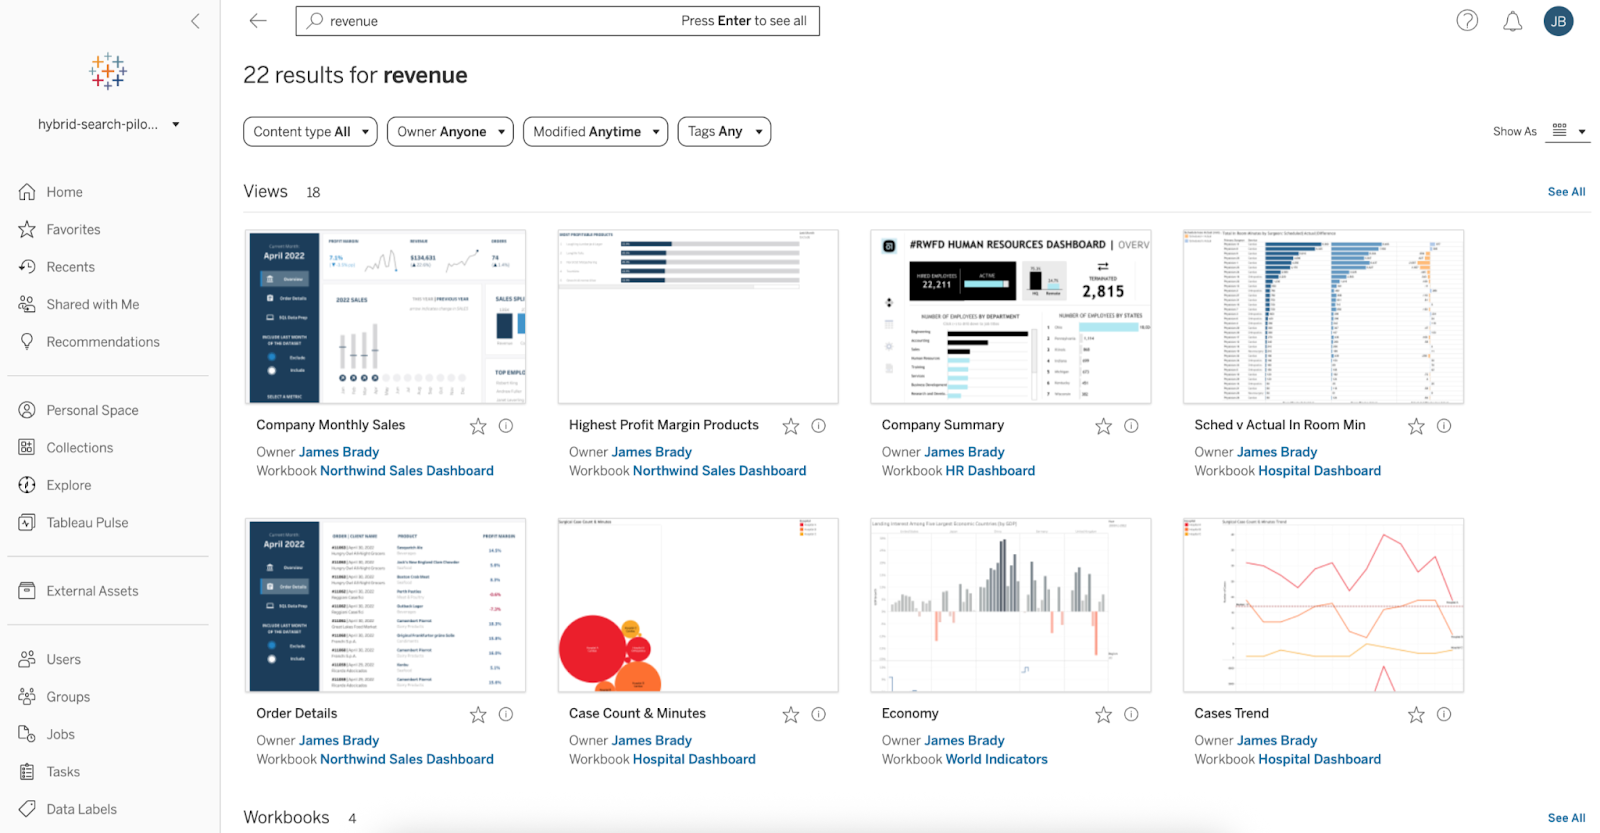
Semantic Search (Pilot)
Find the right Tableau content faster, using natural language. With Semantic Search, you can search for relevant dashboards, data sources, and workbooks using plain language and business concepts—exact keyword match not required. This intuitive search capability drives discovery of existing artifacts, eliminating duplication.
Semantic Search is available in Pilot in Tableau Cloud.
VizQL Data Service: Live Dashboard Query
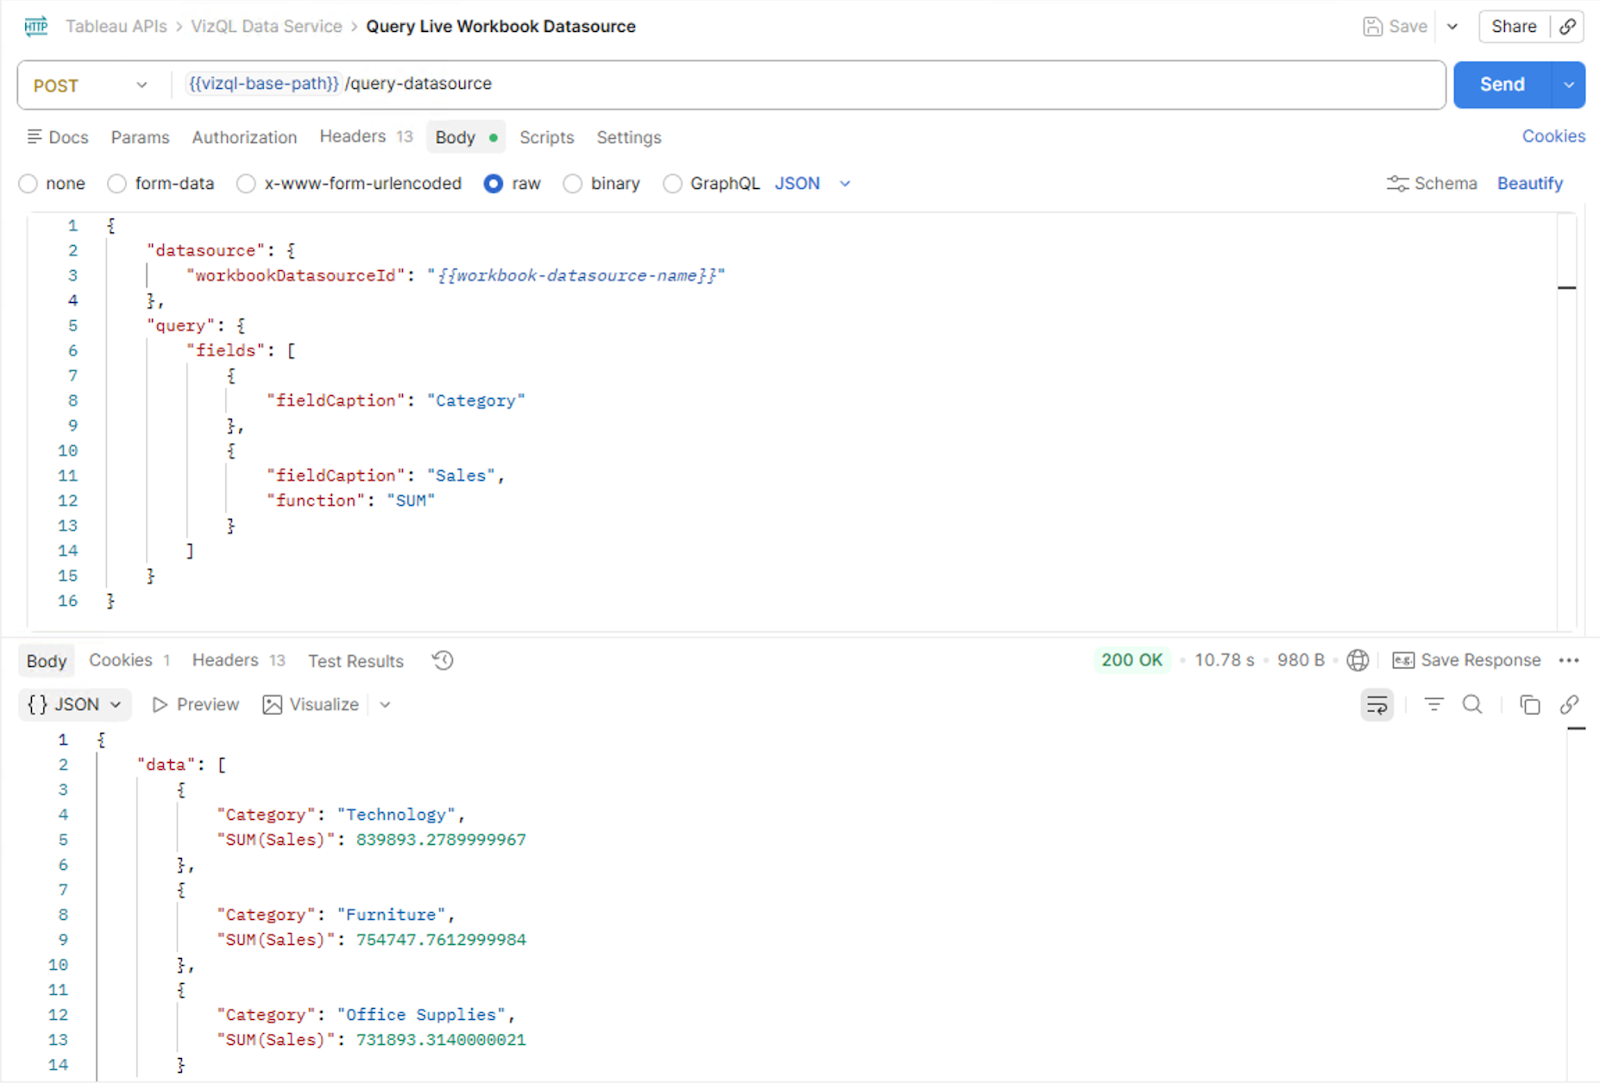
Building powerful embedded analytics experiences just got easier. With the new VizQL Data Service live dashboard query capability, you can query the data sources behind a Tableau workbook, including embedded ones, directly from your embedding applications. A new Embedding API method provides an identifier for the user's active dashboard session, which is then passed to VizQL Data Service to return data that matches exactly what the viewer sees in their dashboard. This makes it possible to build custom agentic experiences, AI-powered Q&A interfaces, and other deeply integrated applications that tap into live, session-aware Tableau data.
VizQL Data Service Live Dashboard Query is generally available in Tableau Cloud and Tableau Server.
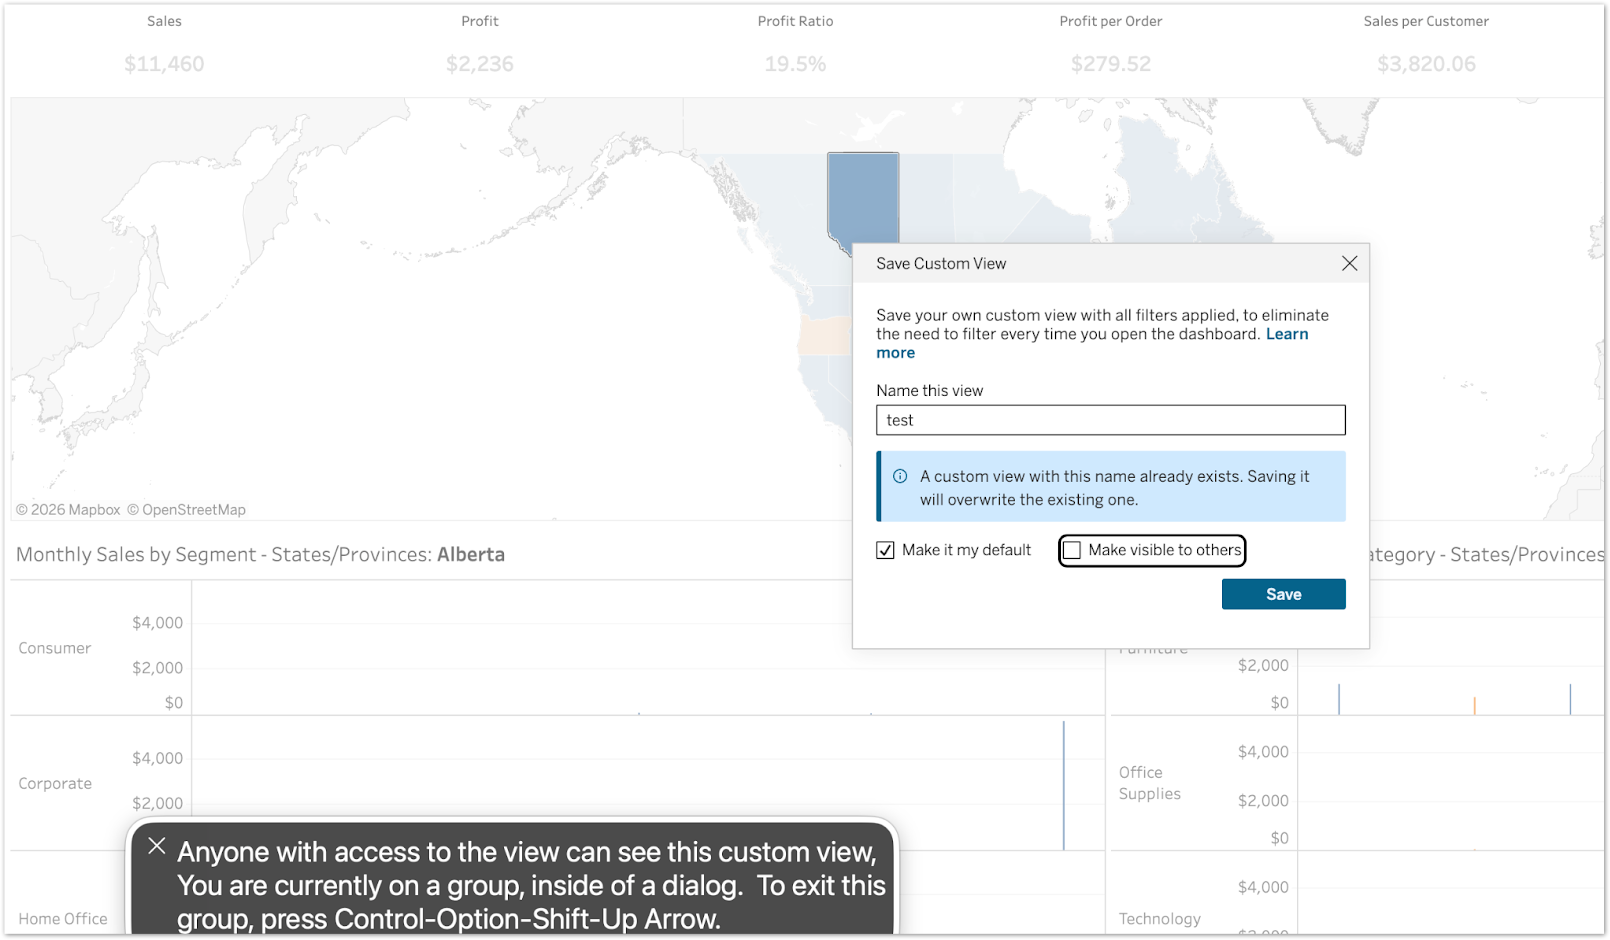
Enhancing Accessibility in Custom Views
Ensure an equitable experience for users with vision impairments by providing screen reader support for critical configuration options. Descriptive text for setting default or shared views is now announced during keyboard focus, preventing accidental exposure of personal data.
Enhancing Accessibility in Custom Views is generally available in Tableau Cloud and Server.
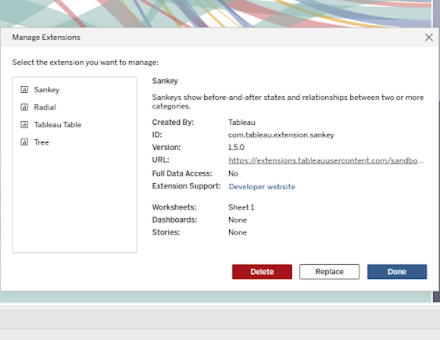
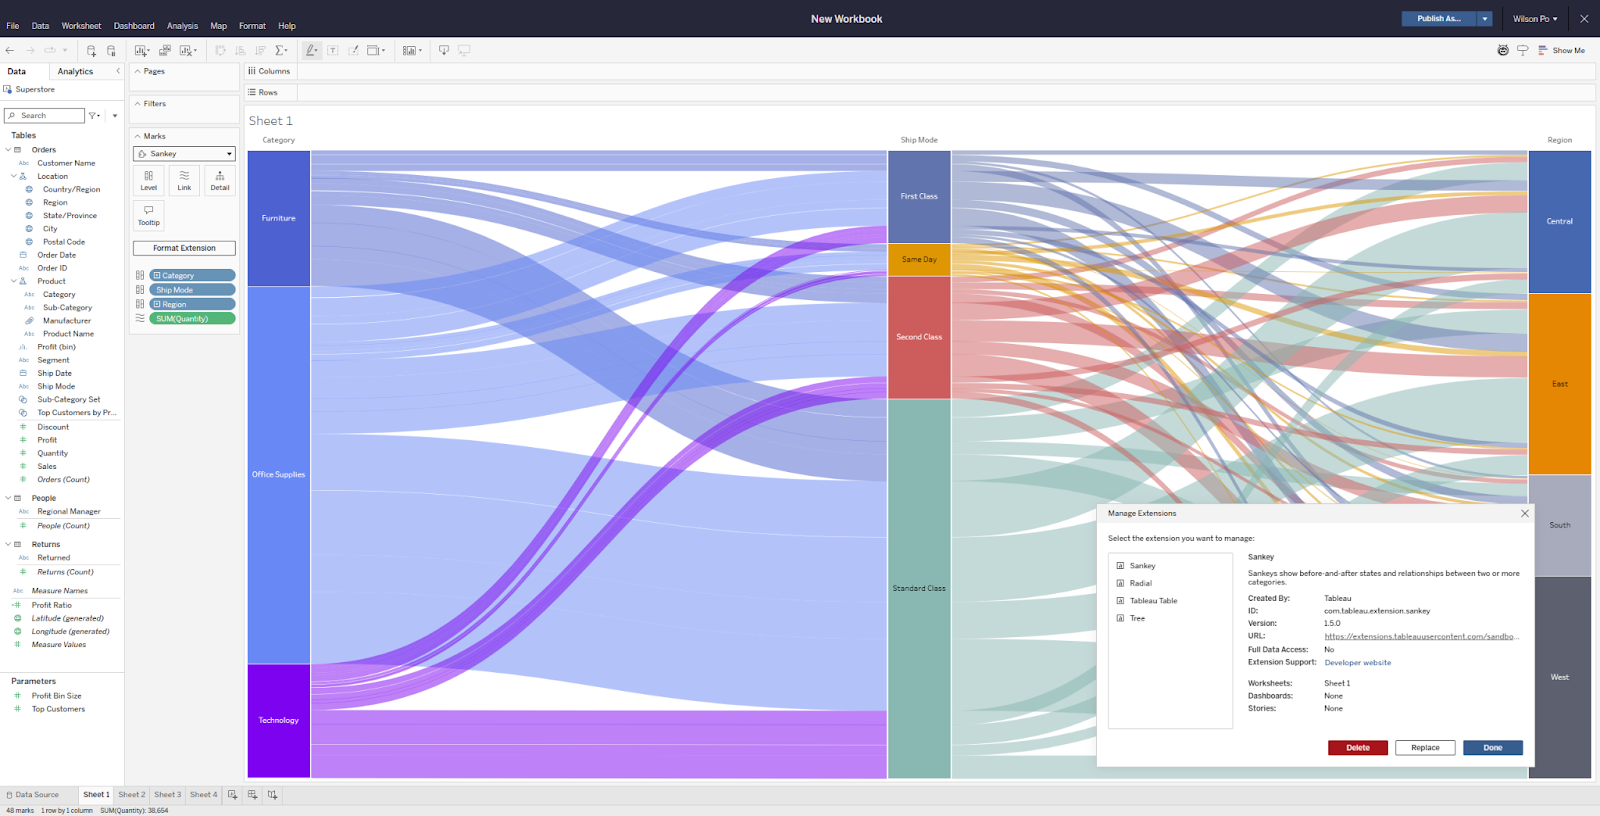
Manage Workbook Extensions
As workbook complexity grows, keeping track of which extensions are in use and where can become a real challenge. With Manage Workbook Extensions, you get a dedicated menu to inspect, delete, and swap out any dashboard or viz extension used in your workbook, all in one place. Whether you're working with extensions from the Tableau Exchange, privately developed ones, or licensed partner solutions, you can now replace them on the fly.
Manage Workbook Extensions is generally available in Tableau Desktop, Tableau Cloud, Tableau Server, and Tableau Public.
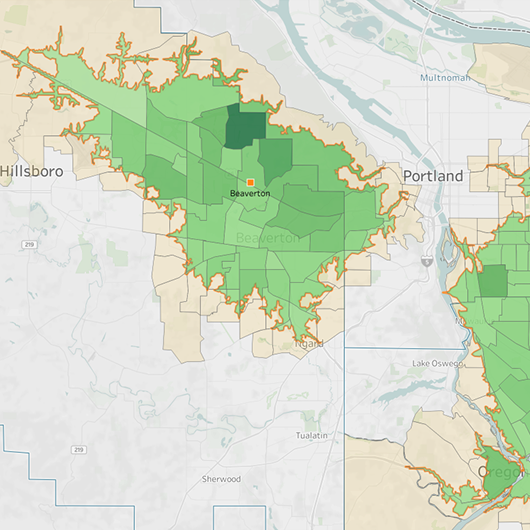
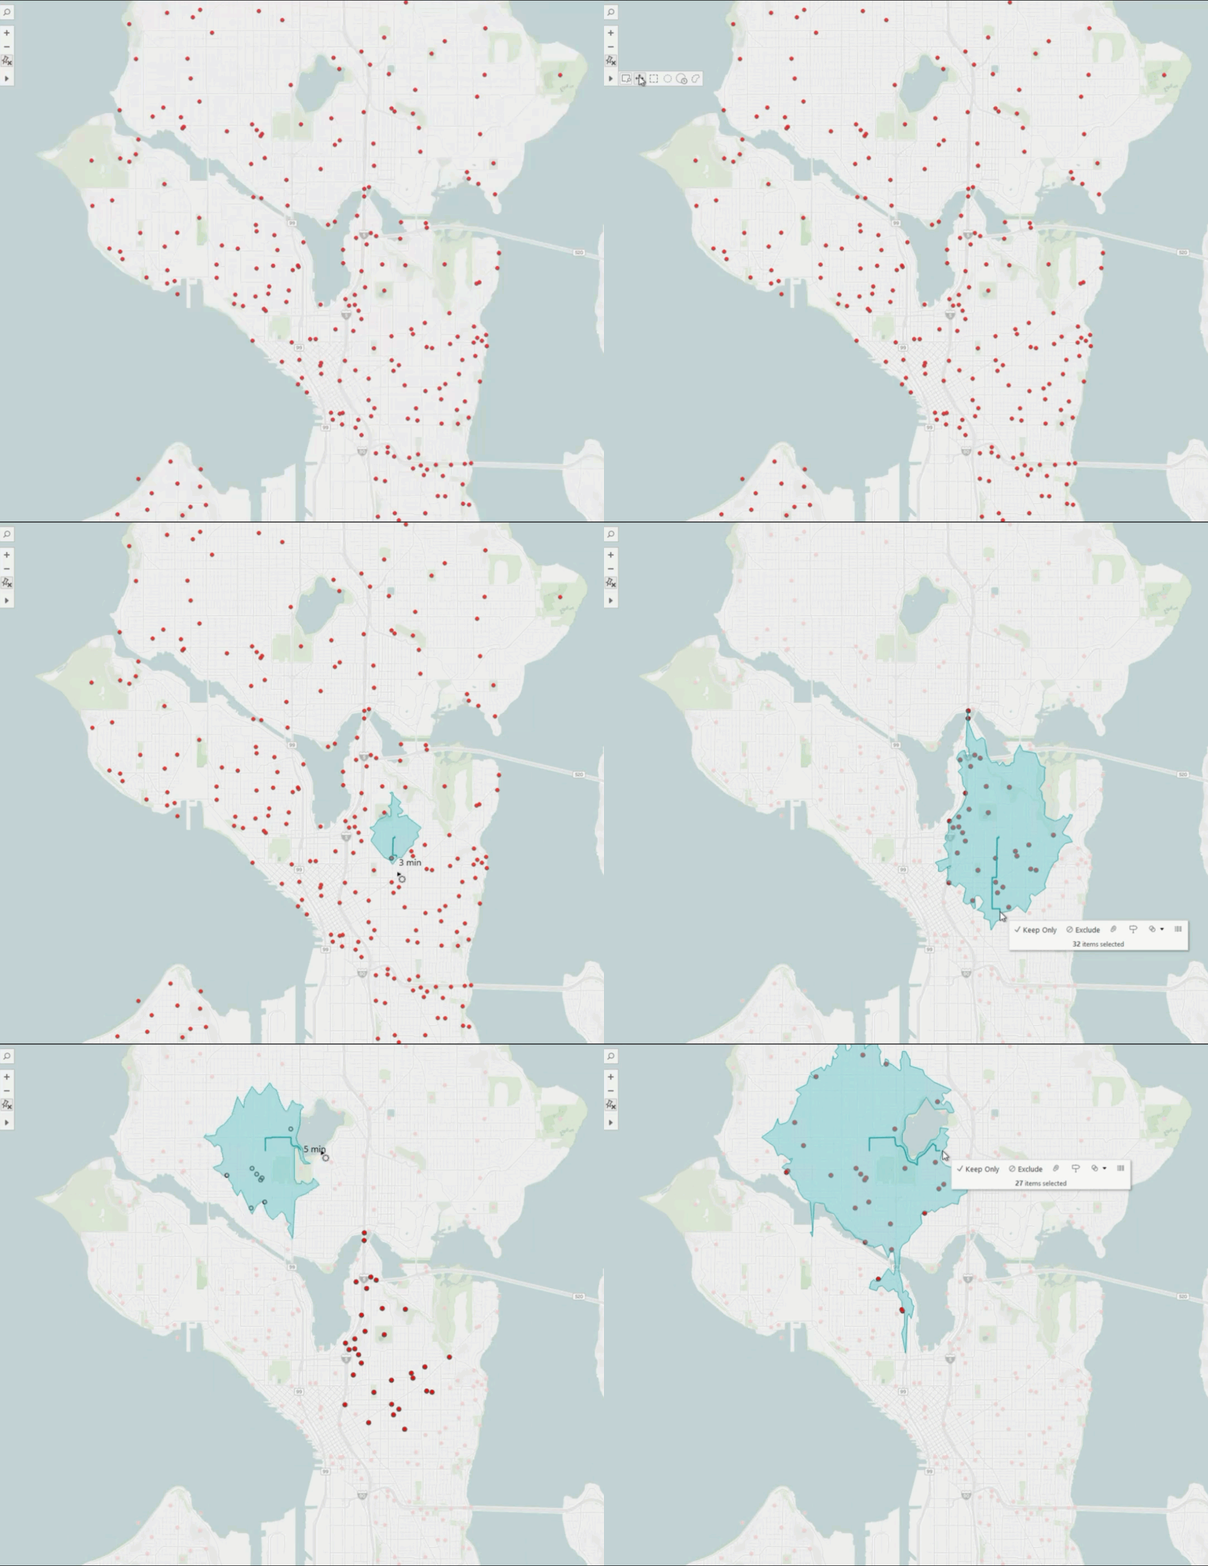
Tableau Maps: Drive Time Area
Traditional maps assume straight-line distances, which can lead to inaccurate assumptions about coverage, accessibility, and reach. With the Drive Time Area feature in Tableau Maps, you can draw an isochrone polygon directly on your map that reflects how far you can realistically travel within a given time, based on actual road networks and traffic conditions. Simply select the Drive Time tool from the map toolbar, click a point, and drag outward to generate your coverage area. Whether you're optimizing store locations, planning delivery zones, managing emergency response, or refining service coverage, Drive Time Area helps you make decisions grounded in real-world conditions.
Maps: Drive Time Area is generally available for Tableau Desktop, Tableau Cloud, Tableau Server, and Tableau Public.
SVG Image Download
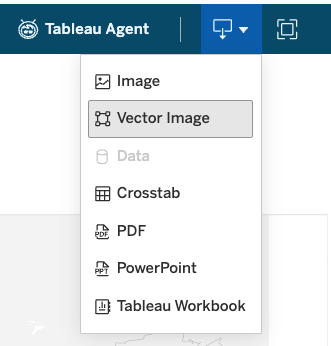
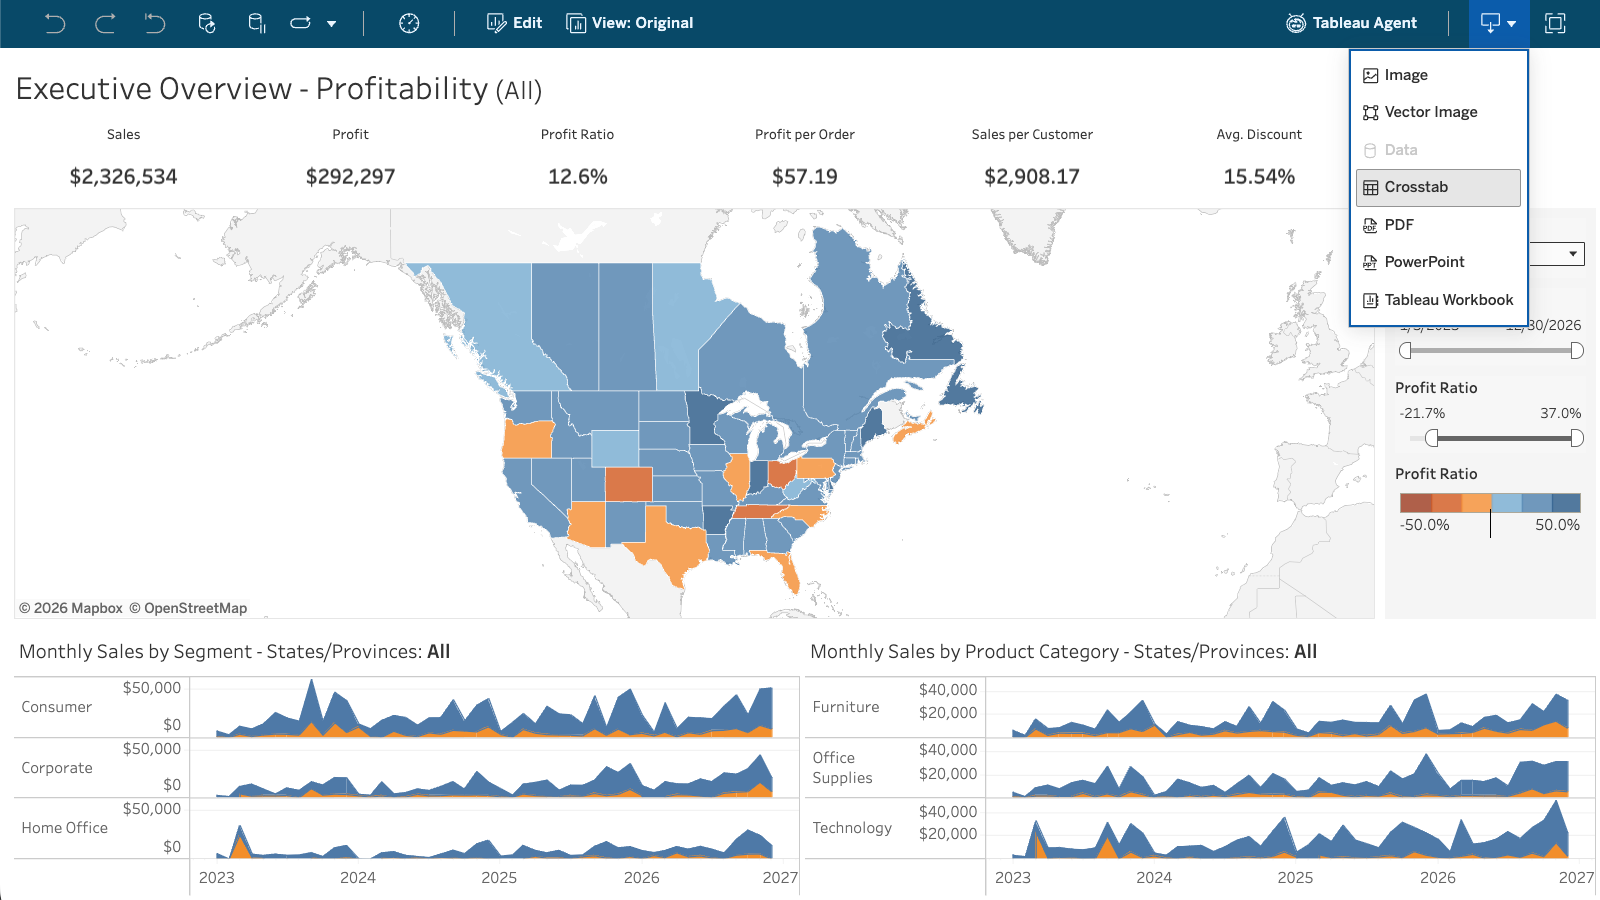
When you share Tableau dashboards and visualizations outside of Tableau, image quality matters. With SVG image download, you can now export your dashboards and vizzes as scalable vector graphics, so your visuals stay sharp and clear at any size, without the blurriness that can come with PNG exports. SVG files are available through the REST API, via the Vector Image option in web viewing, or through the Dashboard Download button. Whether you're embedding visuals in presentations, reports, or other content, your Tableau analytics now look exactly as intended.
SVG image download is generally available for Tableau Desktop, Tableau Cloud, Server and Tableau Public.

Tableau Bridge: Notifications in Tableau Cloud
Stay on top of data freshness with notifications for Tableau Bridge job failures delivered directly within Tableau Cloud. These automated alerts empower site admins and data owners to resolve connectivity issues faster, ensuring data pipelines stay current.
Tableau Bridge: Notifications is generally available in Tableau Cloud.

Tableau Bridge: Data Source Edits in Web Authoring
Creators working with on-prem data no longer have to switch to Tableau Desktop to build or update a Tableau Bridge data source. With this update, creators can create and edit published Bridge data sources, that use named connectors, directly on Tableau Cloud, keeping the entire workflow in one place.
Tableau Bridge: Data Source Edits in Web Authoring is generally available in Tableau Cloud.
Composable Tableau Views and Tableau Pulse Metrics (LWC)
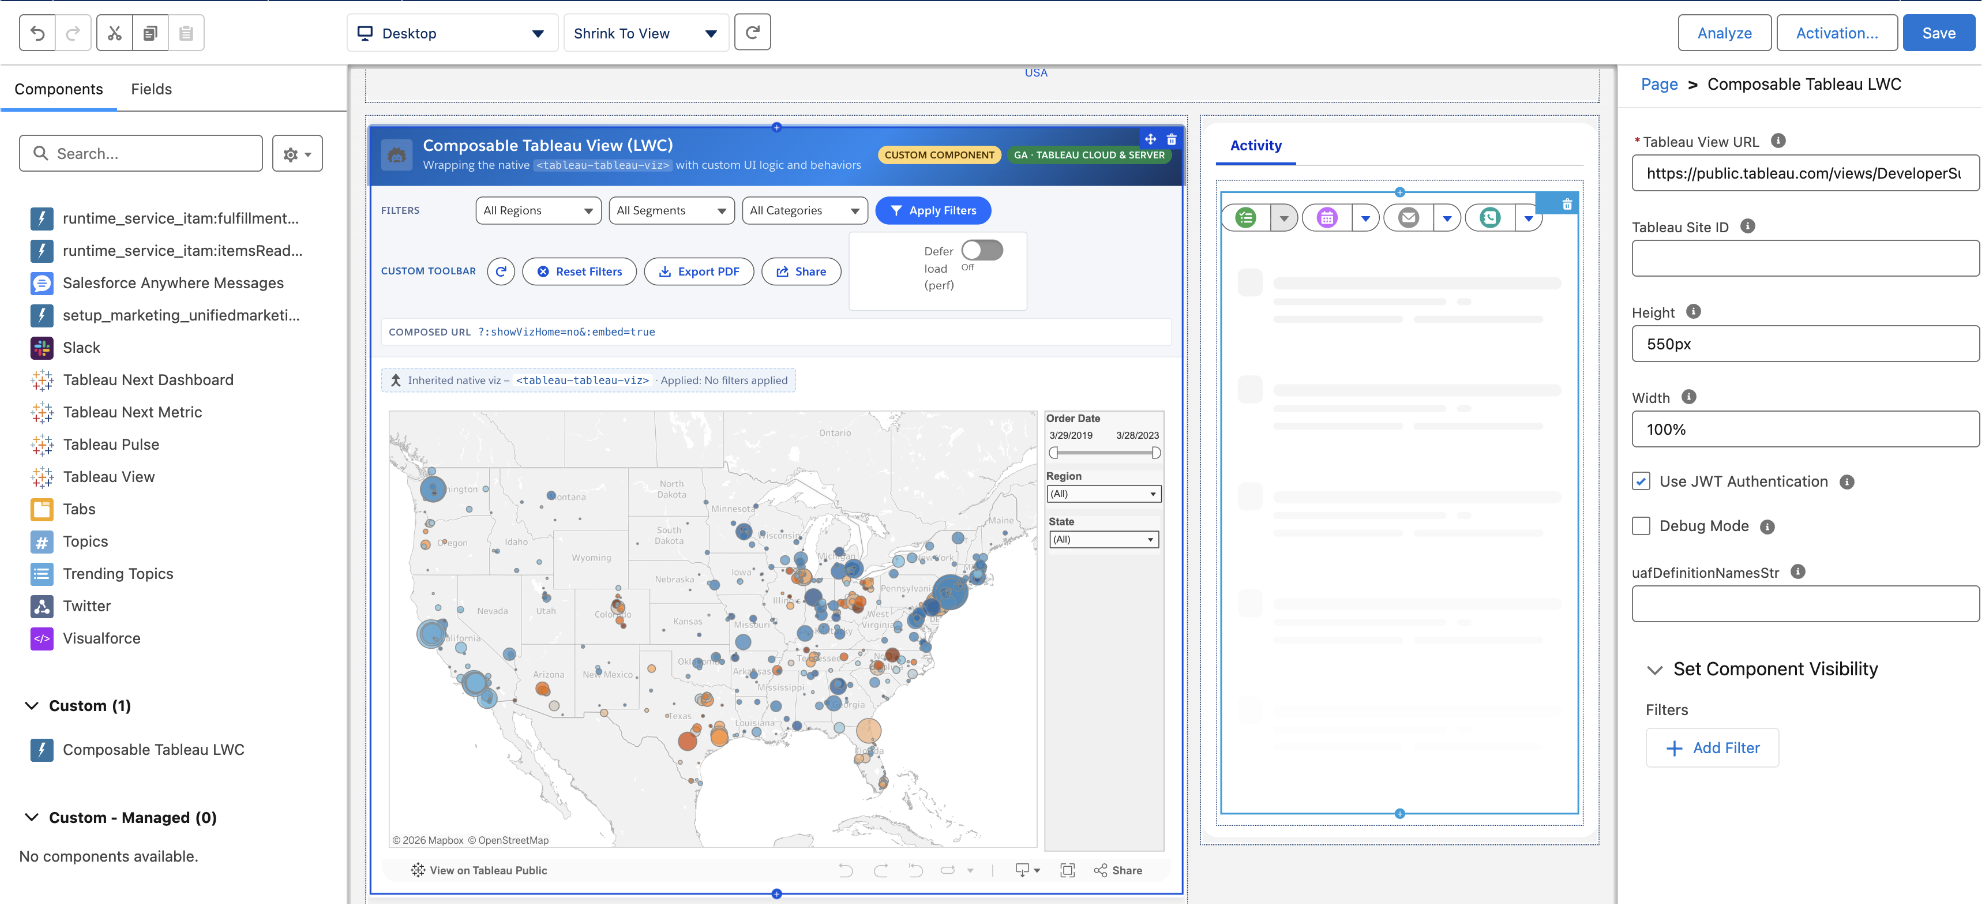
Customize how Tableau dashboards and Pulse metrics are embedded in Salesforce by wrapping the native component with your own UI logic and behaviors. With Composable Tableau Views and Tableau Pulse Metrics - Lightning Web Component (LWC), developers can programmatically set filters, add custom toolbars, and fine-tune performance while inheriting the seamless integration.
Composable Tableau Views and Tableau Pulse Metrics (LWC) is generally available in Tableau Cloud and Server.
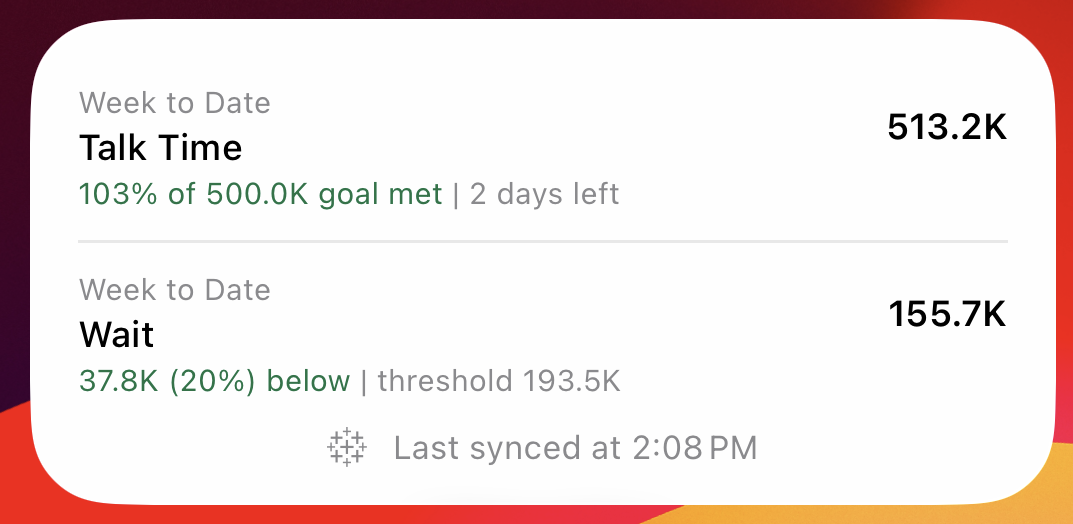
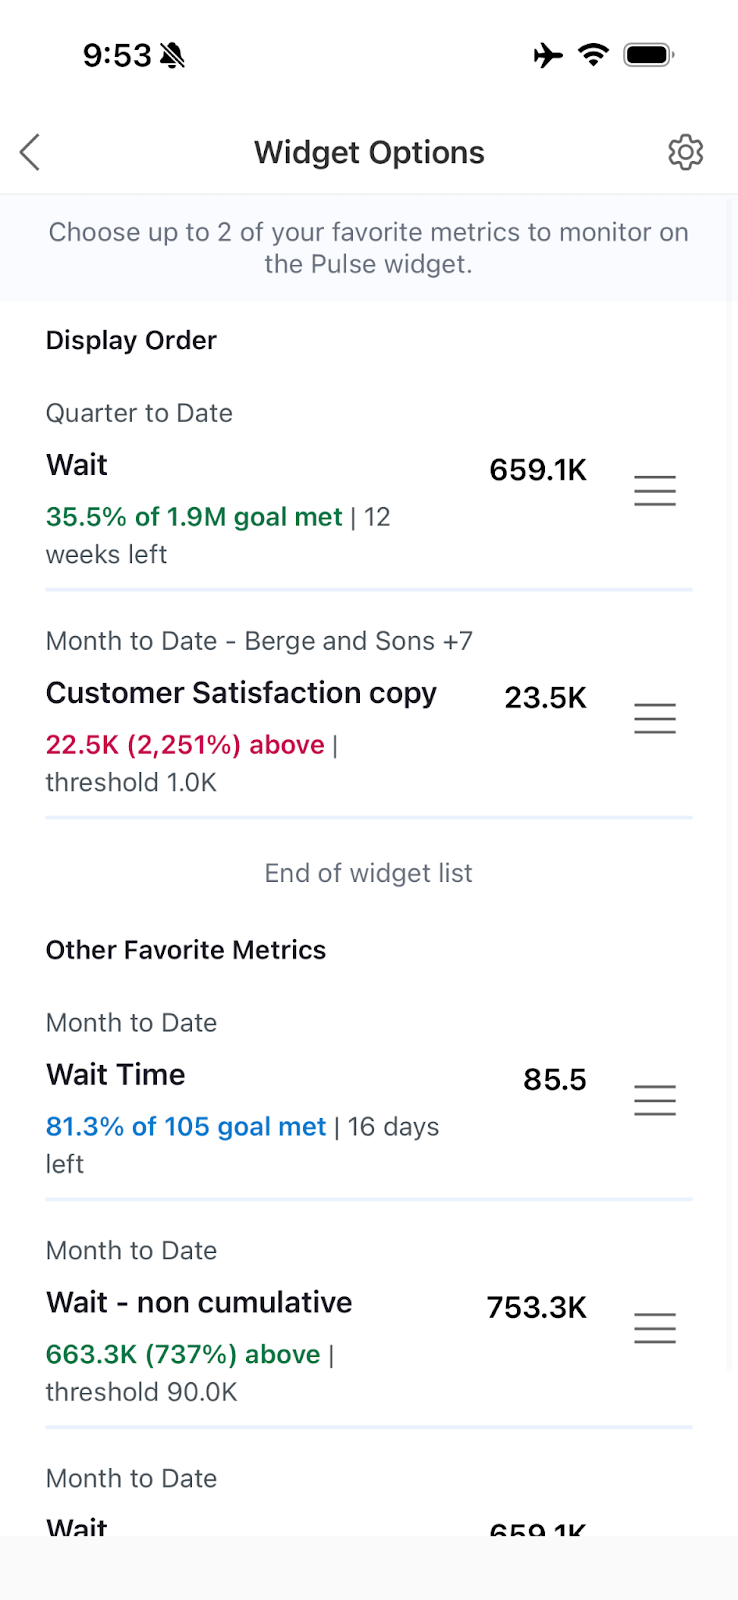
Tableau Pulse: Mobile Widget for Metrics
Keep your most critical data and insights always visible, directly from your mobile home screen. With the mobile widget for Tableau Pulse metrics, you can customize which high-priority metrics appear front and center, helping you stay informed and act quickly without having to open the Tableau app first.
Tableau Pulse: Mobile Widget for Metrics is generally available in Tableau Cloud.
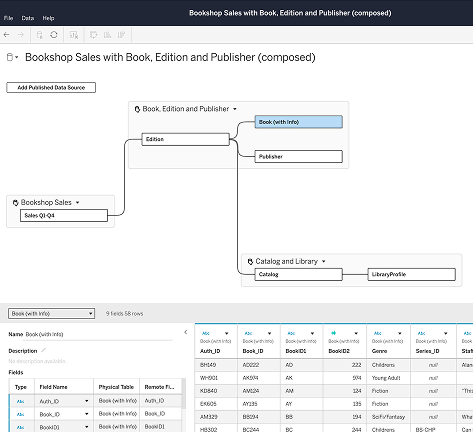
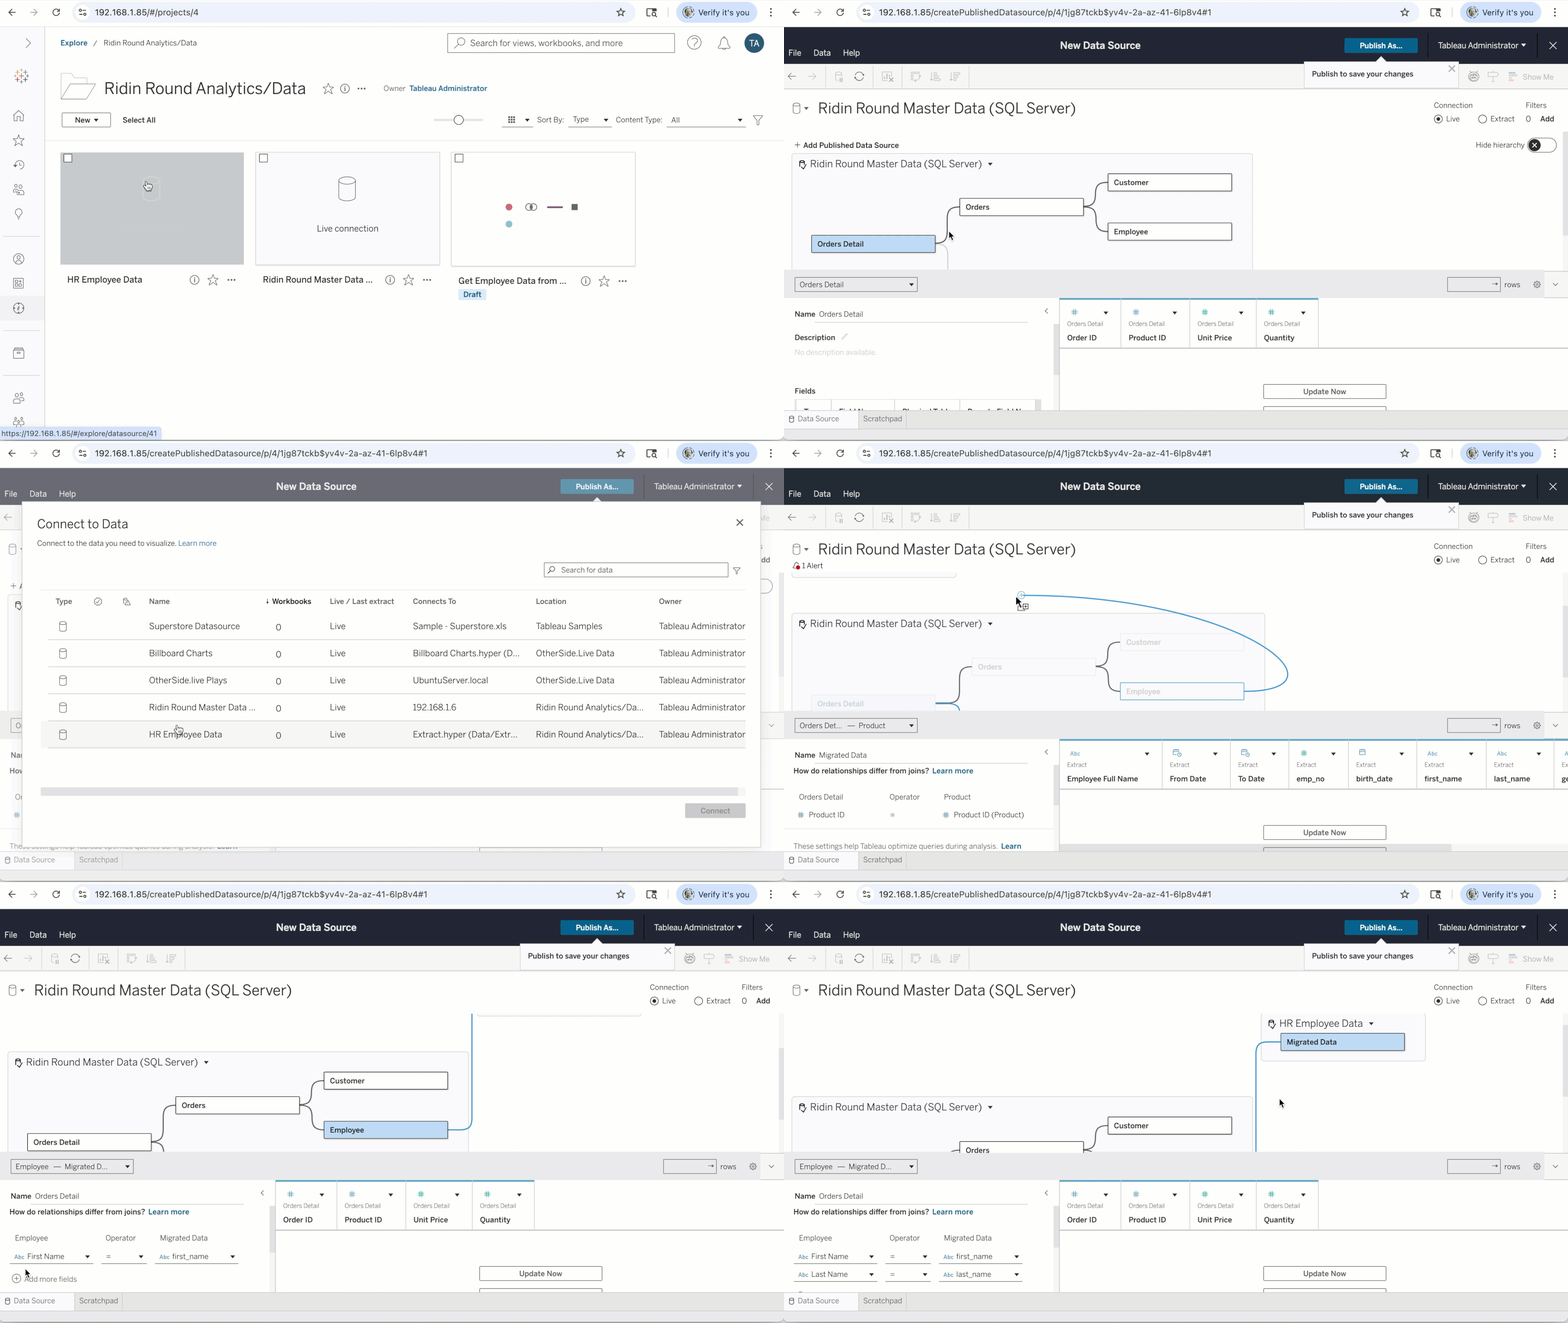
Composable Data Sources
Rebuilding data sources from scratch for every new use case slows teams down and creates inconsistency across your org. With Composable Data Sources, you can combine your existing Tableau Published Data Sources into a single, unified model, extend it with the business logic and context your use case needs, and publish it for reuse across workbooks, Tableau Pulse metrics, and APIs. When an upstream published data source changes, your composed data source picks it up automatically on refresh.
Composable Data Sources is rolling out across June and July for Tableau Cloud, Tableau Server, and Tableau Desktop.
Learn More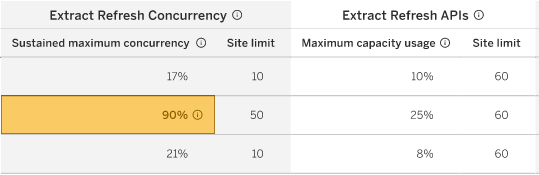
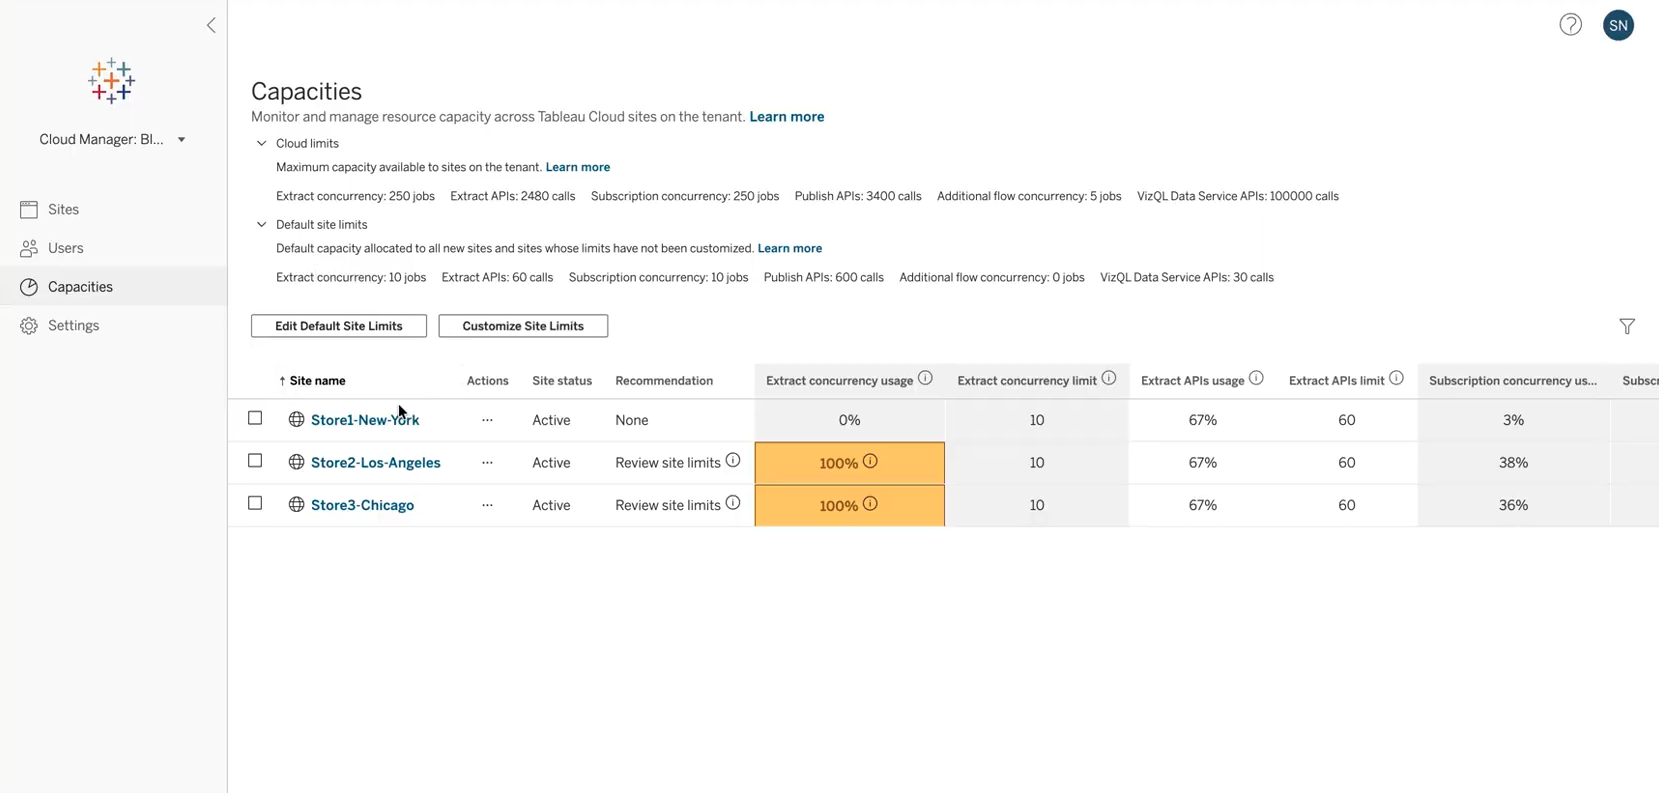
Cloud Capacity Management
Provide flexible capacity governance for Tableau Cloud administrators, allowing them to view and transparently manage capacity limits like extract refresh concurrency and publishing API, as well as view consumption metrics on their usage of these limits. Administrators can shift capacity limits between sites to ensure their production environments receive higher limits, promoting flexible product usage.
Cloud Capacity Management is generally available in Tableau Cloud
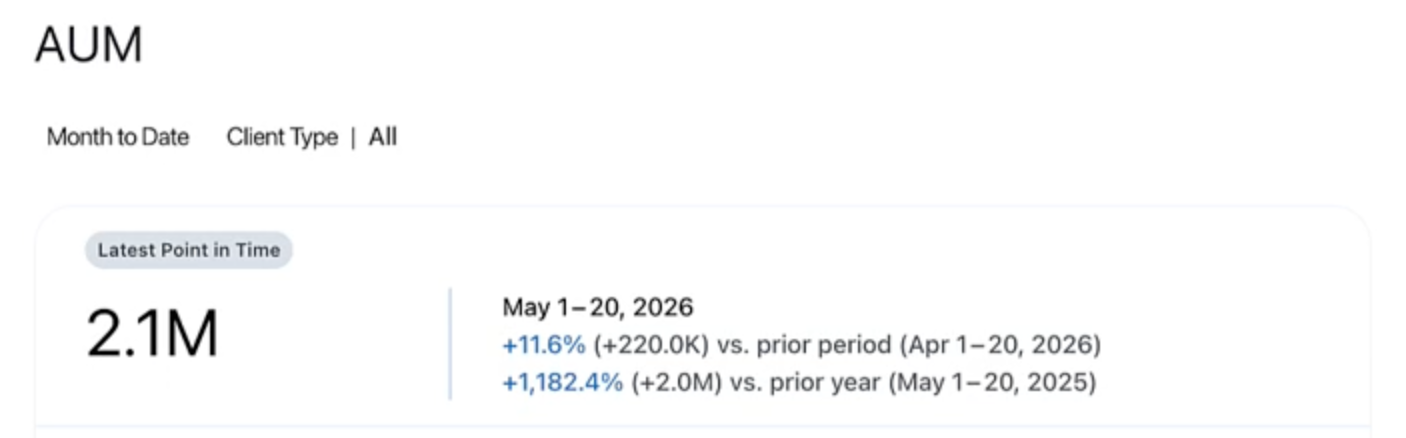
Tableau Pulse: Point-in-Time Metrics
Ensure snapshot metrics, like inventory levels or headcount, reflect their values as of the last day of the period. Instead of writing a calculation in the advanced editor, Analysts can now define a Pulse metric as ""point-in-time," rather than as an aggregate over the period. With Tableau Pulse: Point-in-Time Metrics, teams can reliably track performance with reporting that aligns with their business operations.
Tableau Pulse: Point-in-Time Metrics is generally available in Tableau Cloud.
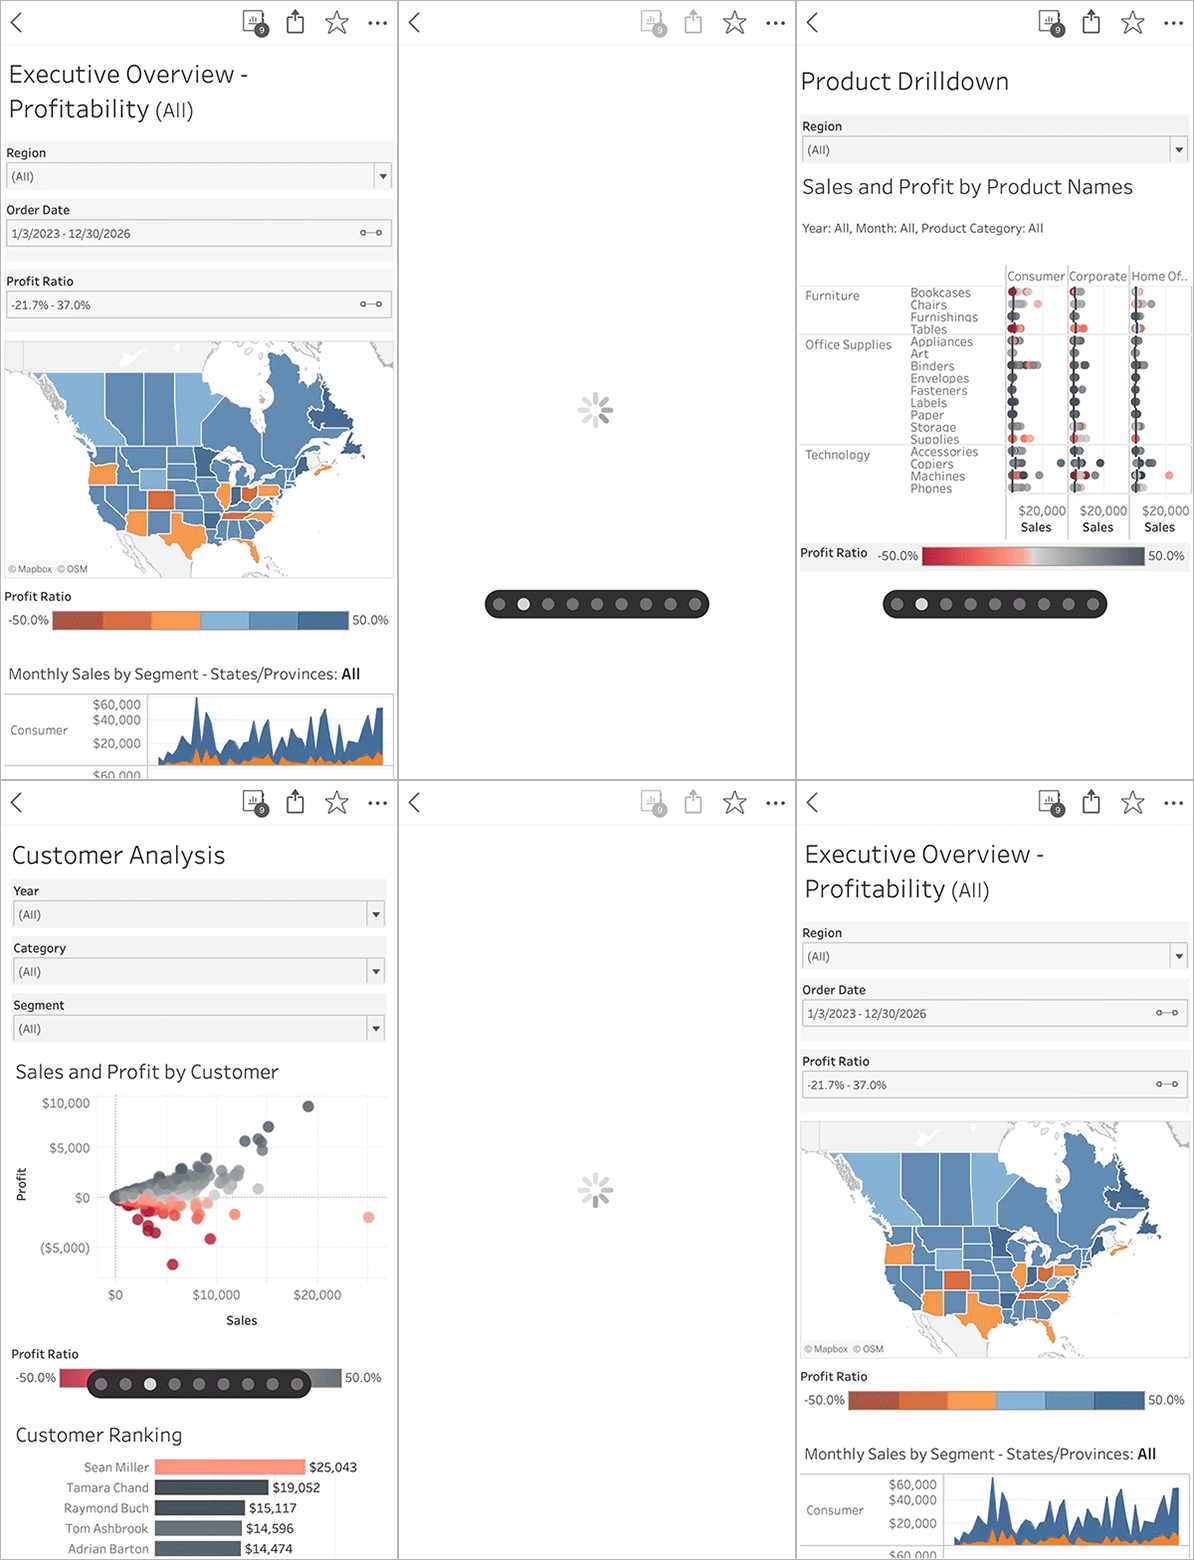
Tableau Mobile: Swipe Between Sheets
Navigate multi-sheet workbooks seamlessly within the Tableau mobile app. In addition to using the dropdown menu to open a specific sheet, users can three-finger swipe left or right to move between adjacent sheets. With the ability to effortlessly move between sheets on mobile, teams can easily review the data needed to make confident decisions wherever business takes them.
Tableau Mobile: Swipe Between Sheets is generally available in Tableau Cloud and Server.