
Tableau 2025.3
Q&A Calibration, Tableau Agent in Tableau Server, Dashboard Narratives and more
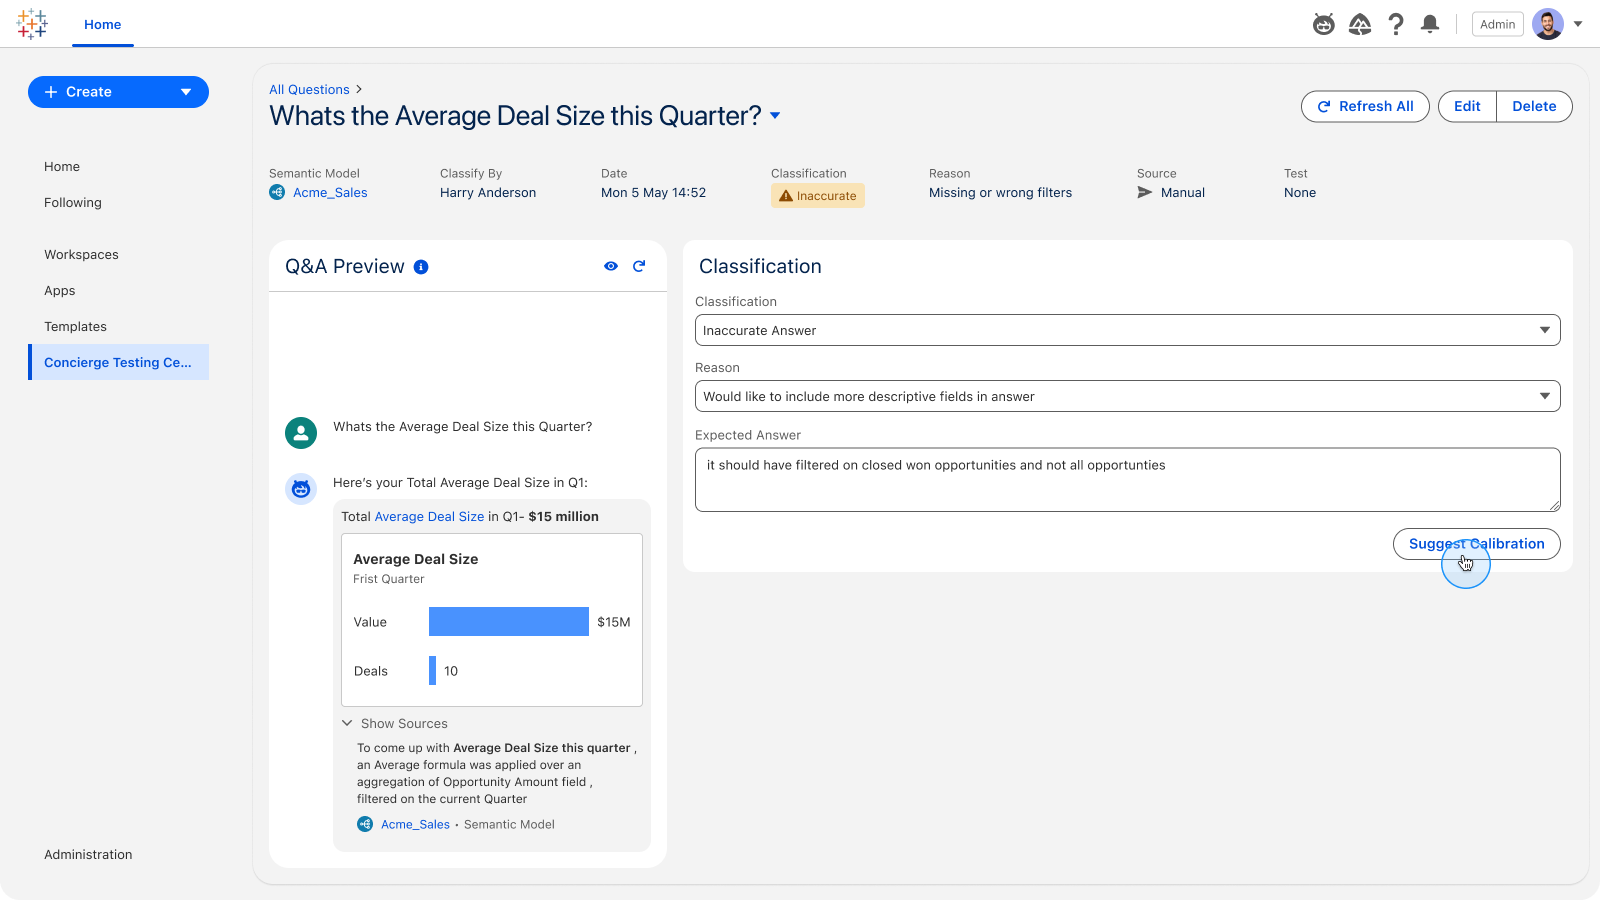
Tableau Next: Q&A Calibration
Improve your agent's accuracy on analytics questions with Q&A Calibration. Test responses, classify their accuracy, and apply guided suggestions answers for more accurate agent responses. Available in Beta.
Tableau Agent in Tableau Server
Collaborate with Tableau Agent, your AI-powered assistant, to get to insights faster on Tableau Server. Use natural language to get support through every stage of analytics—from data preparation to exploration and visualization. Tableau Agent in Server supports Tableau Prep and Web Authoring capabilities. To access it, just link up your own OpenAI model (2025.3 only supports OpenAI) using your API keys before launching Tableau Agent in Web Authoring or Desktop. Generally available in Tableau Server.
Tableau Agent: Dashboard Narratives
Ease data discovery with intuitive, AI-powered explanations. Tableau Agent delivers dashboard narratives that provide a concise overview to help you gauge its relevance to your questions. As you dig deeper into the dashboard, Tableau Agent generates contextual insights for each viz, highlighting meaningful trends. Beta coming soon to Tableau Cloud and Desktop.
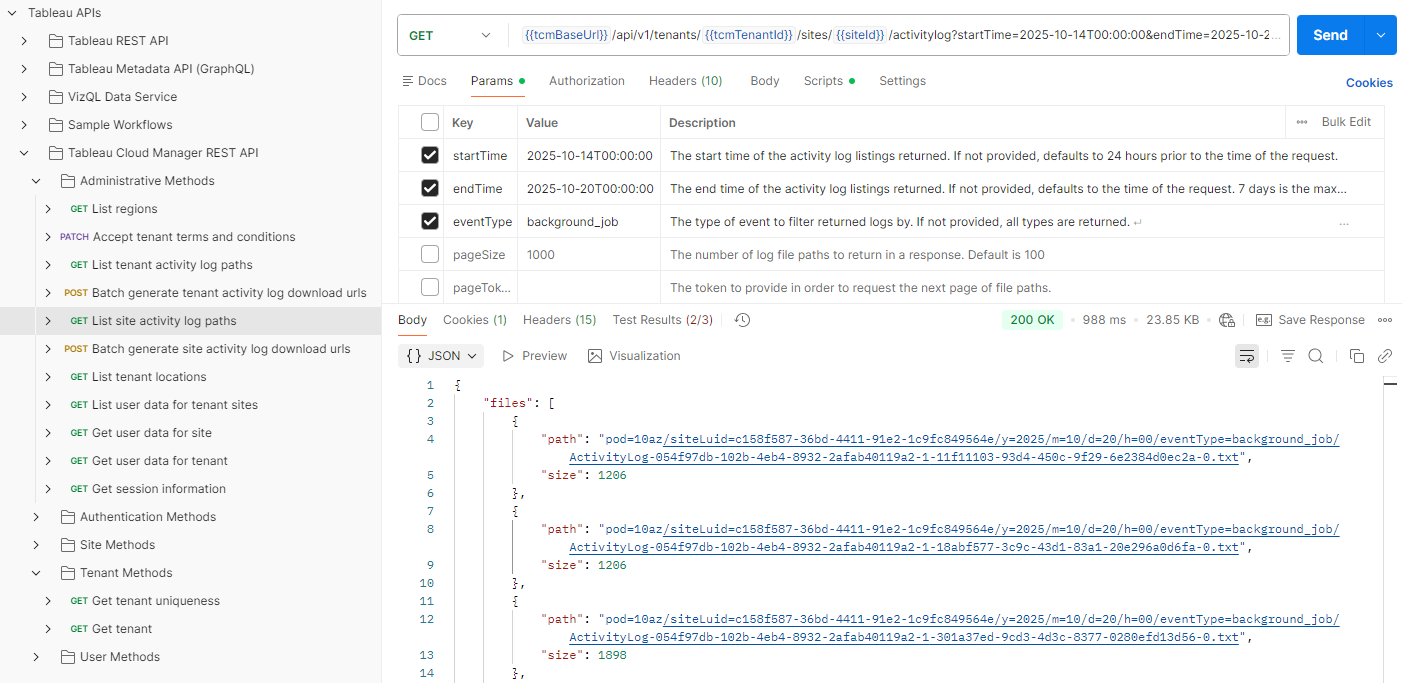
Platform Data API
Gain programmatic access to your Tableau Cloud activity and events data without requiring an AWS S3 integration. Use the new API to retrieve unified event logs for custom monitoring, SIEM ingestion, or analytics in your own data warehouse. Generally available in Tableau Cloud.
Note: Near real-time logs and S3 integration only available with Tableau Enterprise or Tableau+ bundle.

Get the Inside Track on Tableau Releases
Learn from Tableau Product Managers about the new features we're releasing on our DataFam Discovery User Group.
Join Now
All Features
2025.3
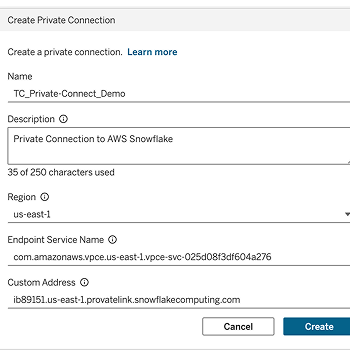
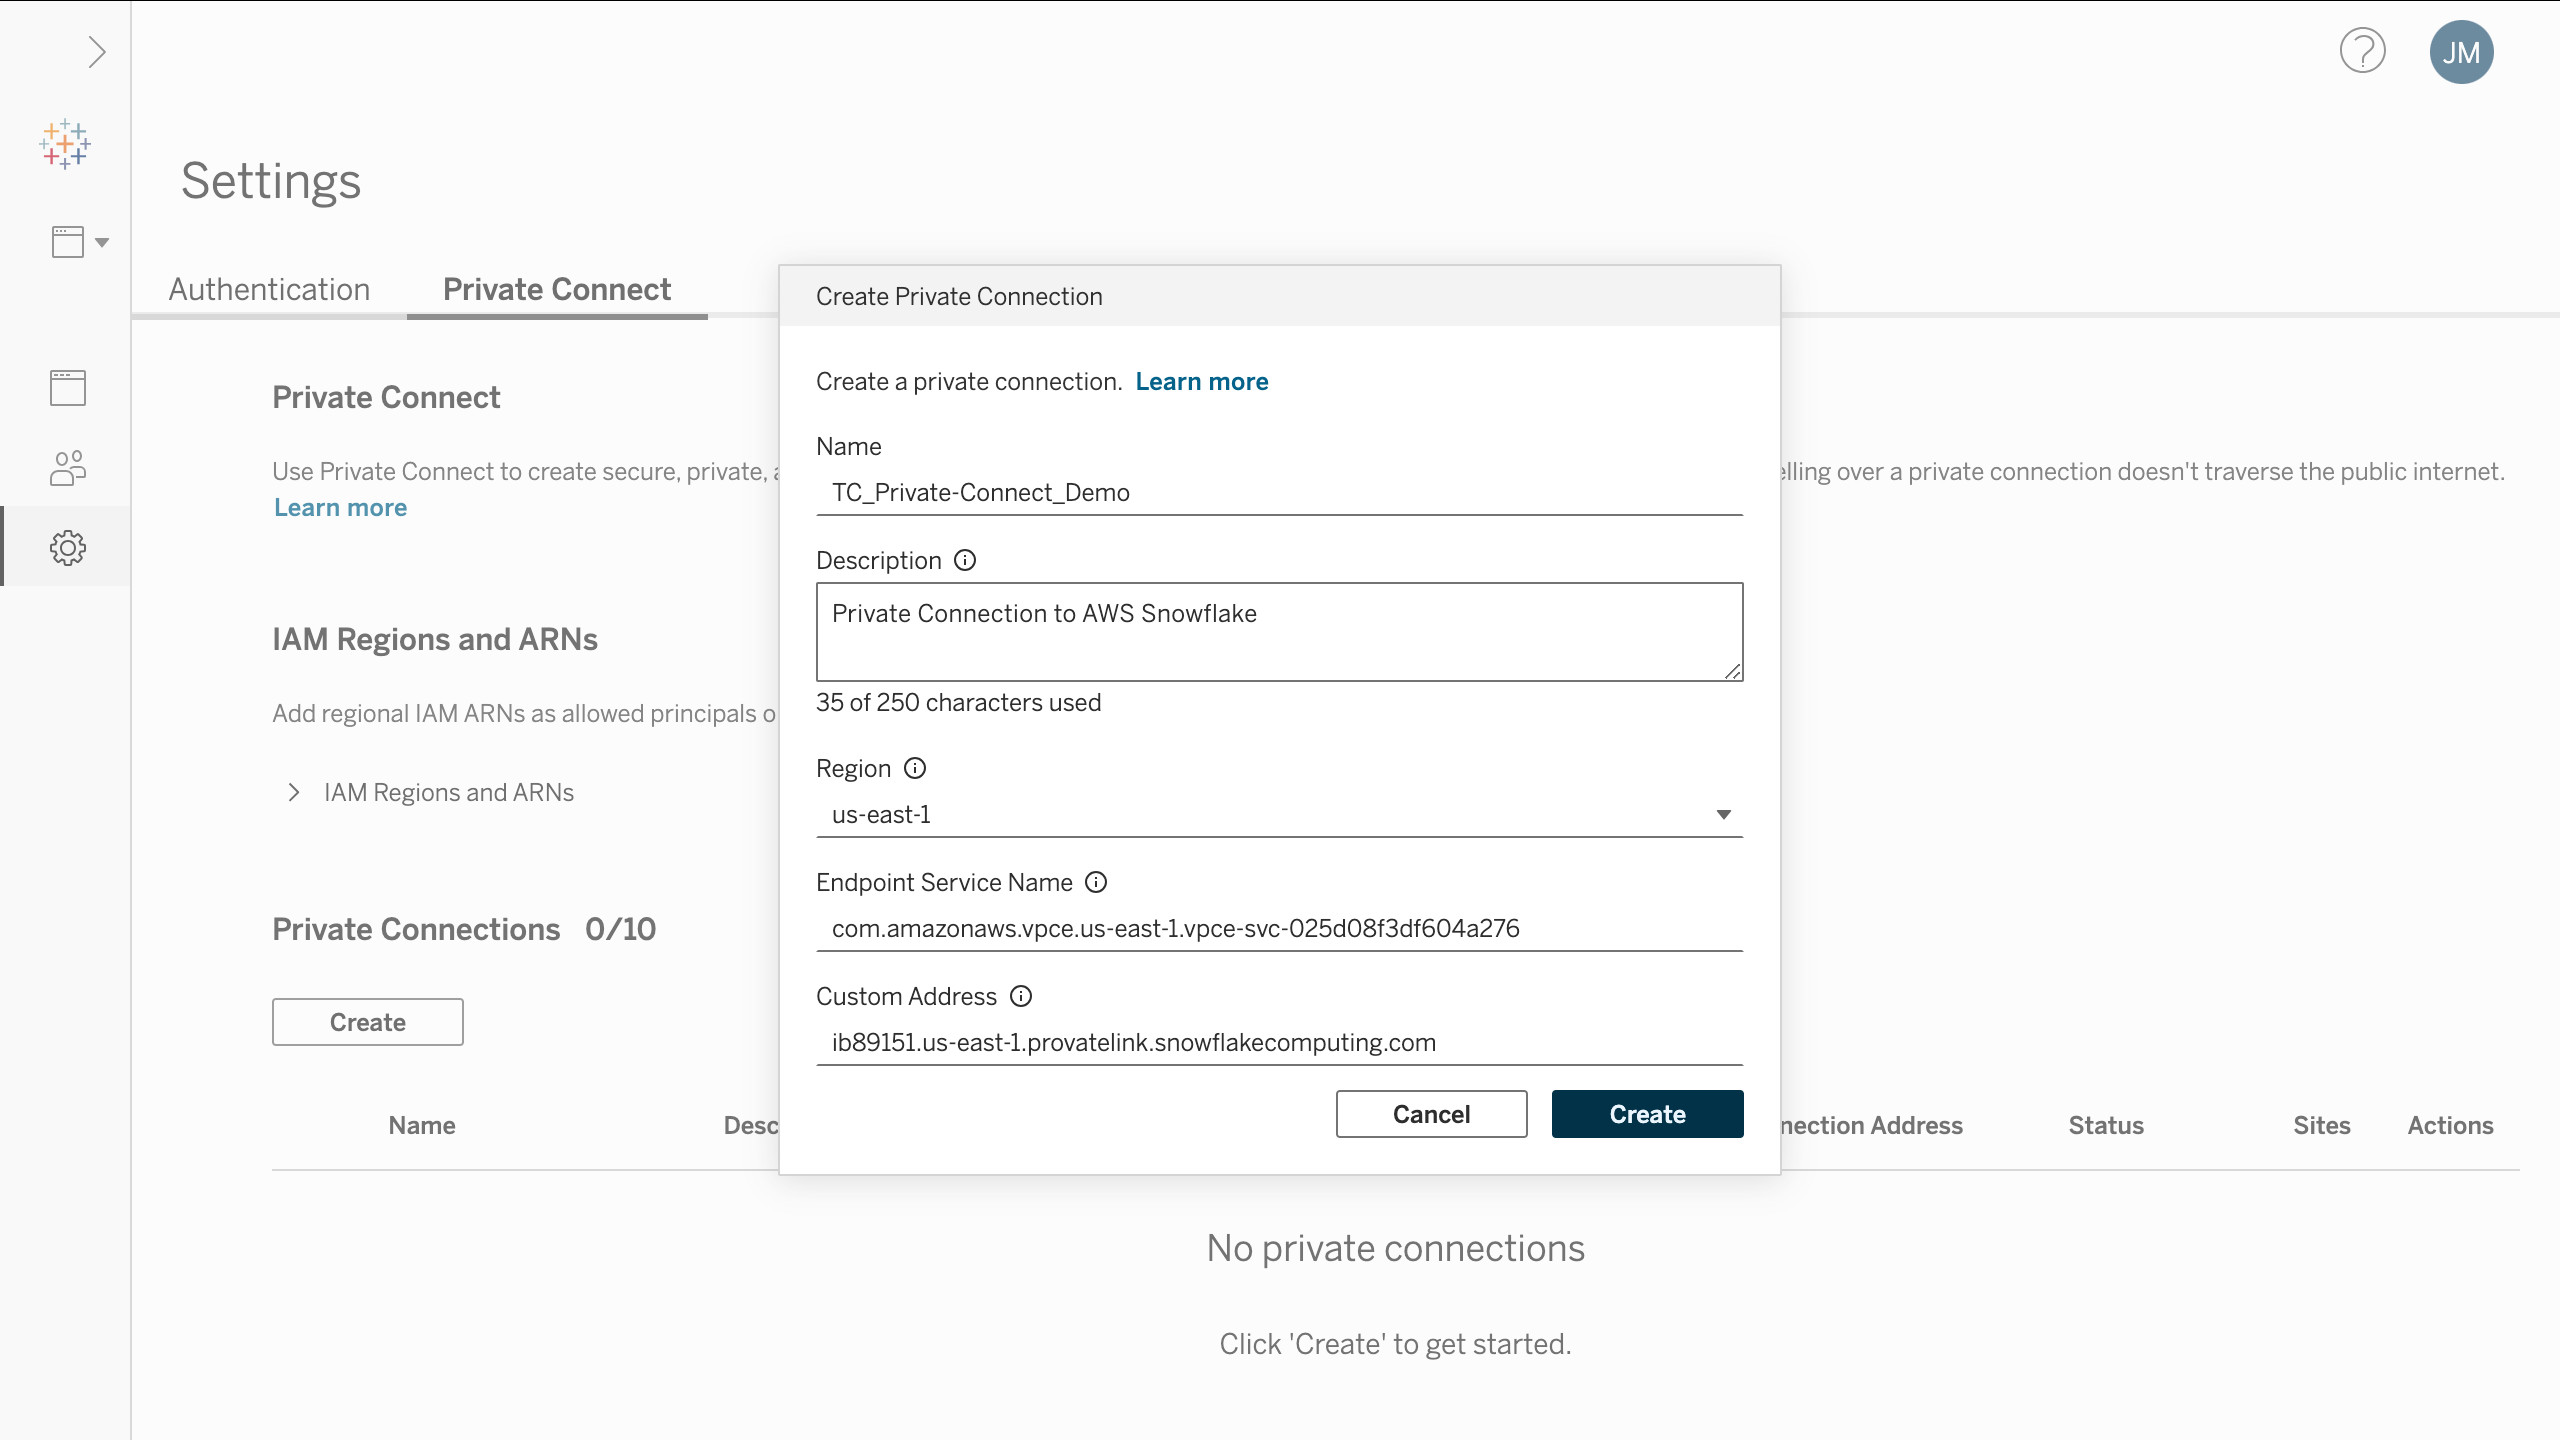
Private Connect: Additional Connectors
Enhance your security by keeping the connection to data private and off the public internet. Tableau Cloud customers can now connect their AWS-hosted databases, such as PGSQL, MySQL, MSSQL, OracleDB, and Aurora, to Tableau Cloud using the AWS Private Link, which provides a secure, dedicated, and private connection, avoiding exposure to the public internet.
Additionally, Private Connect can have cross-region connectivity for Redshift, PGSQL, MySQL, MSSQL, OracleDB, and Aurora. And offers Virtual Connection support.
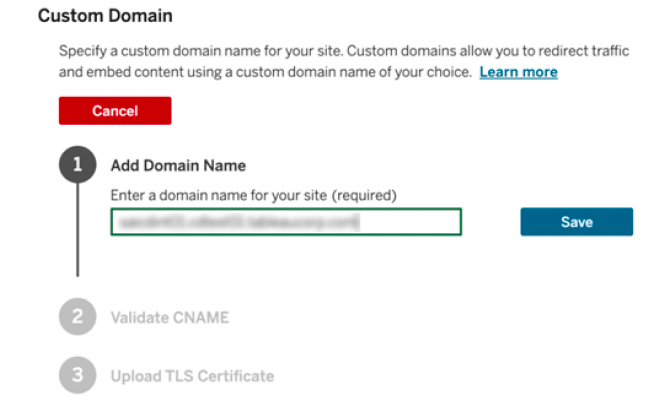
Custom Domains
Provide a branded and seamless experience for your users with custom domains for your Tableau Cloud site. Eliminate the need for third-party cookies in embedded scenarios and give users a simple, memorable URL for accessing their analytics.
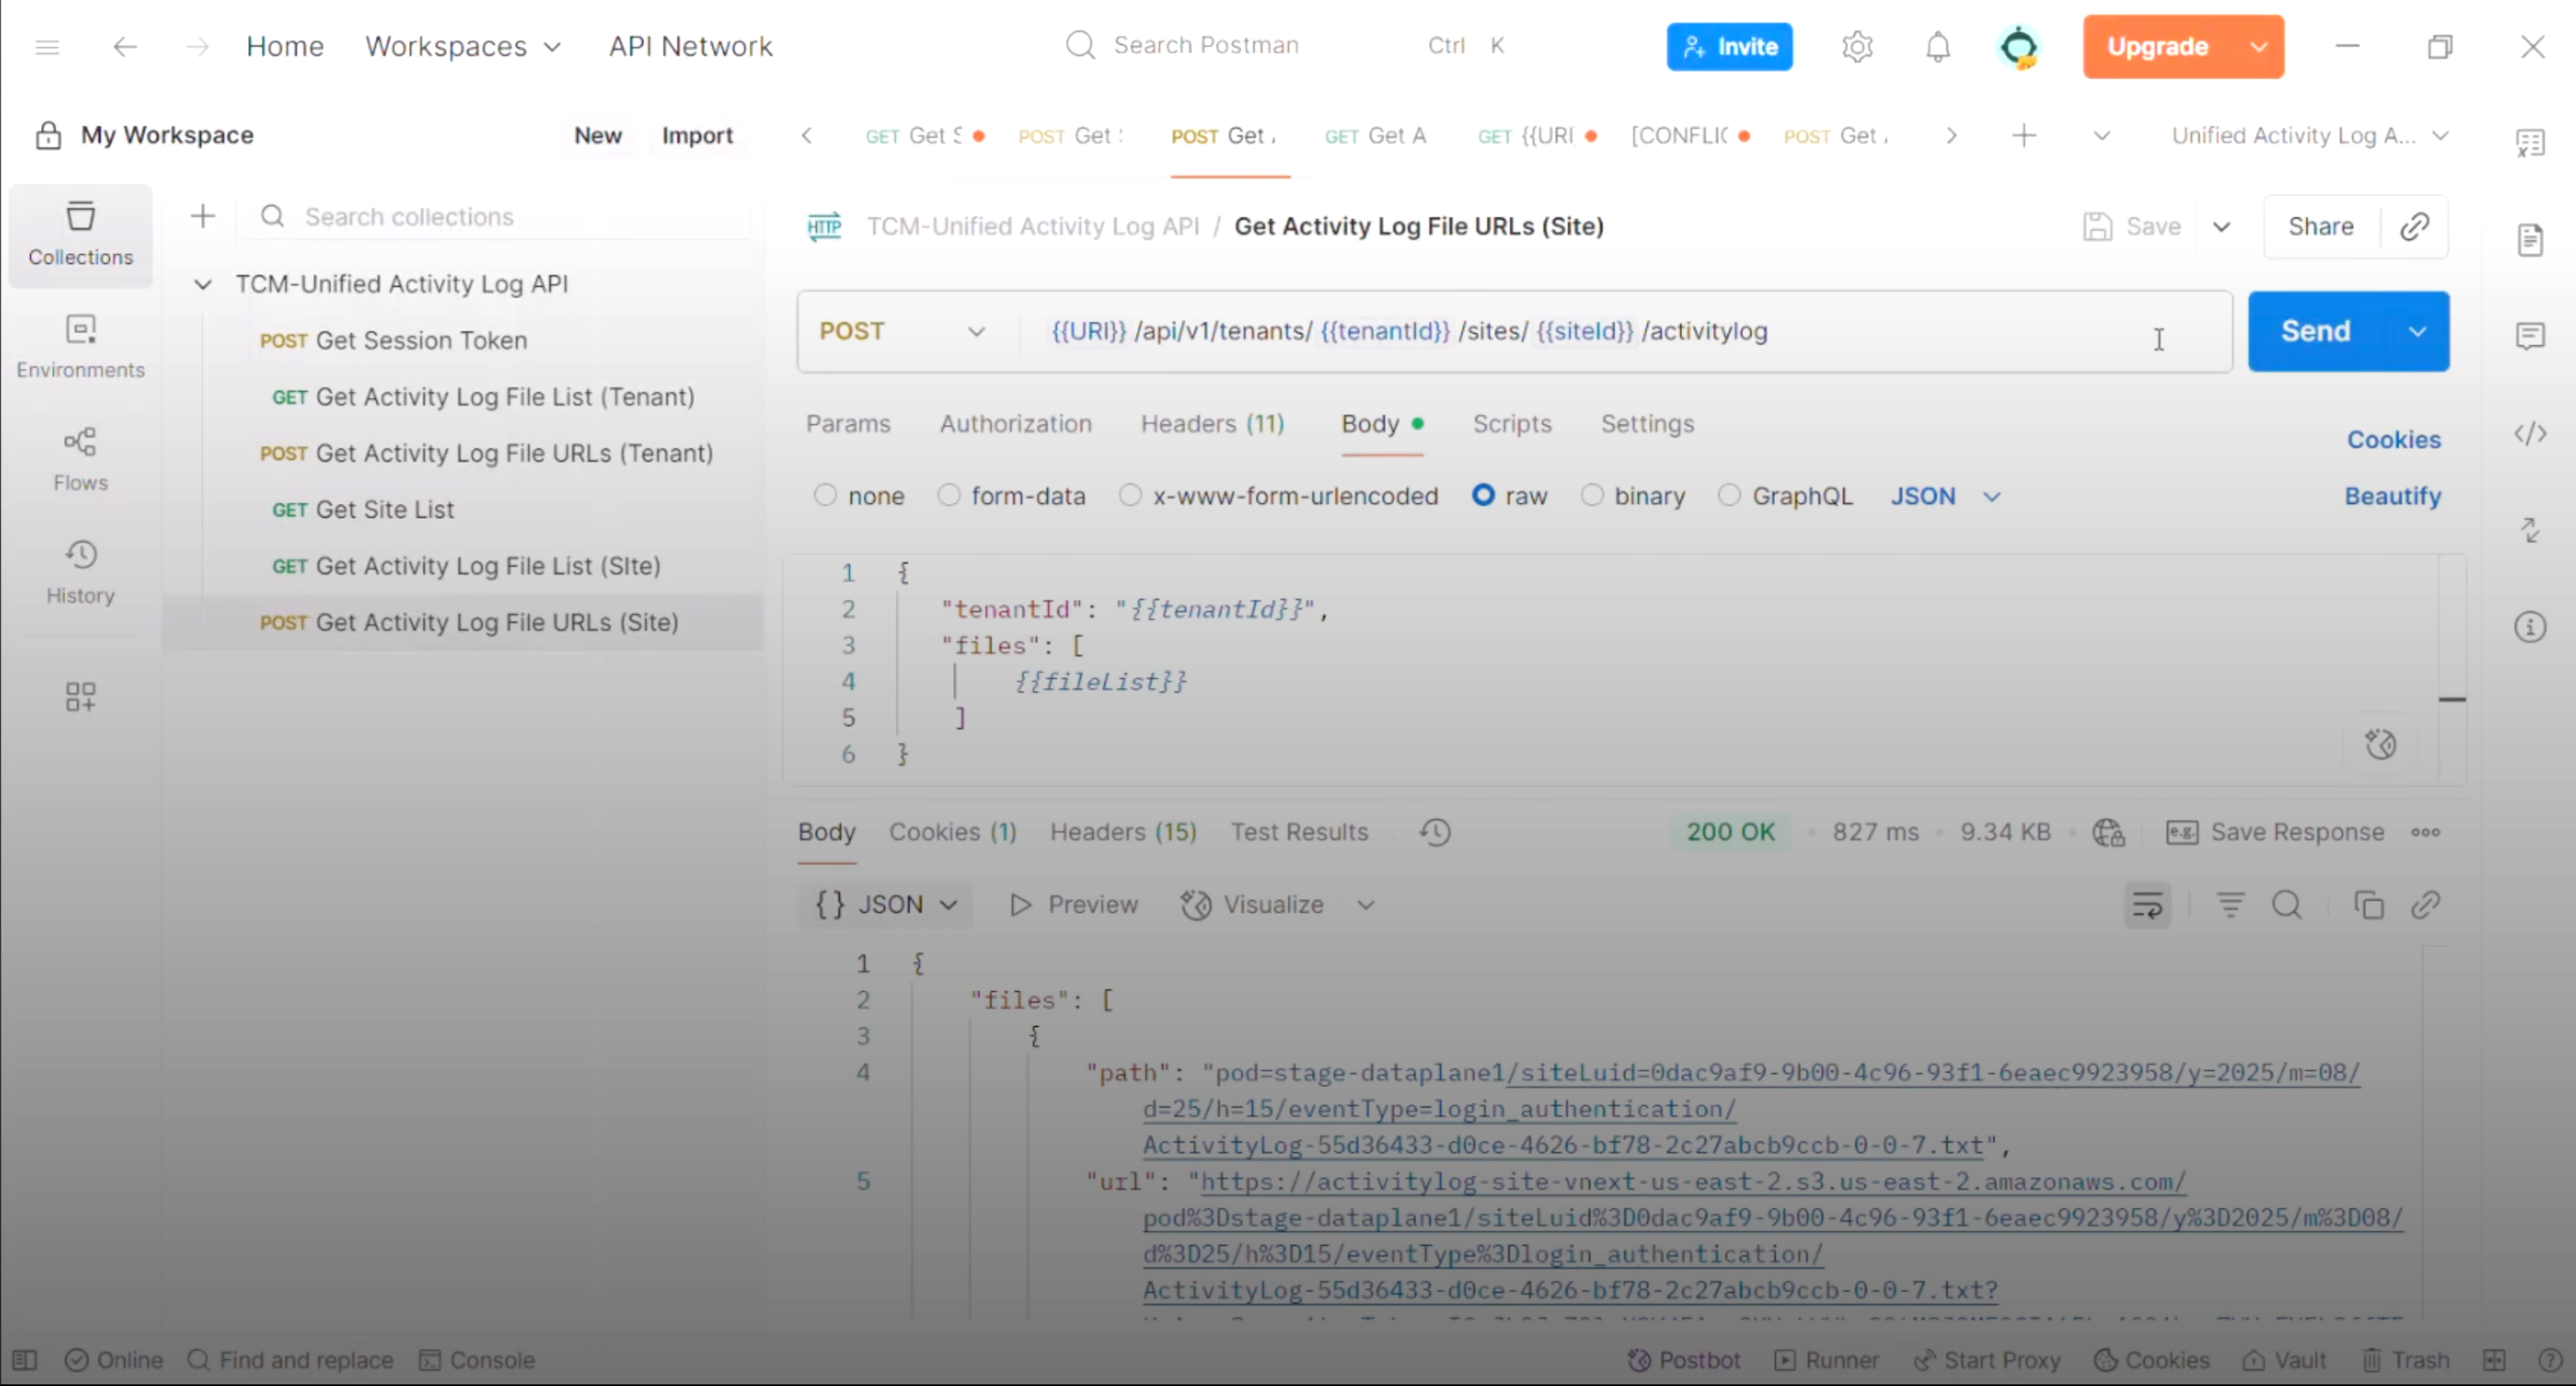
Platform Data API
Gain programmatic access to your Tableau Cloud activity and events data without requiring an AWS S3 integration. Use the new API to retrieve unified event logs for custom monitoring, SIEM ingestion, or analytics in your own data warehouse. Note: Near real-time logs and S3 integration only available with Tableau Enterprise or Tableau+ bundle.
This feature addresses or partially addresses the following request on the Salesforce IdeaExchange: Activity Log support for S3 in other AWS regions.
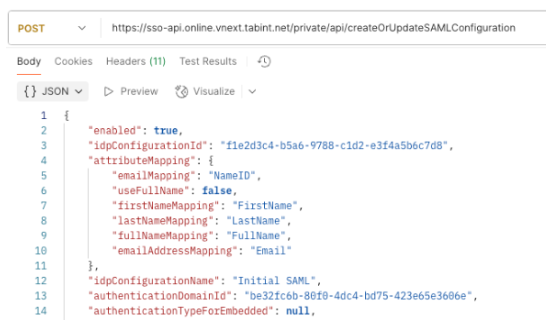
Configure SAML via REST API
Achieve greater efficiency and scale when managing security for multiple sites with the new SAML Configuration REST APIs. Programmatically configure SAML in both Tableau Cloud Manager or a Tableau Cloud site and create scripts to automatically rotate Identity Provider (IdP) certificates.
User Attribute Function for SAML and OIDC
Enhance row-level security with user attributes passed directly from your Identity Provider. Secure data with attribute-based access control (ABAC) through the User Attribute Function (UAF) by dynamically passing attributes from the IdP using SAML or OIDC authentication tokens. This ensures users only see the data they are authorized to see.
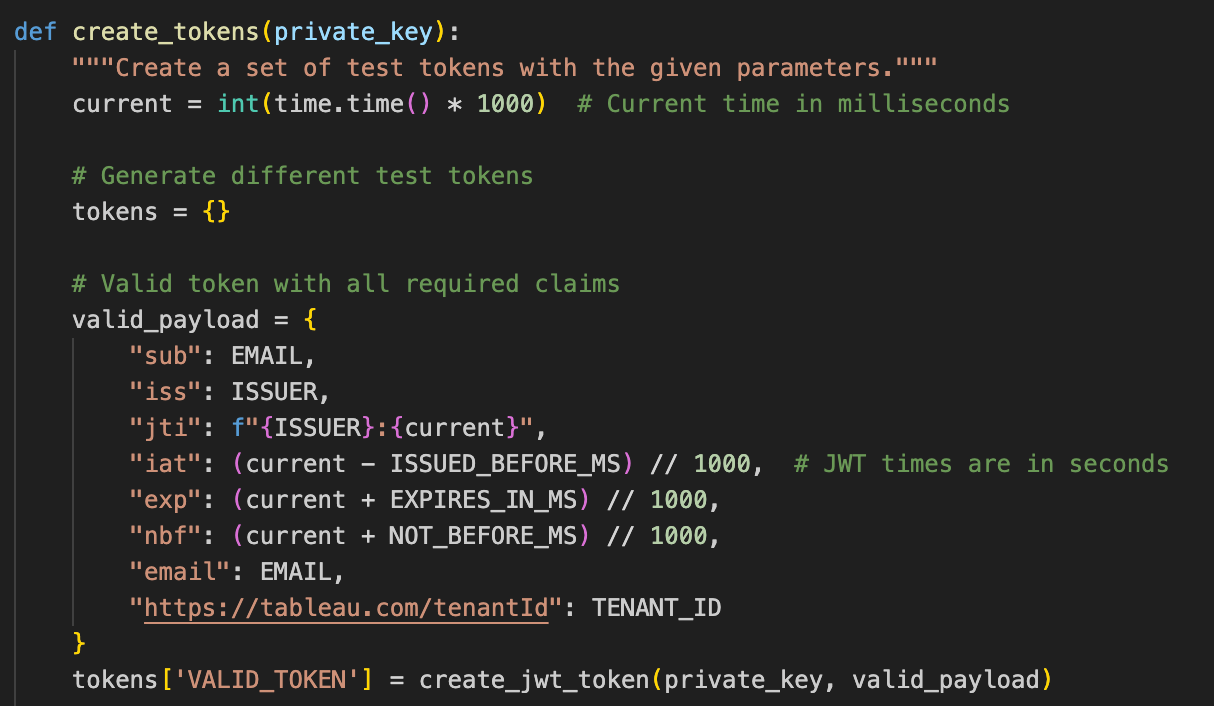
Tableau Cloud Unified Access Token
Simplify multi-site management and enable robust automation with a unified JWT authentication solution. This modern, secure method replaces difficult-to-manage Personal Access Tokens, allowing you to centralize API access across your entire Tableau Cloud environment.
Prep: Write to Databricks
Streamline your data pipeline by outputting prepared data directly to Databricks. Tableau Prep users who also use Databricks can now save time and effort by writing their flow outputs directly into their Databricks database.
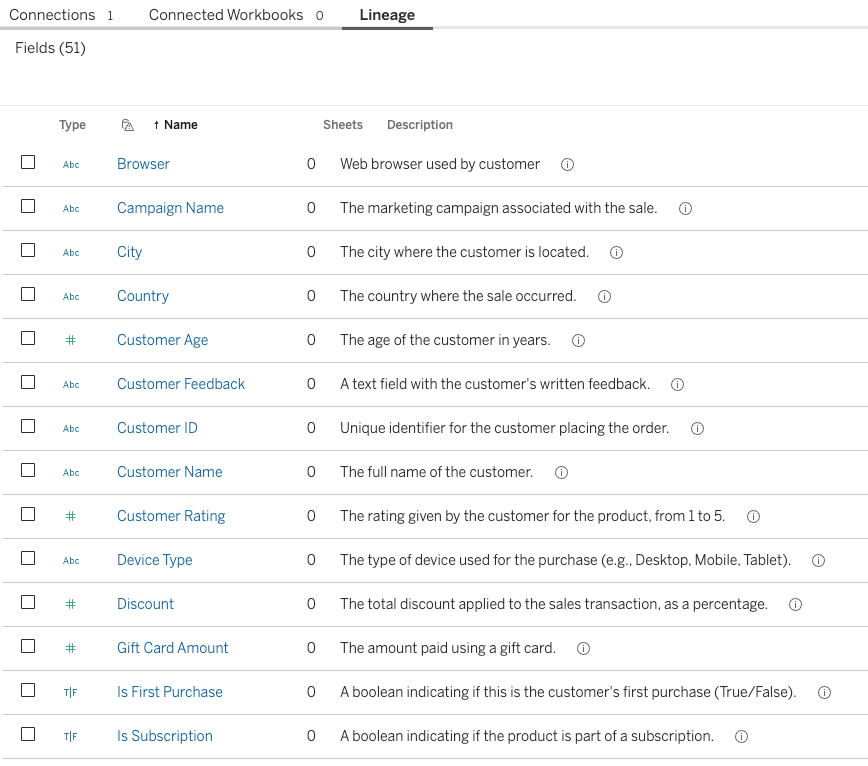
Tableau Agent: Ingesting Field Descriptions
Improve the quality and relevance of AI-generated insights by empowering Tableau Agent with deeper business context. The agent now leverages field descriptions from your data catalog, moving beyond basic metadata to provide more accurate and meaningful responses.
Agent: New Language Support in Prep
Extend the power of AI-driven data prep to more users with multilingual support for Dutch, Swedish, Thai, and Traditional and Simplified Chinese.
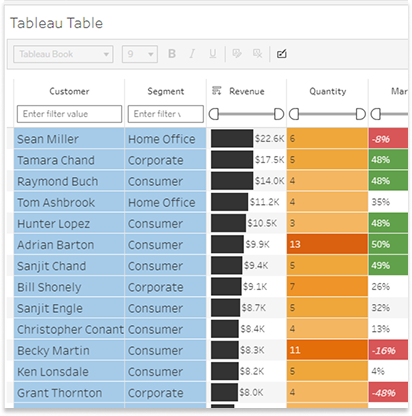
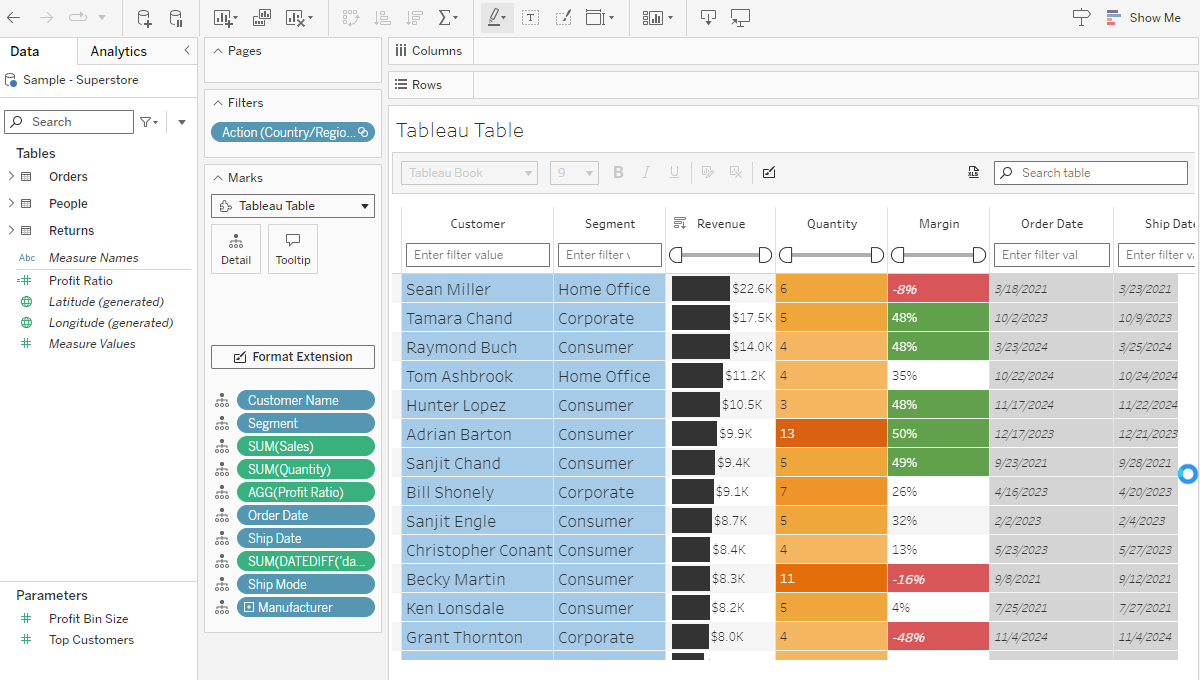
Viz Extension Improvements
Gain greater flexibility and control when authoring with updated Sankey and Table viz extensions. New quality of life improvements have been added to each experience including richer Sankey labels and color mapping controls; with Tables - improved column filter experiences and ability to customize the display of null values across your table in one go. The improvements will be available in Tableau Desktop, Cloud, Server and Public.
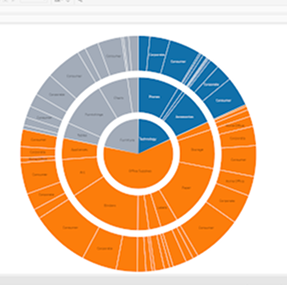
Radial Viz Extension
Easily create compelling donut and sunburst charts to visualize part-to-whole relationships. This new viz extension can be added to the workbook directly in the marks card drop-down or via Show Me. Drag and drop to visualize data in radial formats that are popular with stakeholders and can help them understand hierarchical relationships on Tableau Desktop, Cloud, Server, and Public.
This feature addresses or partially addresses the following request on the Salesforce IdeaExchange: Add a Donut Chart with Donut Hole. It also addresses [1], [2], [3].
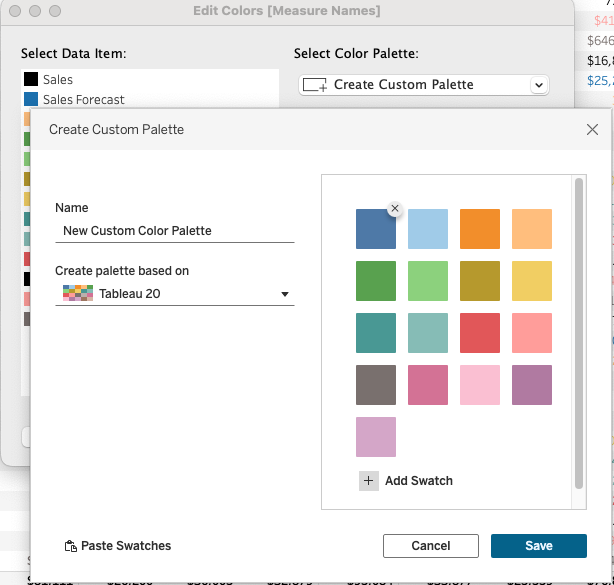
Custom Color Palettes
Ensure brand consistency and style your visualizations perfectly by creating and saving custom color palettes directly within Tableau Desktop. This new experience allows creators to build and modify palettes that can be reused across the workbook or multiple workbooks. The Custom Color Palettes are saved out to the preference file and will persist for future Tableau Desktop sessions.
This feature addresses or partially addresses the following request on the Salesforce IdeaExchange: Create custom color palettes. It also addresses [1] and [2].
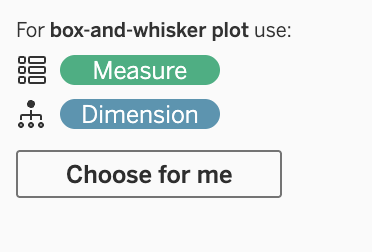
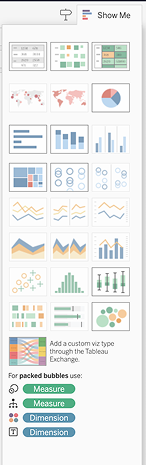
Instant Viz in Show Me
Previously released on Tableau Cloud, Tableau Server users can now simplify your data analysis with an updated Show Me experience. When opening Show Me, see a viz of your data in just a couple of clicks. All viz types are available by default, allowing you to select the fields you want or let Tableau help you get started.
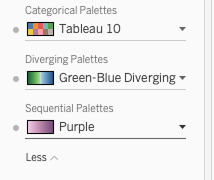
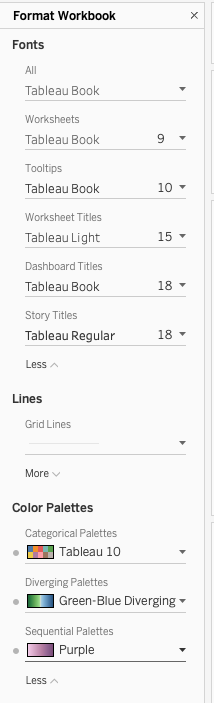
Workbook Color Palette Assignment
Ensure color consistency across your entire workbook with new palette settings. Creators can now set the default categorical, diverging, and sequential color palettes once to apply consistent styling across all your vizzes and dashboards, saving you time and effort. Available in In Tableau Desktop and Tableau Cloud and Server Web Authoring.

Add Related Tables
Author data models with greater productivity and accuracy. Automatically add related tables and define their relationships in your data model, leveraging foreign key constraints defined in your database to simplify your setup in Tableau Desktop, Server, and Cloud.
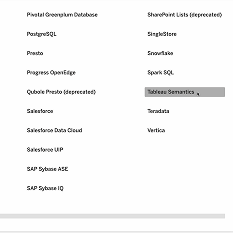

Tableau Semantics Connector Updates
Seamlessly leverage additional semantic definitions from Tableau Semantics models in Tableau Server. Additionally, new updates in the connector are also available to Tableau Desktop, Server, and Cloud users. You can now reuse curated Tableau Semantics data sources across users and workbooks when refining and extending Tableau data sources. Add groups and bins defined in semantic models to visualizations, allowing users to leverage curated business logic. Create visualizations using multi-fact semantic models to enable cross-area analysis. Display images in visualizations without configuration.
Note: The ability to publish Tableau Semantics data sources will come soon after the Tableau 2025.3.0 release.
Tableau MCP: OAuth Support
Ensure enterprise-grade governance and security standards while using Tableau MCP. With the support of HTTP transport and OAuth you can centrally host and manage a remote Tableau MCP server that accepts requests from distinct users and respects row-level security policies on your Tableau Server.
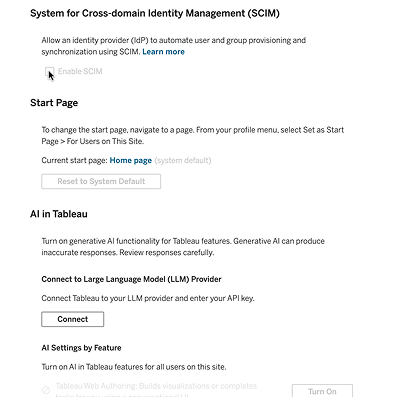
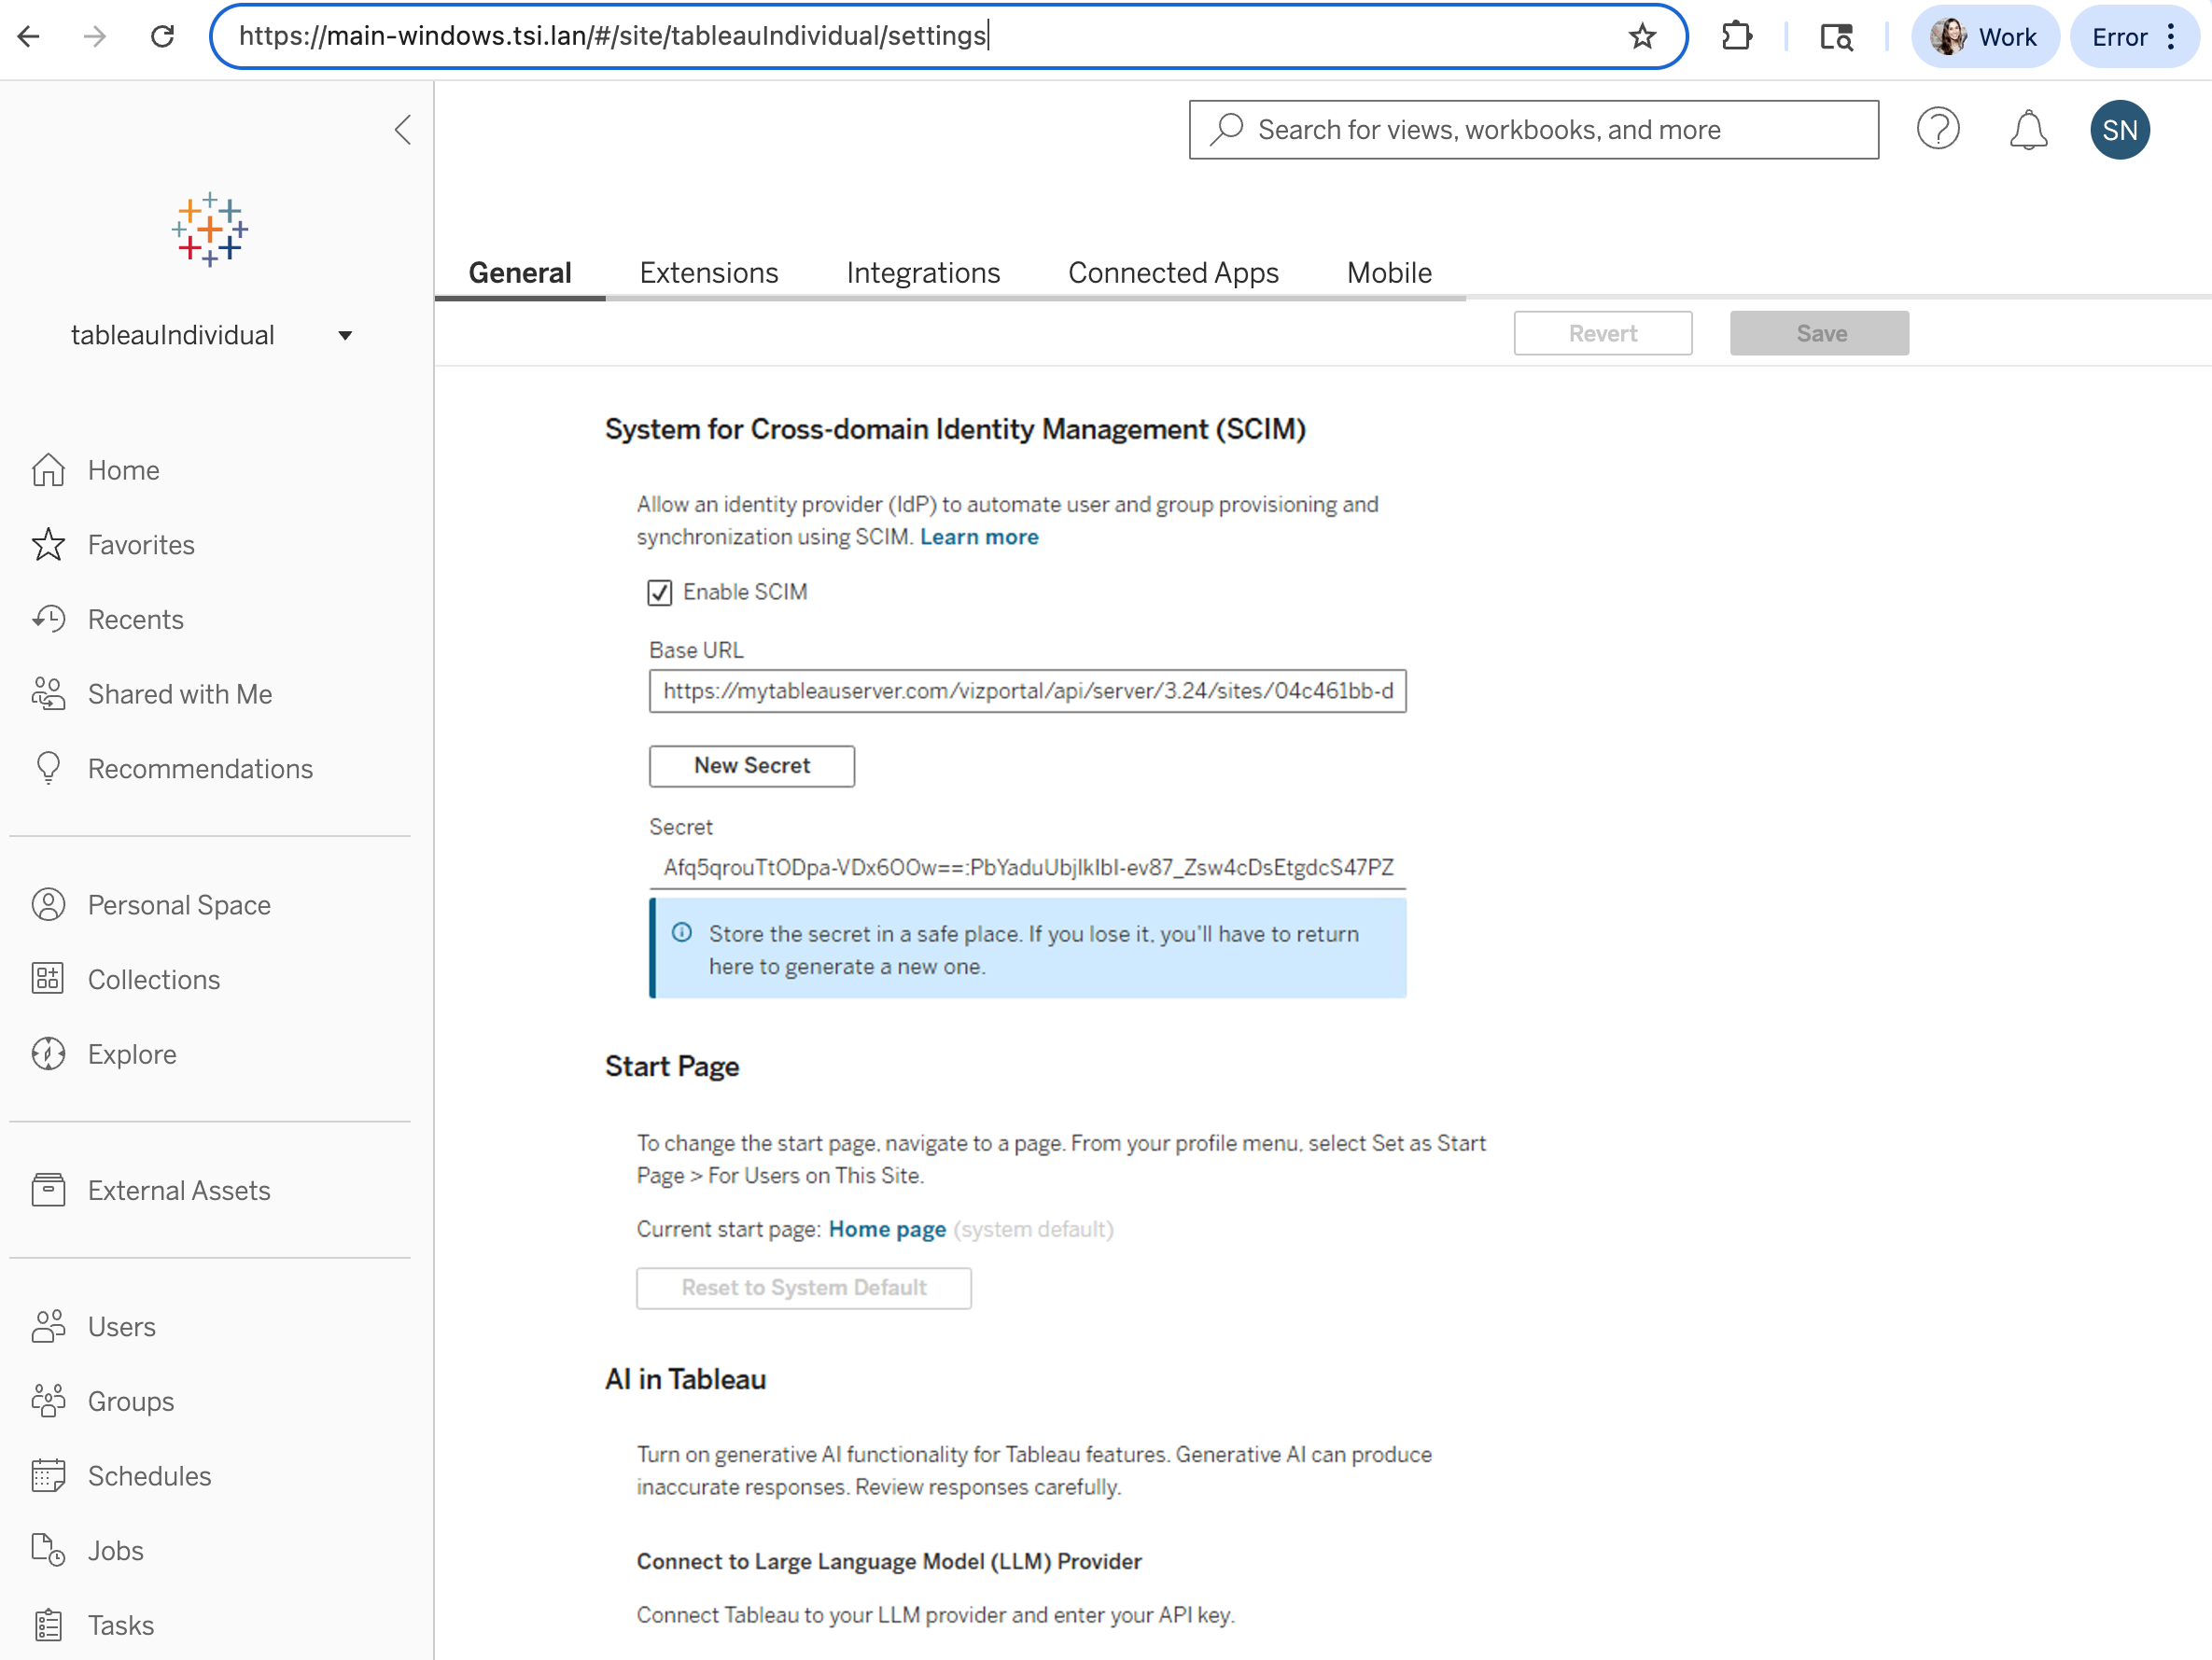
SCIM Support on Tableau Server
Previously released on Tableau Cloud, you can now provision users and groups to Tableau Server using your identity provider (IdP) as the source of truth. You gain efficiency by avoiding the need to manually manage users and groups across multiple applications, and remain standards-compliant by using SCIM.
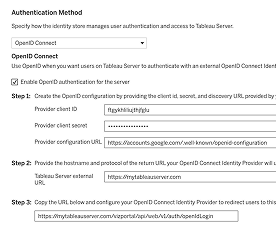
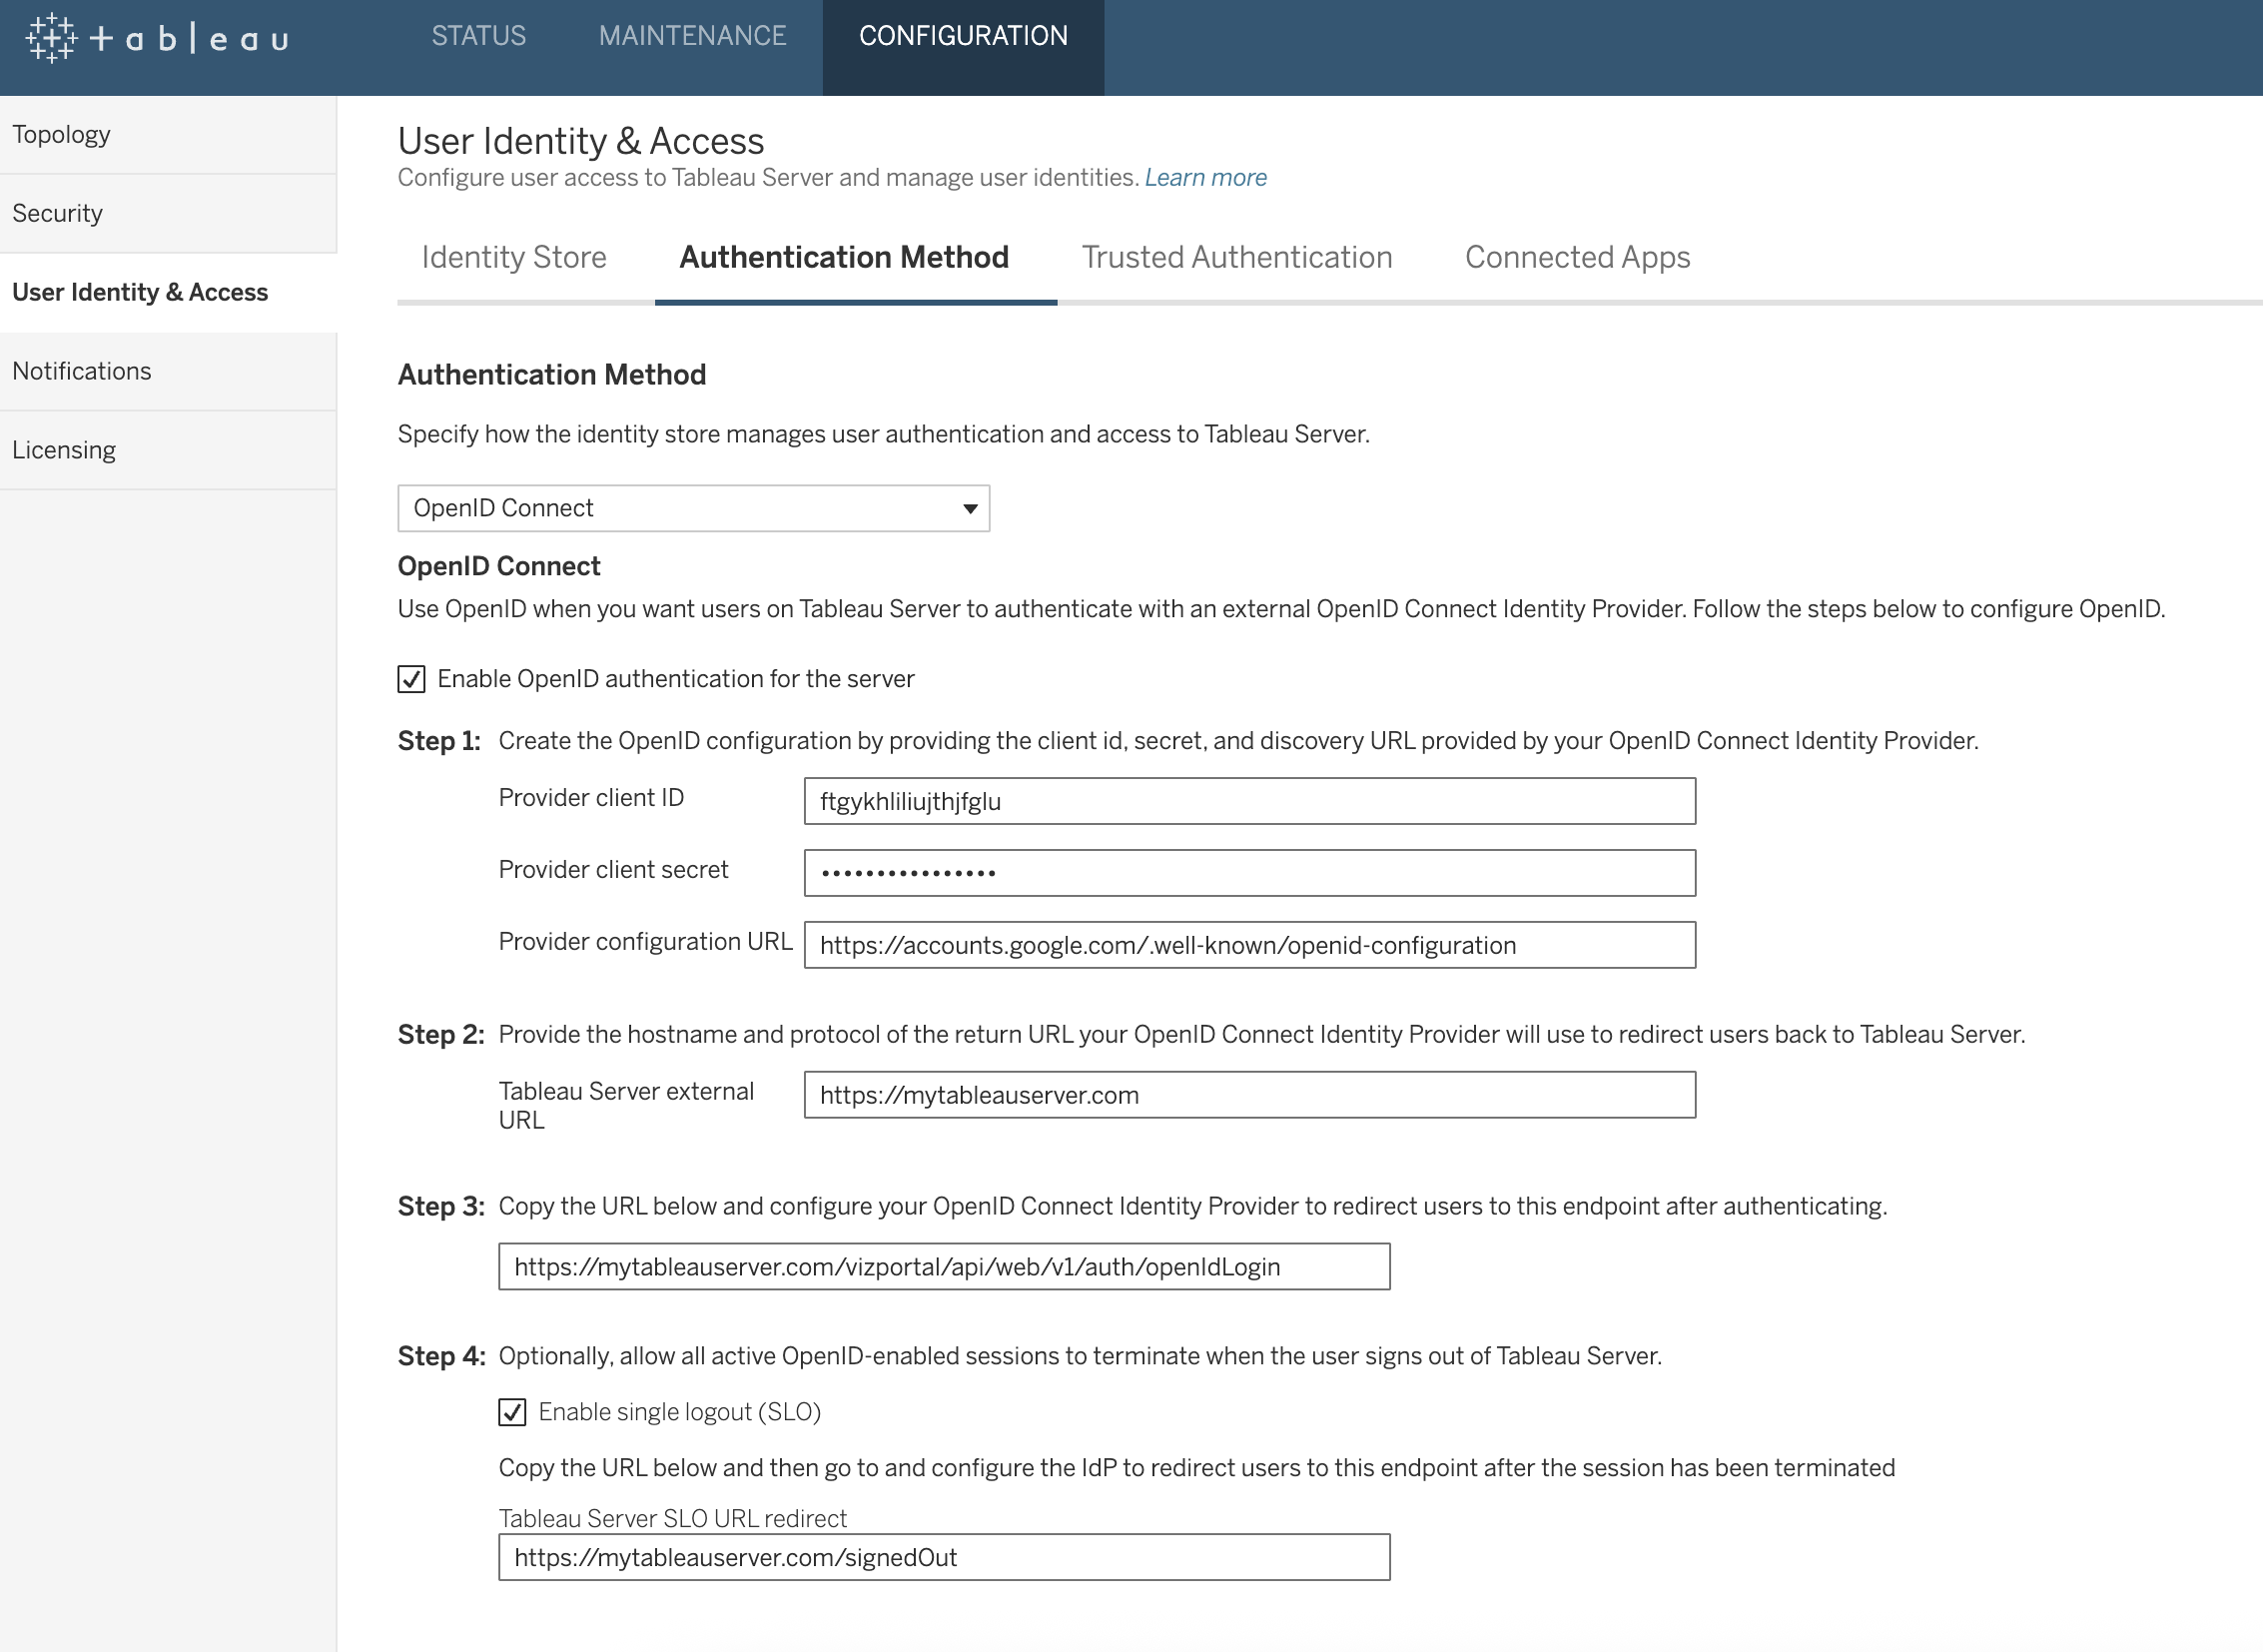
OpenID Connect RP-initiated single logout
When configuring OpenID Connect, Tableau Server admins can now enable single logout (SLO) to provide a better business user experience and improve security across the organization. When enabled, users signing out from Tableau Server will also get logged out of their Identity Provider (IdP) and associated applications, eliminating the risk of orphaned sessions and session hijacking.
This feature addresses or partially addresses the following request on the Salesforce IdeaExchange: Sign out the session with OpenID provider.

View Reactions on Tableau Public
Engage with visualizations and authors on Tableau Public using a new set of emoji reactions. This feature offers a fun way for viewers to provide feedback, directly to the authors.
This feature addresses or partially addresses the following request on the Salesforce IdeaExchange: Add reactions / emojis to Tableau Public. It also addresses [1].

Find authors on Tableau Public
Find creators in the Tableau Community on Tableau Public's homepage. Find and follow talented authors for fresh engaging content, designed to inspire.
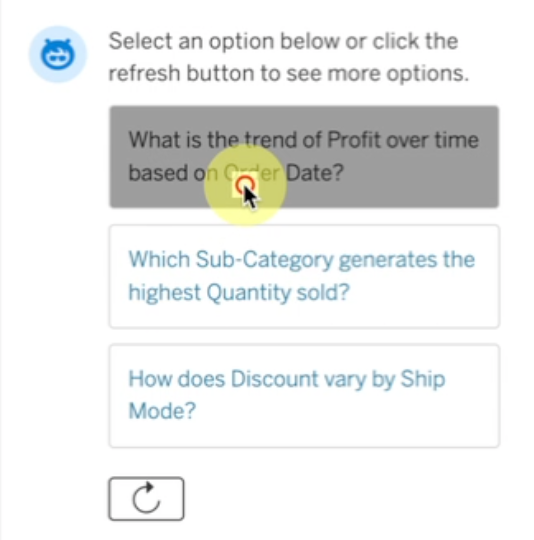
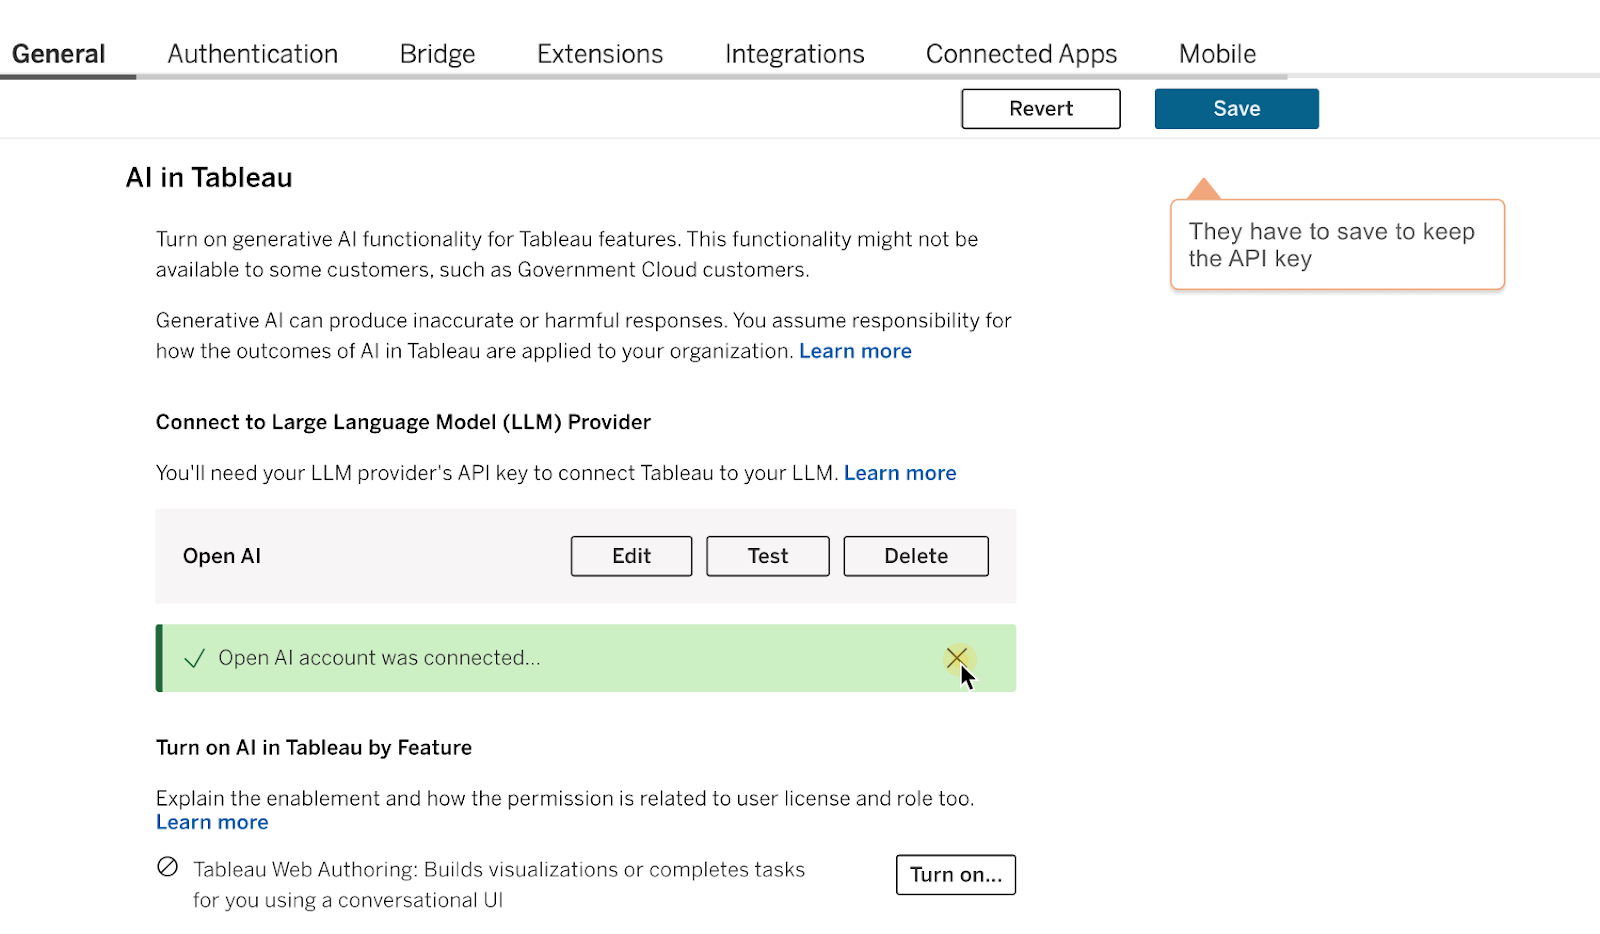
Tableau Agent in Tableau Server
Collaborate with Tableau Agent, your AI-powered assistant, to get to insights faster on Tableau Server. Use natural language to get support through every stage of analytics—from data preparation to exploration and visualization. Tableau Agent in Server will support Tableau Prep and Web Authoring capabilities. You need to connect to OpenAI using your API keys before launching Tableau Agent in Web Authoring or Desktop for a turnkey experience.
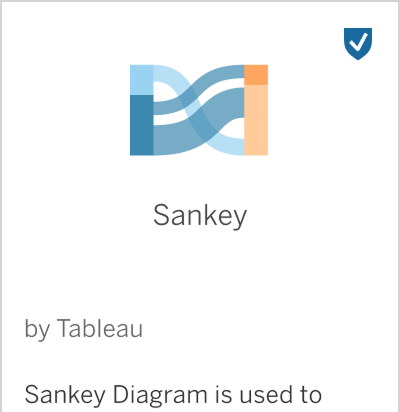
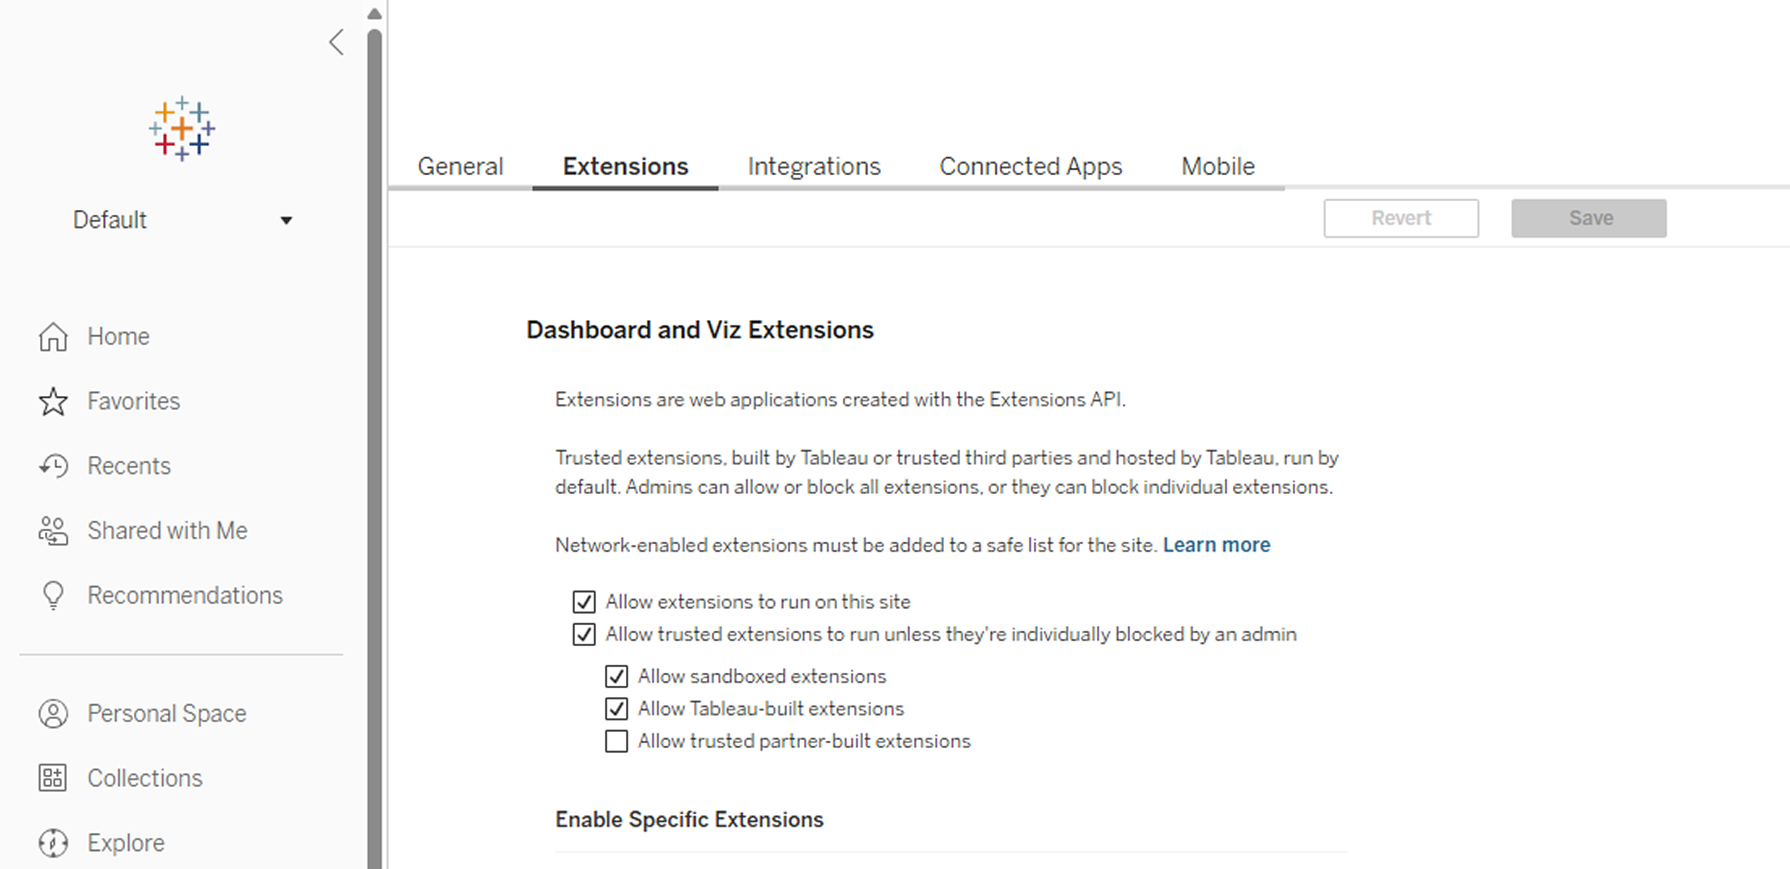
Trusted Extensions
Admins and analysts can confidently adopt extensions available in Tableau Exchange by quickly identifying Trusted Extensions. Extensions marked with the new blue checkmark badge are deployed and mediated by Tableau: they have gone through Tableau code review, network testing, and are hosted by Tableau to manage availability and security.
Admins have new settings to allow or block extensions from running, enabling better alignment of this Tableau backed standard. All Trusted extensions are also automatically enabled for full use in Tableau Public
Trusted extensions are available in Tableau Desktop, Cloud, Server, and Public.
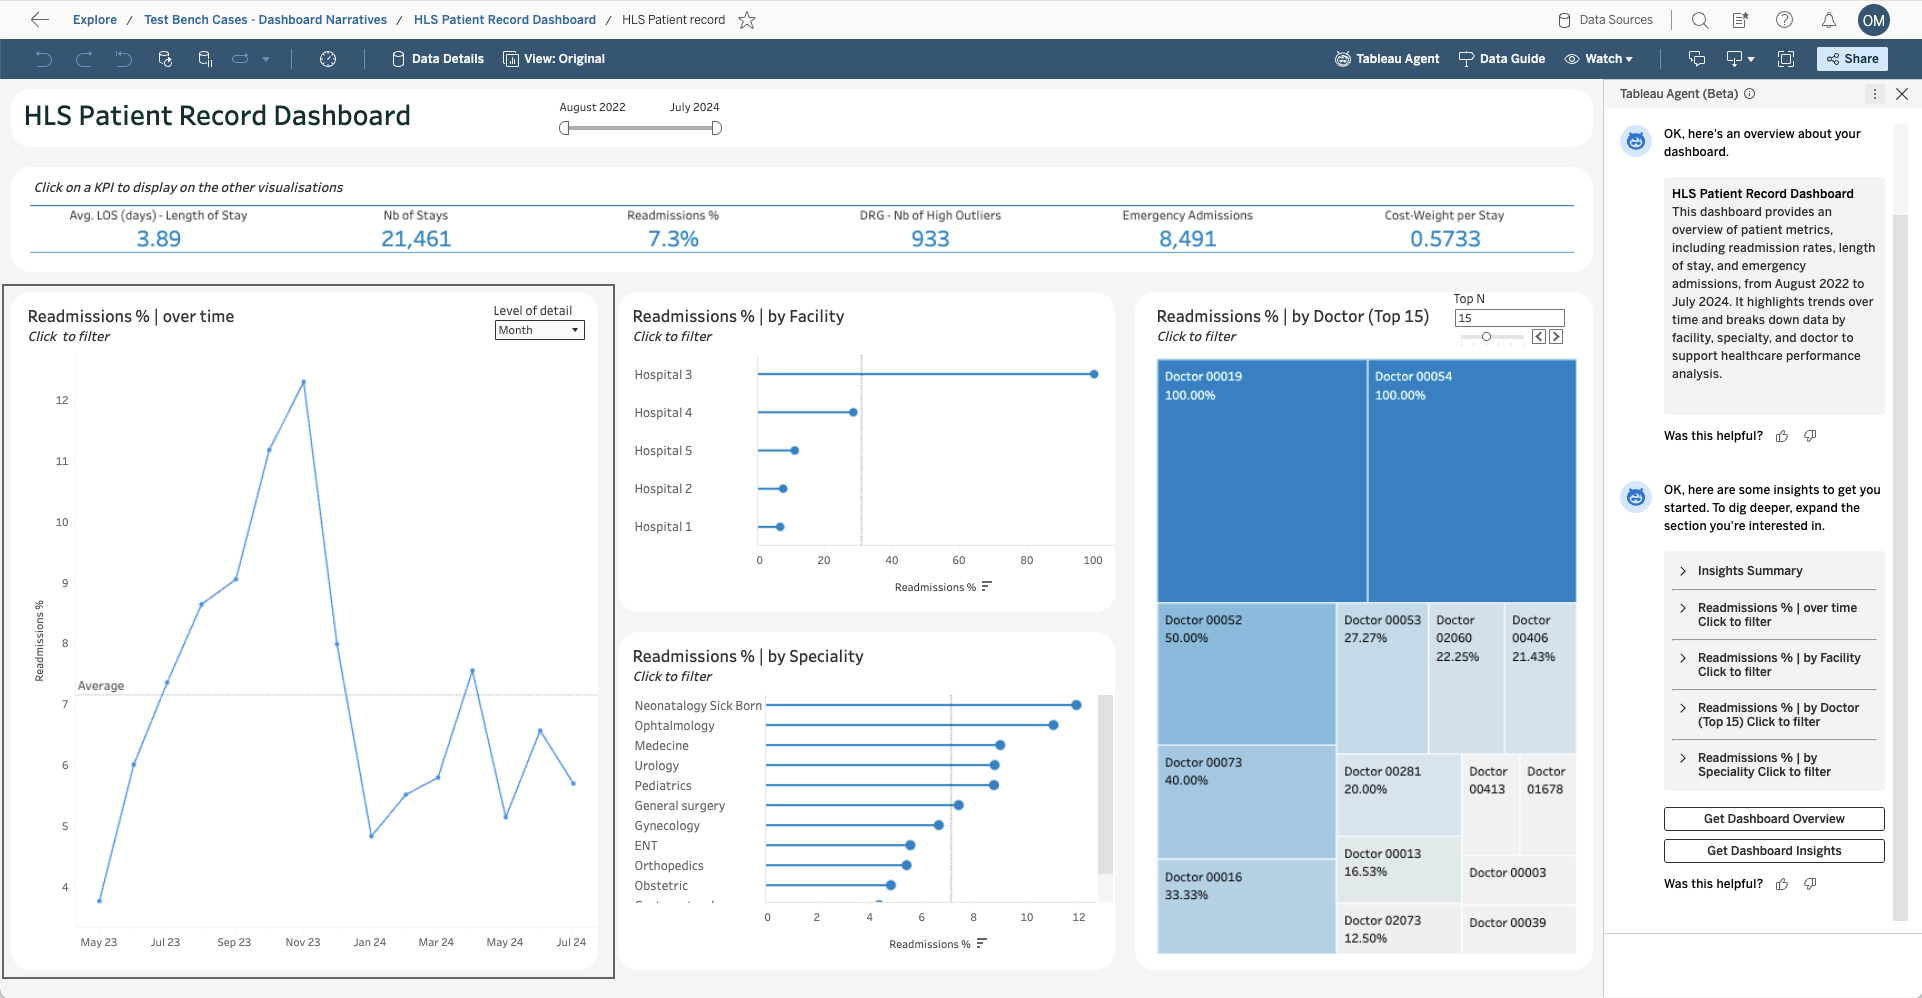
Tableau Agent: Dashboard Narratives
Ease data discovery with intuitive, AI-generated explanations. Tableau Agent delivers dashboard narratives that provide a concise overview of the dashboard and insights for each viz, highlighting meaningful trends.
Beta coming soon to Tableau Cloud and Desktop.
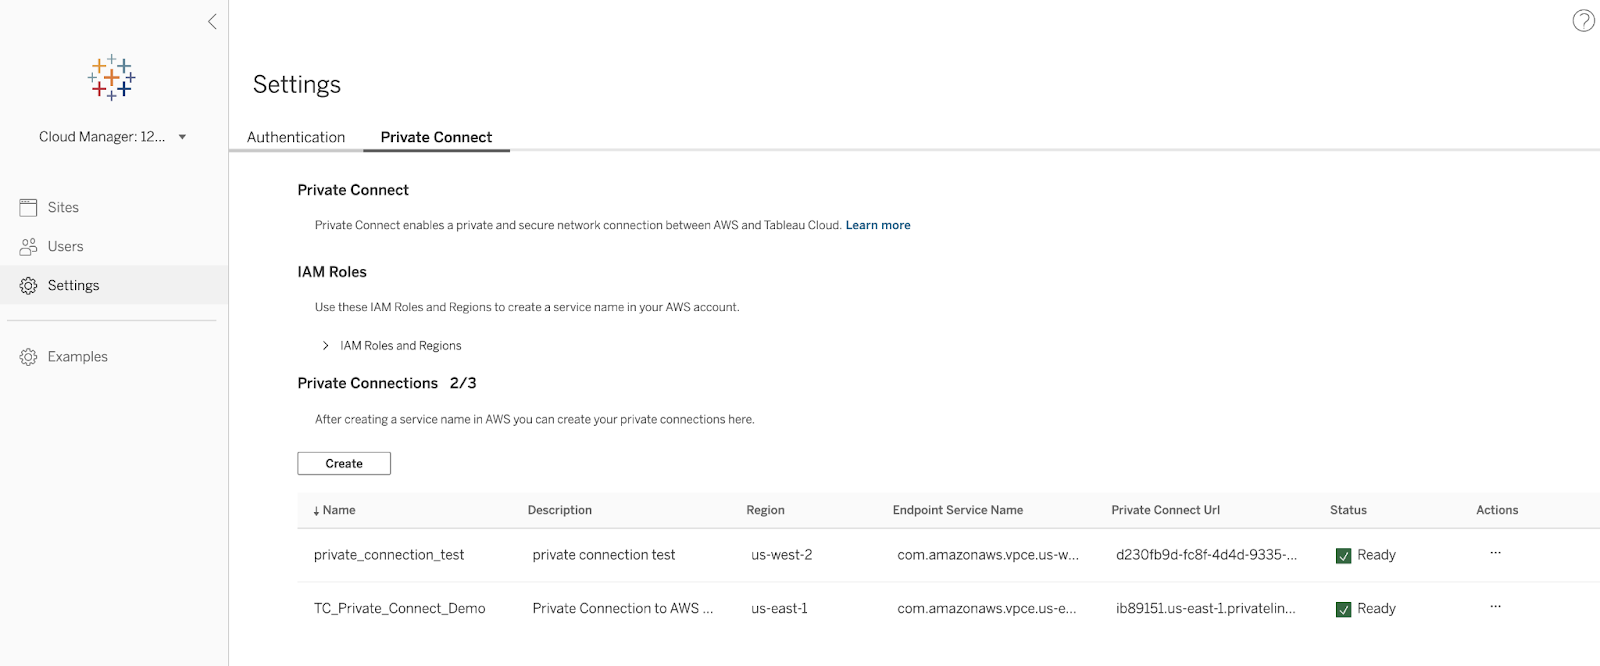
New Connectors for Private Connect
Securely connect more of your AWS data to Tableau Cloud without exposure to the public internet. Private Connect now supports AWS hosted MariaDB, Dermio Server, Teradata Server, Heroku, and Teradata Vantage Cloud, allowing you to use a dedicated and private connection to more of your data sources.
This feature addresses or partially addresses the following request on the Salesforce IdeaExchange: Implement AWS PrivateLink in Tableau Cloud.
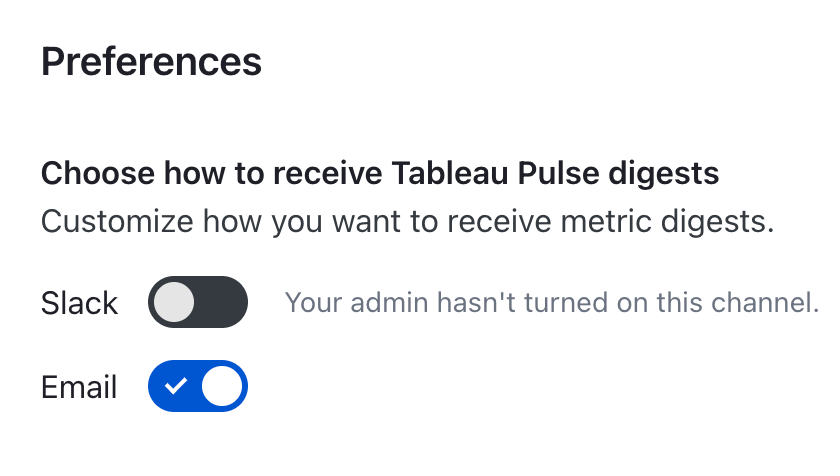
Tableau Pulse: Disable Alerts and Digest
Manage the Pulse user experience by disabling digests and alerts at the site level. This gives admins control and helps manage phased rollouts.
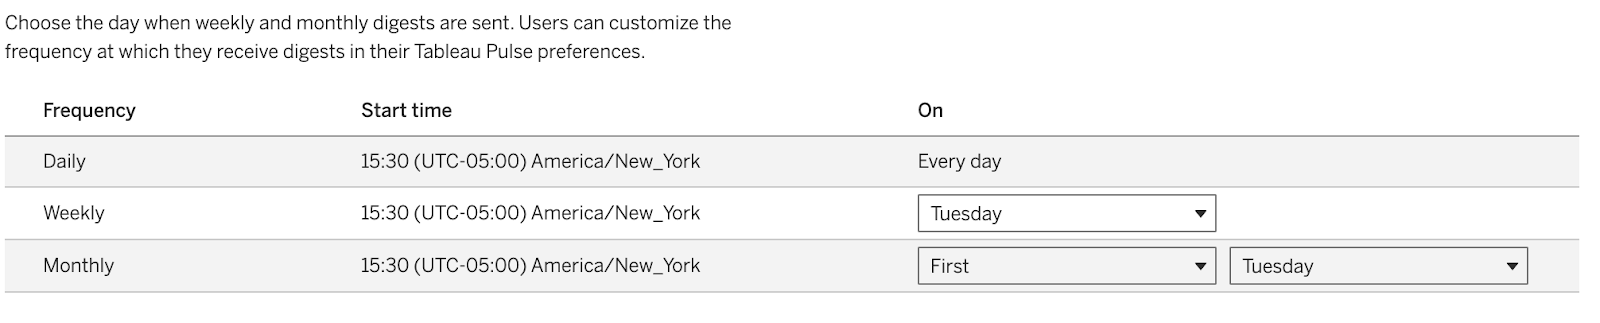
Tableau Pulse: Customize Digest Frequency
Customize your digest delivery. Set a specific day for weekly or monthly digests to ensure your insights arrive exactly when they're most useful.
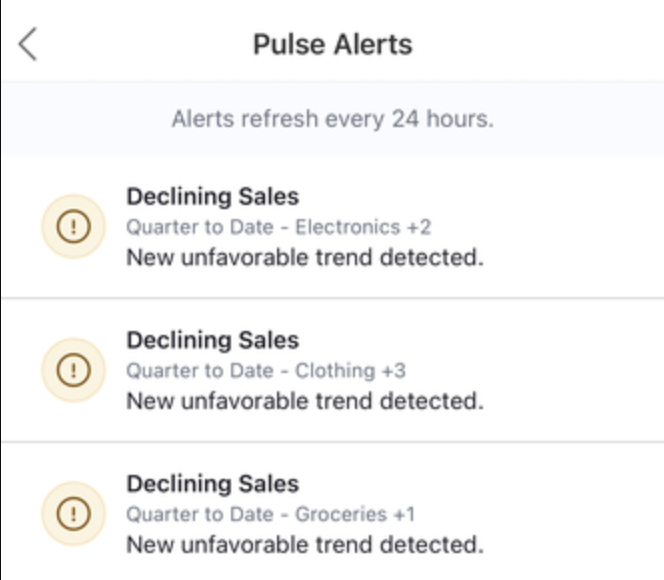
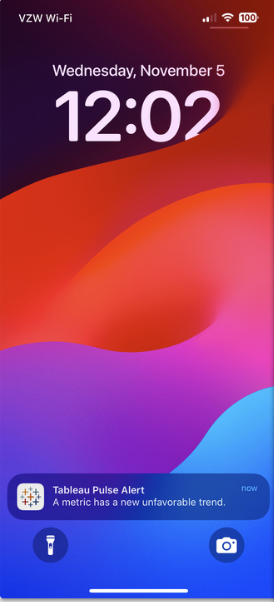
Tableau Pulse: Mobile Push Notifications
Get important Tableau Pulse alerts on the go without running the Tableau mobile app in the background. With mobile push notifications from Tableau Pulse, business users can better track important updates in real time, wherever they are.
Available on both Android and iOS.
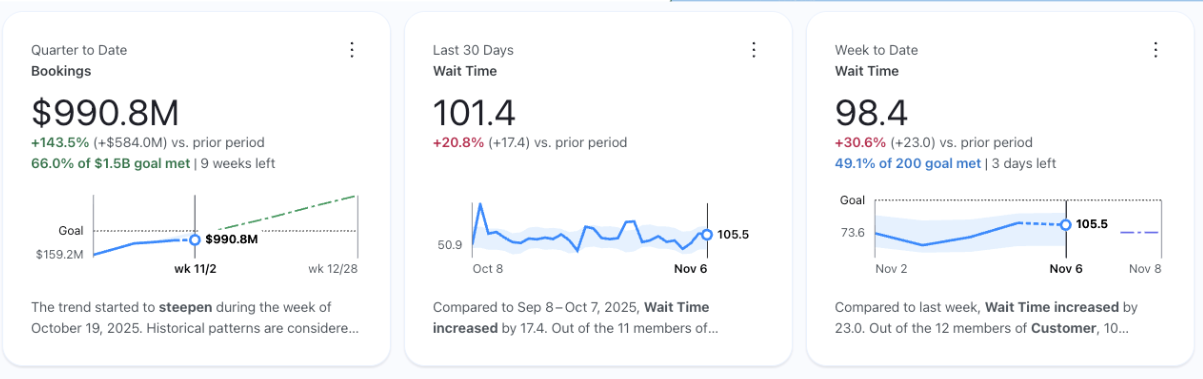
Tableau Pulse: Pacing and Historical Context on Metric Card
Quickly evaluate a Tableau Pulse metric based on pacing and historical context. Now business users can see both the metric's progress to a set goal and its performance relative to the prior period directly on the metric card. Instead of having to click into the metric details, users can obtain a fuller sense of the metric's performance directly from the Tableau Pulse home page.
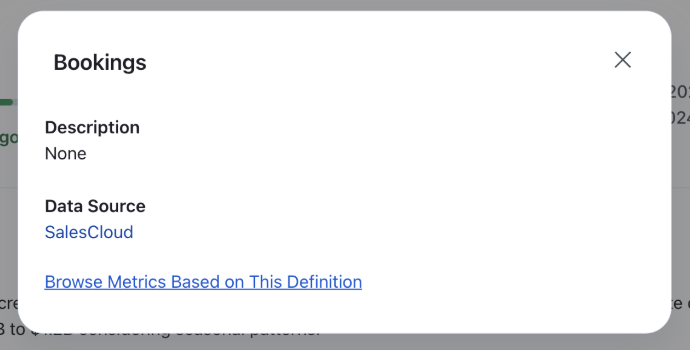
Tableau Pulse: Link to Metric Datasource
Easily explore the data behind a Tableau Pulse metric for deeper insights. Instead of only getting the datasource name in Tableau Pulse and having to search for the actual data, business users can now click into the datasource directly from the metric in Tableau Pulse.
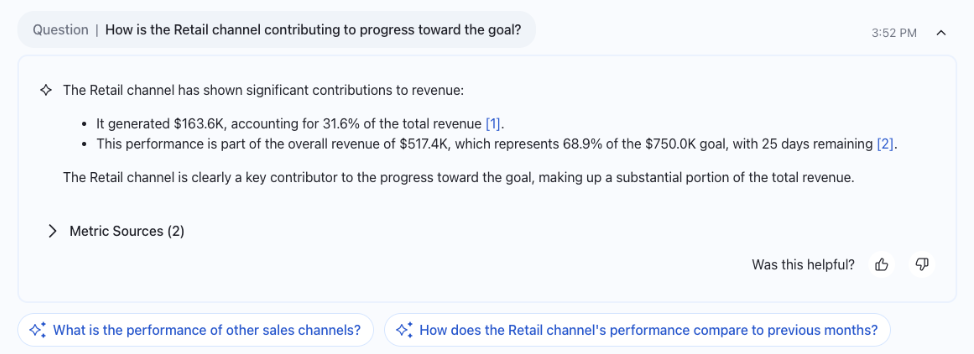
Tableau Pulse: Q&A for Goals and Thresholds
Get intuitive answers around set goals and thresholds from Tableau Pulse. Tableau Pulse uses frontier LLMs to detect patterns, highlight risks, and now, explain changes across multiple metrics relative to their set goals and thresholds. In addition to getting pacing context from the individual metric, business users can now ask questions and get responses, enriched with these insights.
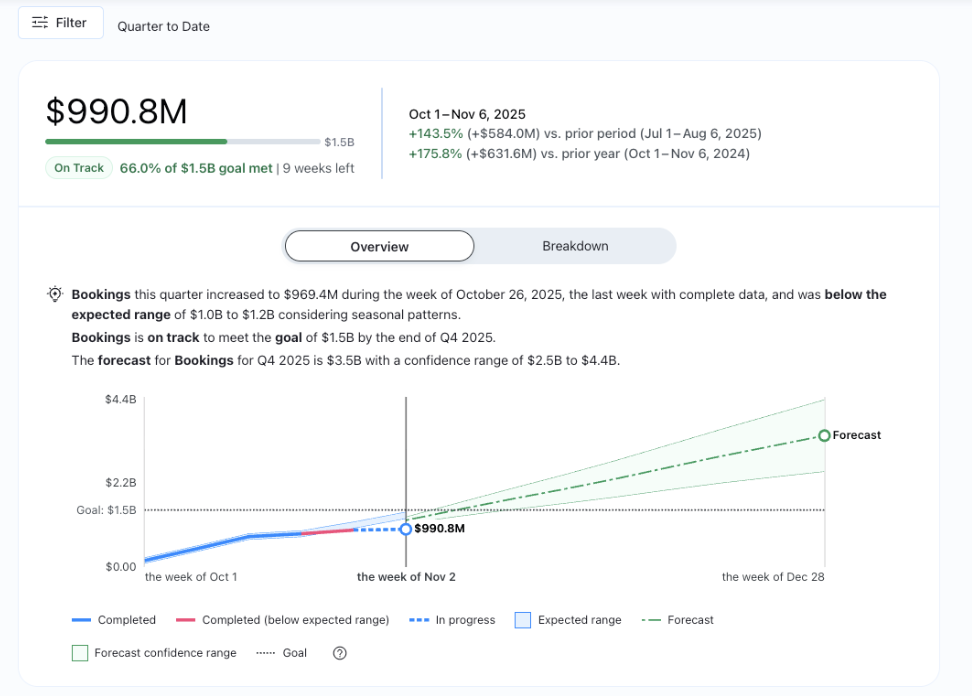
Tableau Pulse: Pace to Goal Insight
Instantly determine whether a Tableau Pulse metric is on pace to meet a set goal by the end of the period. When users click into the metric details, they will see the metric labeled as either 'On Track' (in green) or 'Off Track' (in red). At the chart level, users get a written progress summary and the explanatory chart, color coded to indicate pacing status. With this additional insight, business users can better prioritize their time and make smarter decisions, faster.
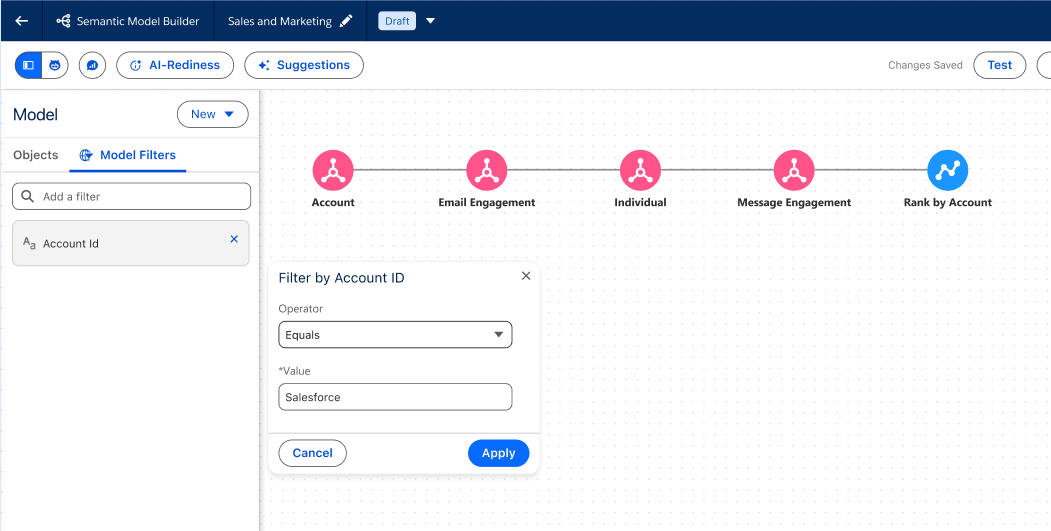
Tableau Next: Semantic Model Global Filter
Apply a wide, consistent filter directly to your entire semantic model, limiting the scope of all returned data for universal consistency. This reduces repetitive setup of the same filter logic across different definitions and ensures users only see relevant, authorized data.
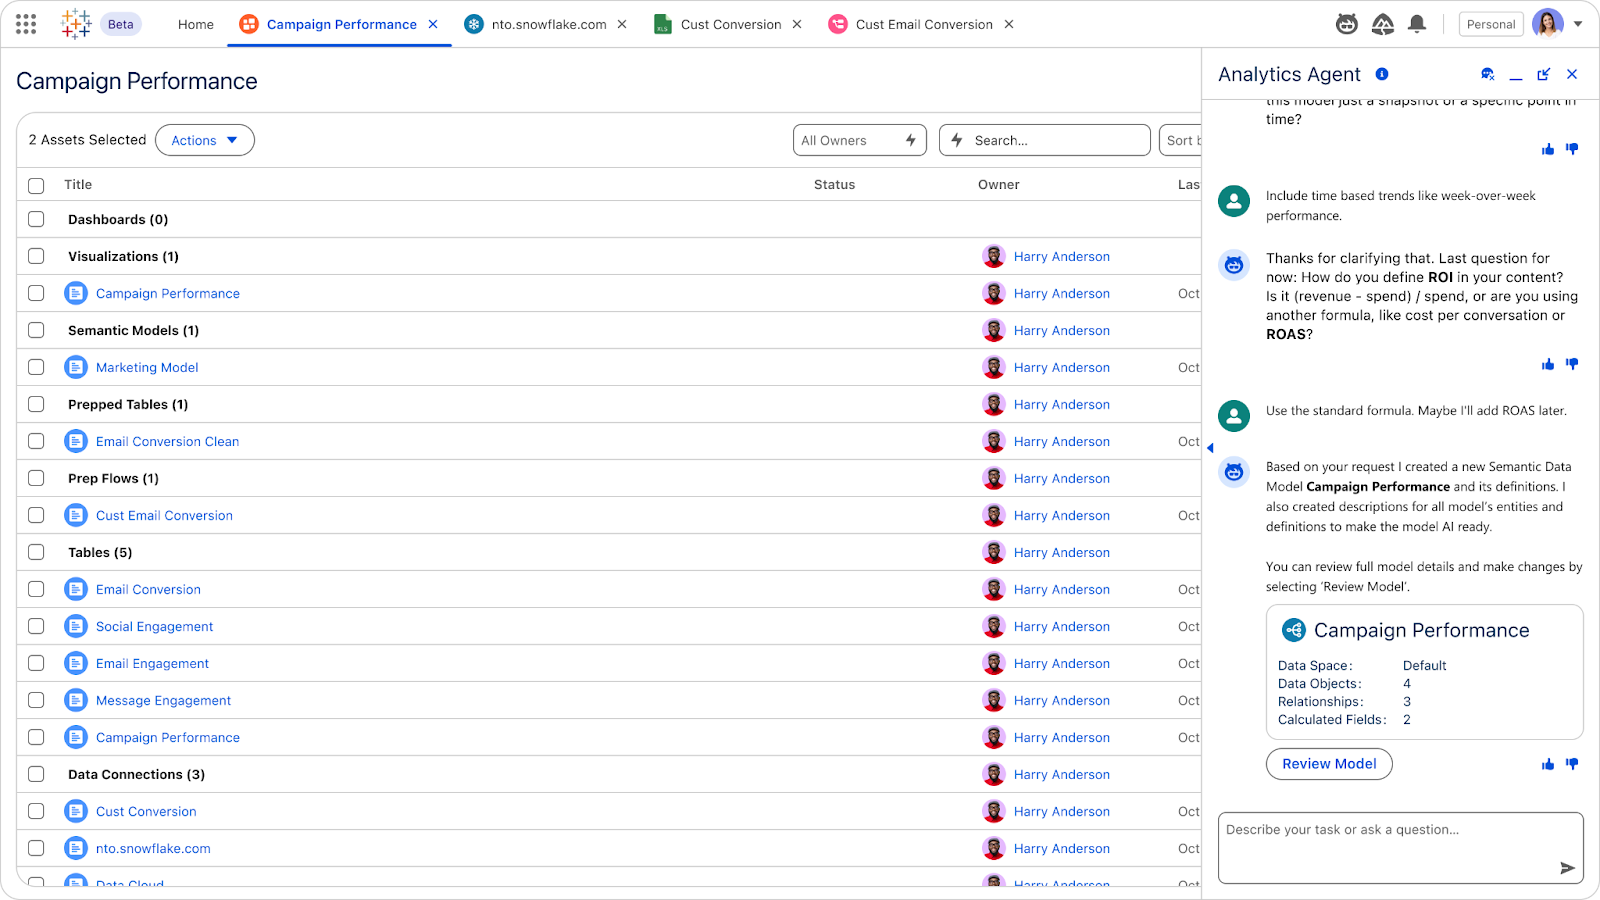
Tableau Next: Create Semantic Data Model
Automatically generate a tailored semantic model based on a business goal, complete with relevant objects, relationships, and calculated fields. This accelerates semantic model creation and prepares your models to be AI-ready.
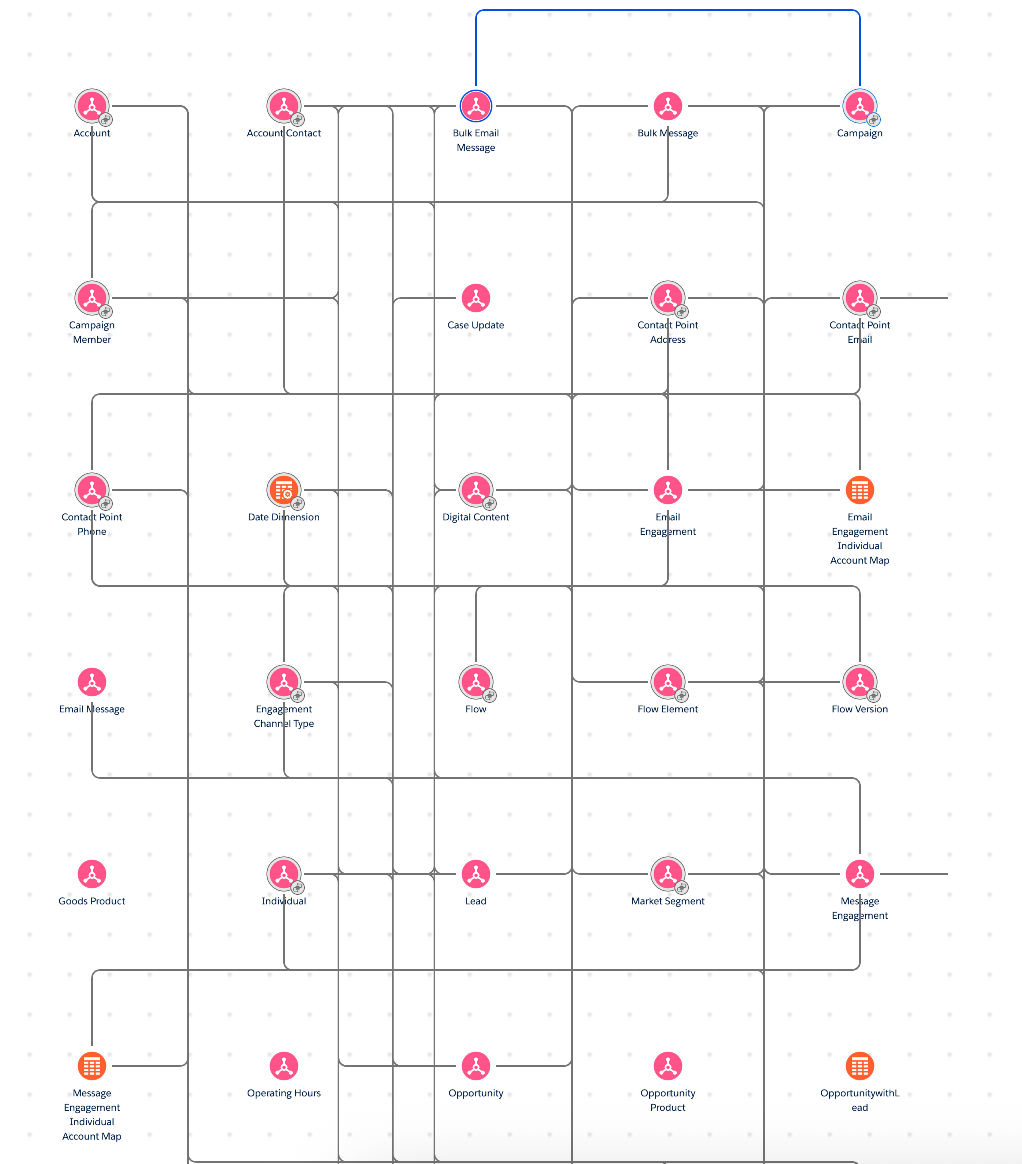
Tableau Next: C360 Semantic Model Support
Empower customers with trusted, cross-cloud insights. Ask natural language questions about data in the C360 semantic data model to gain trusted, cross-cloud insights.

Tableau Next: Q&A Calibration
Improve your agent's accuracy on analytics questions with Q&A Calibration. Test responses against a set of questions, classify them as accurate or inaccurate, and apply guided suggestions to calibrate and verify answers.
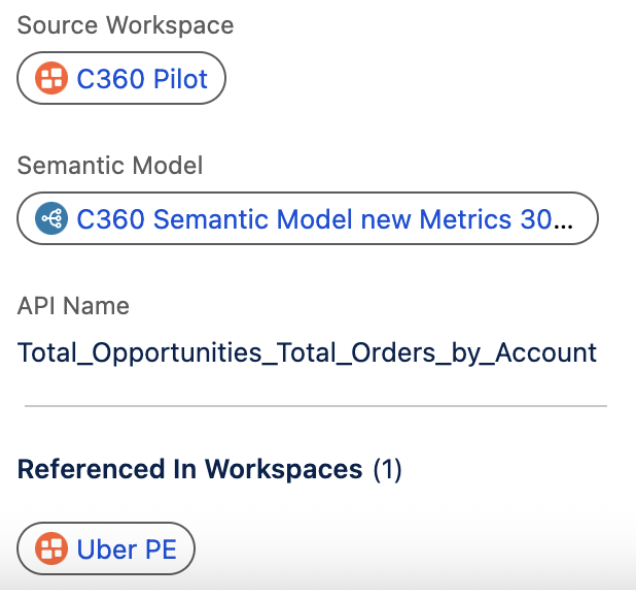
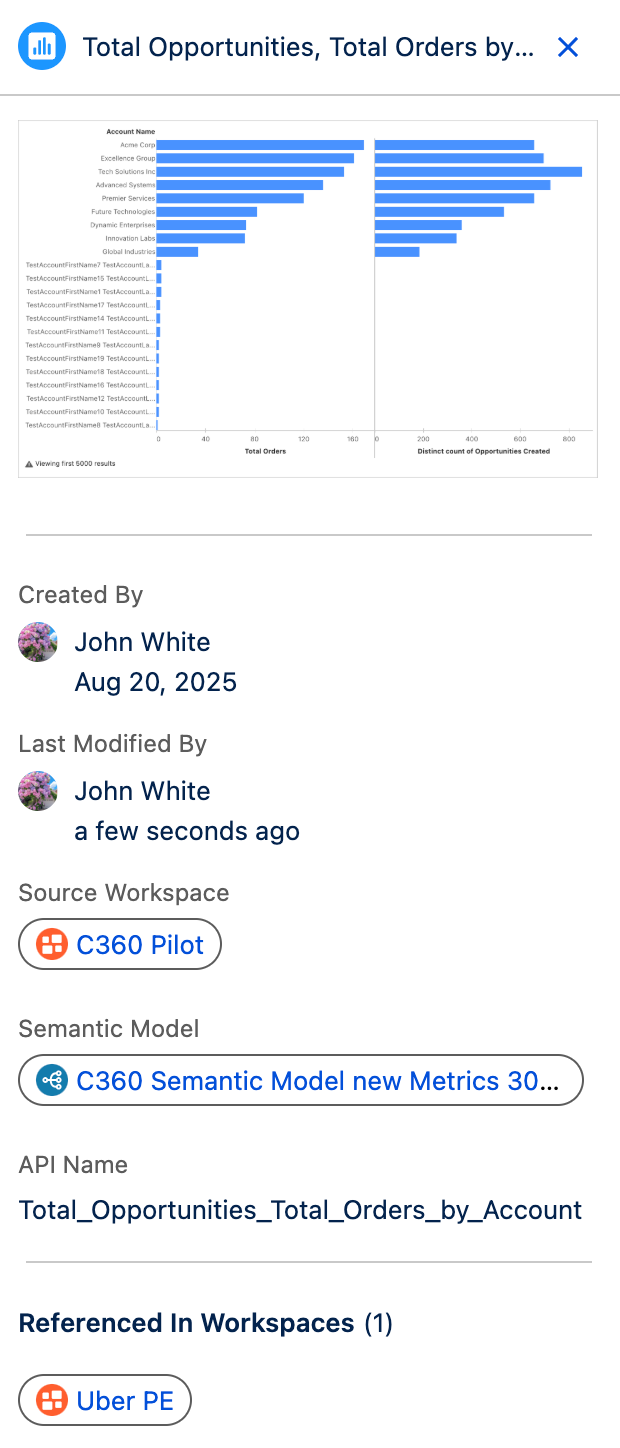
Tableau Next: Asset Details
Assess asset usage and context within your organization's ecosystem without needing to open it. View assets such as thumbnails, workspaces, and semantic models directly in the Detail Panel. This brings clarity into how assets are being used and leveraged in the flow of work.
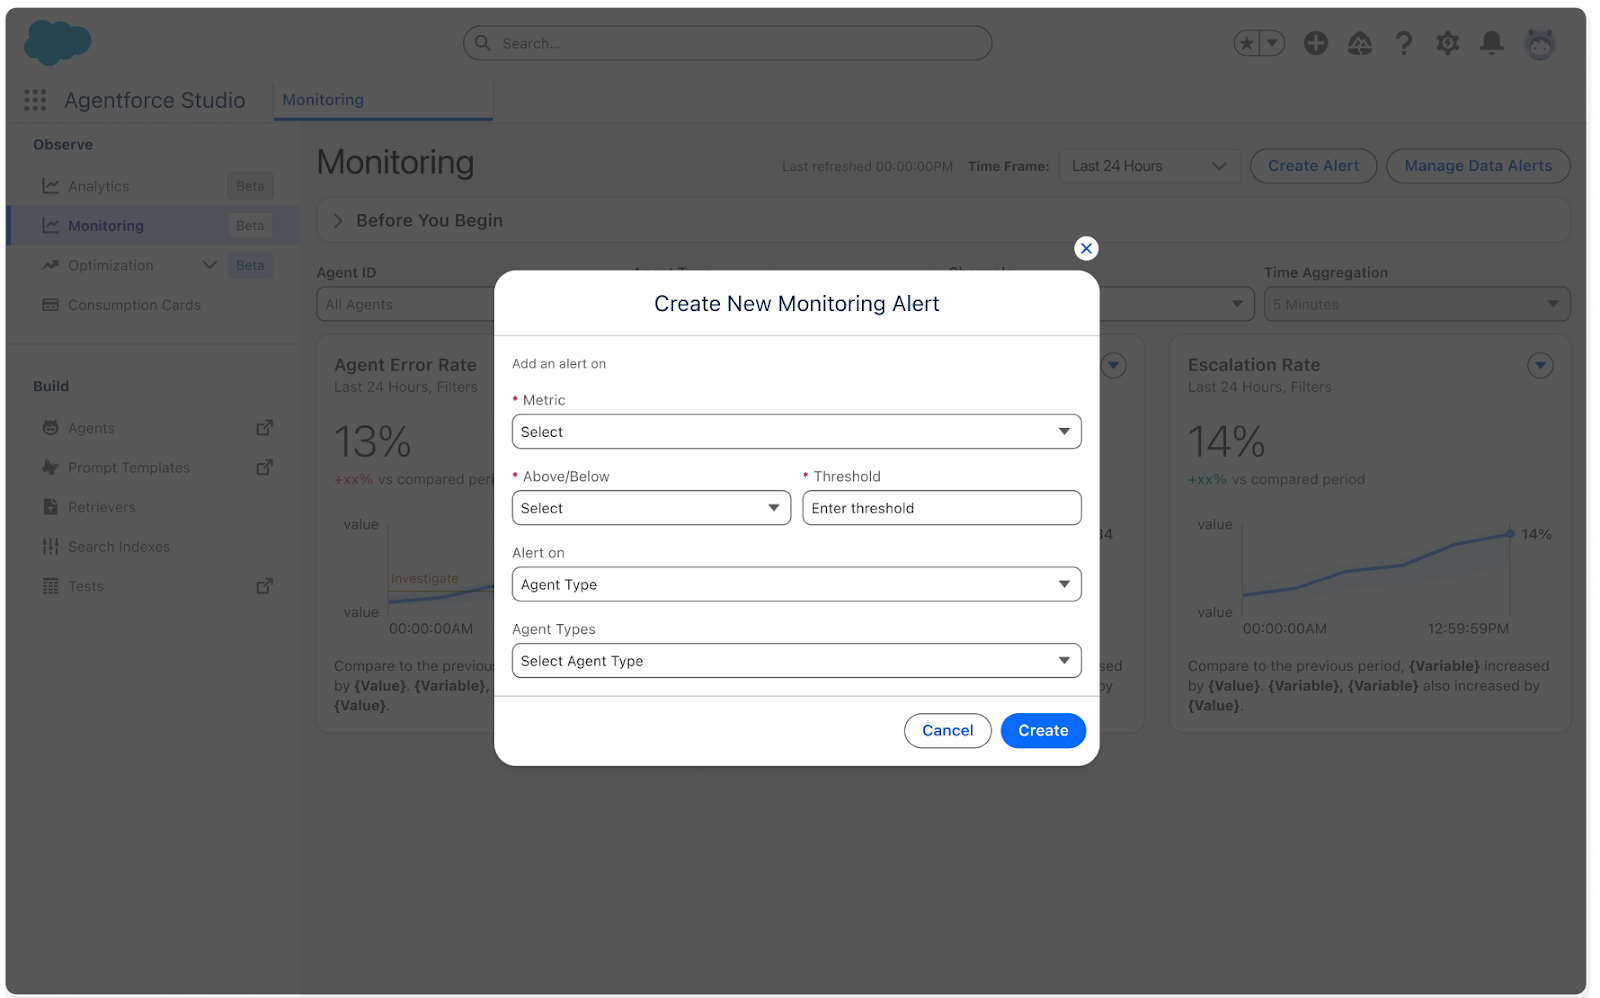
Tableau Next: Agent Performance Alerts
Gain near real-time visibility and trust signals on your deployed AI agents through proactive data alerts on agent performance. Set alerts and receive notifications to get ahead of potential agent issues.
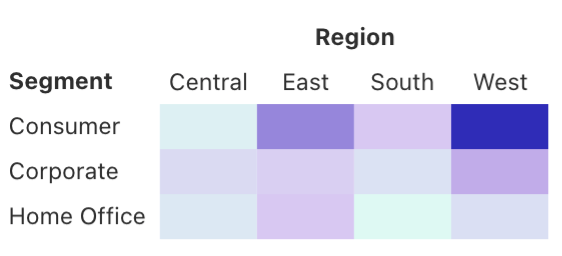
Tableau Next: Heat Map
Find relationships and hotspots in your data. Heat Map visualiations make it easier to spot complex patterns and gain a deeper understanding of your data.
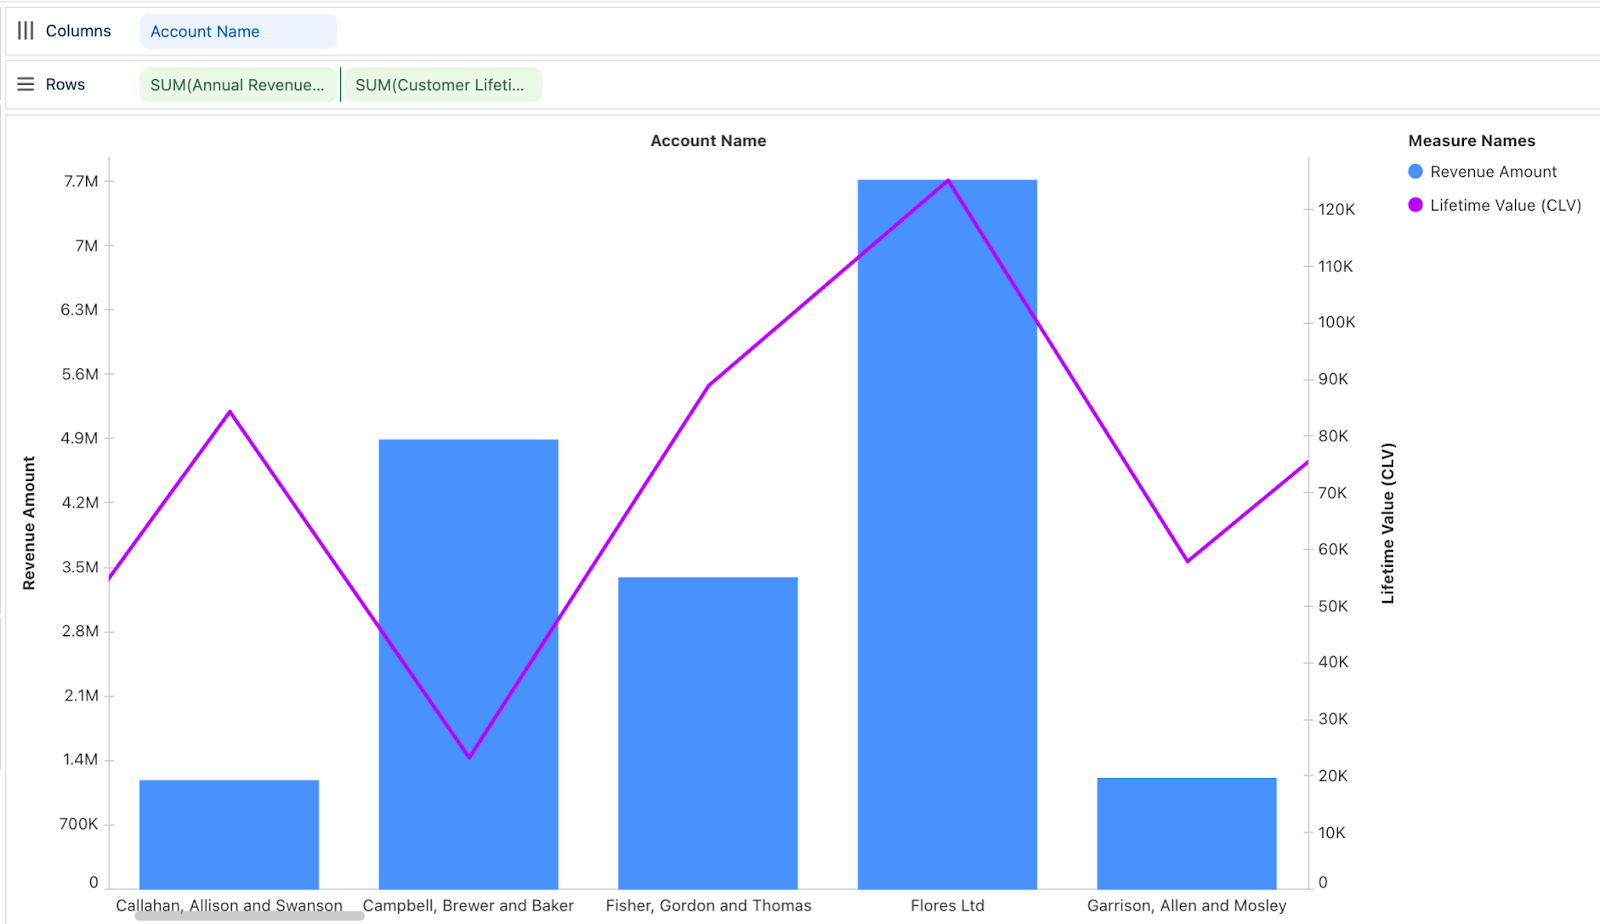
Tableau Next: Dual and Sync Axis
Compare two different measures on the same chart using different Mark Types. Visually analyze the correlation between metrics in a single view for better understanding.
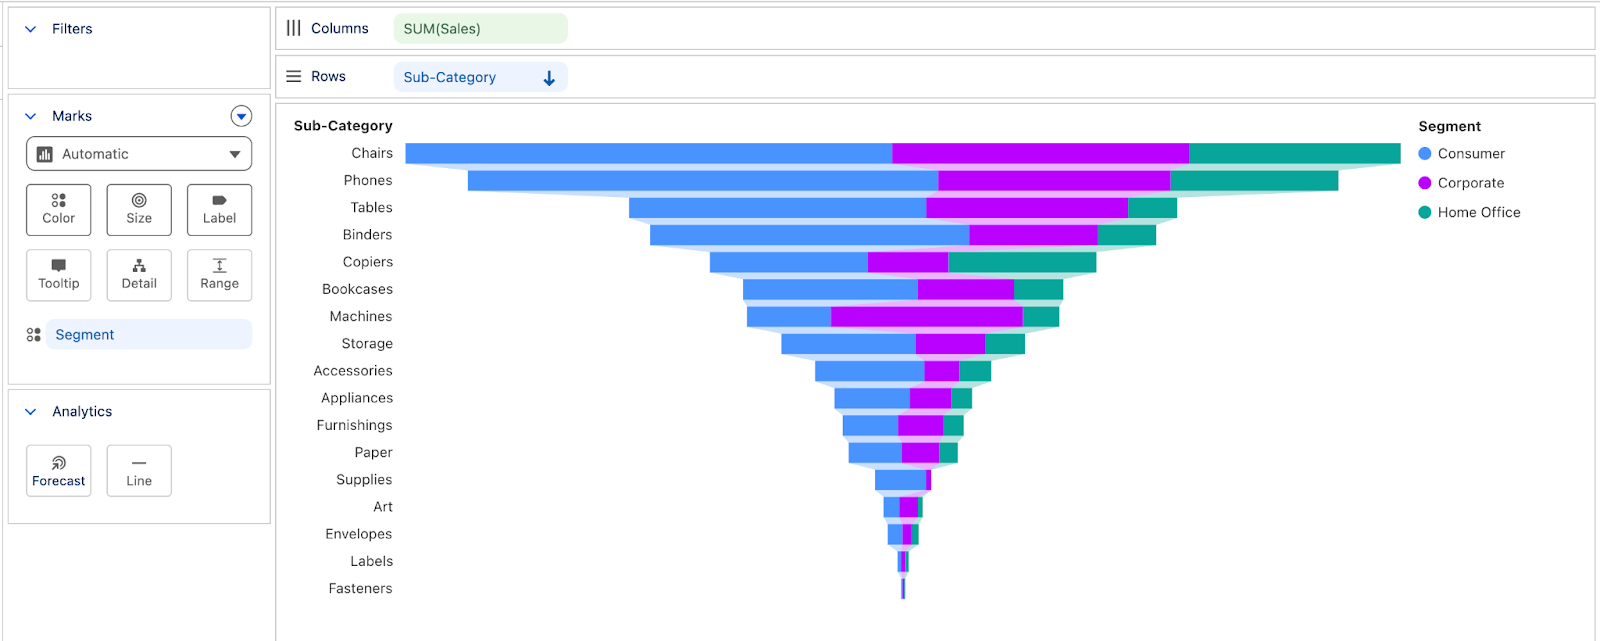
Tableau Next: Funnel Chart
Clearly track conversion rates to easily identify and address customer drop-off points. This enhanced visualization enables users to optimize specific business processes and address key challenges.
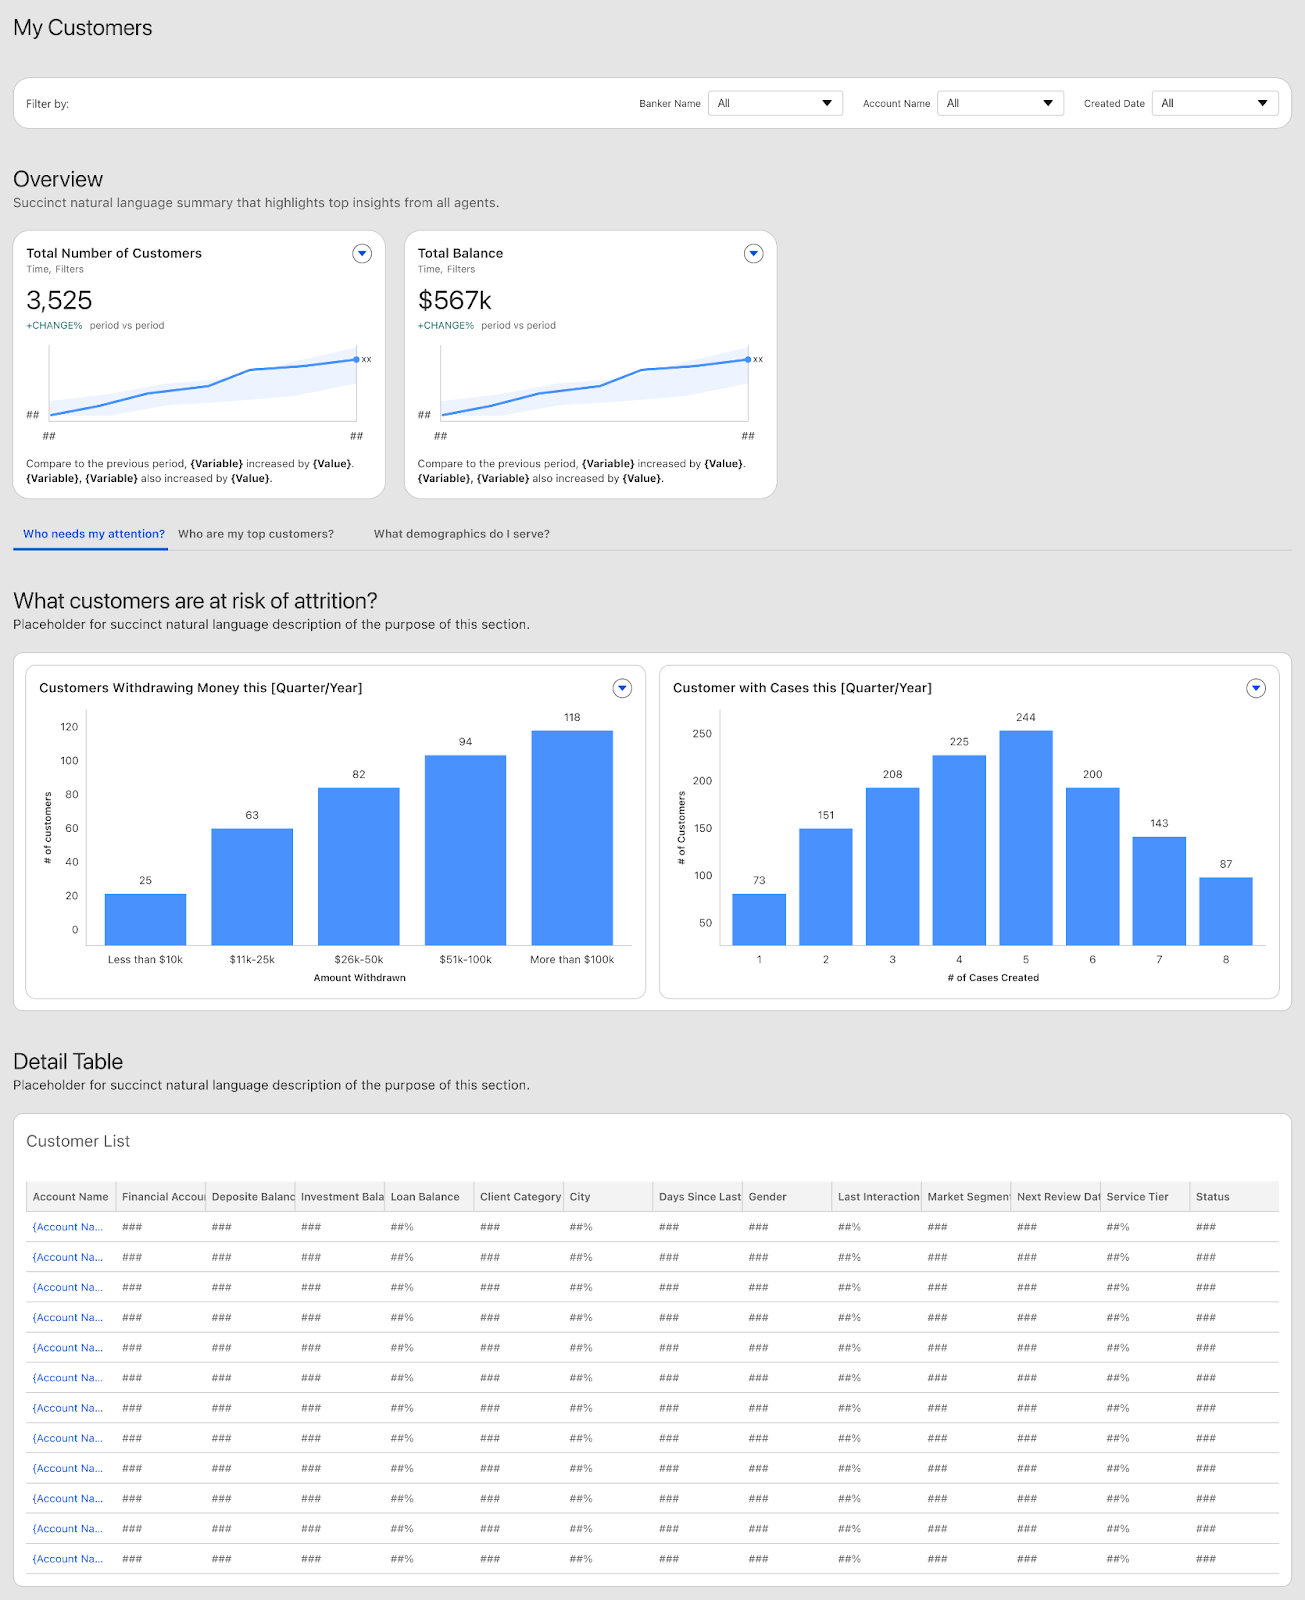
Tableau Next: Financial Services Insights App
Leverage this pre-built app for Salesforce to empower your branch managers and retail bankers with insights to build the banking business. Increase referral conversions, accelerate loan applications, and build customer retention.
Tableau Next: Productivity Shortcuts
Increase your authoring efficiency with new productivity shortcuts. Double-click data fields to quickly add them to your visualization and hide or show labels from the Toolbar. These shortcuts enables you to quickly create new vizzes and explore your data more efficiently.
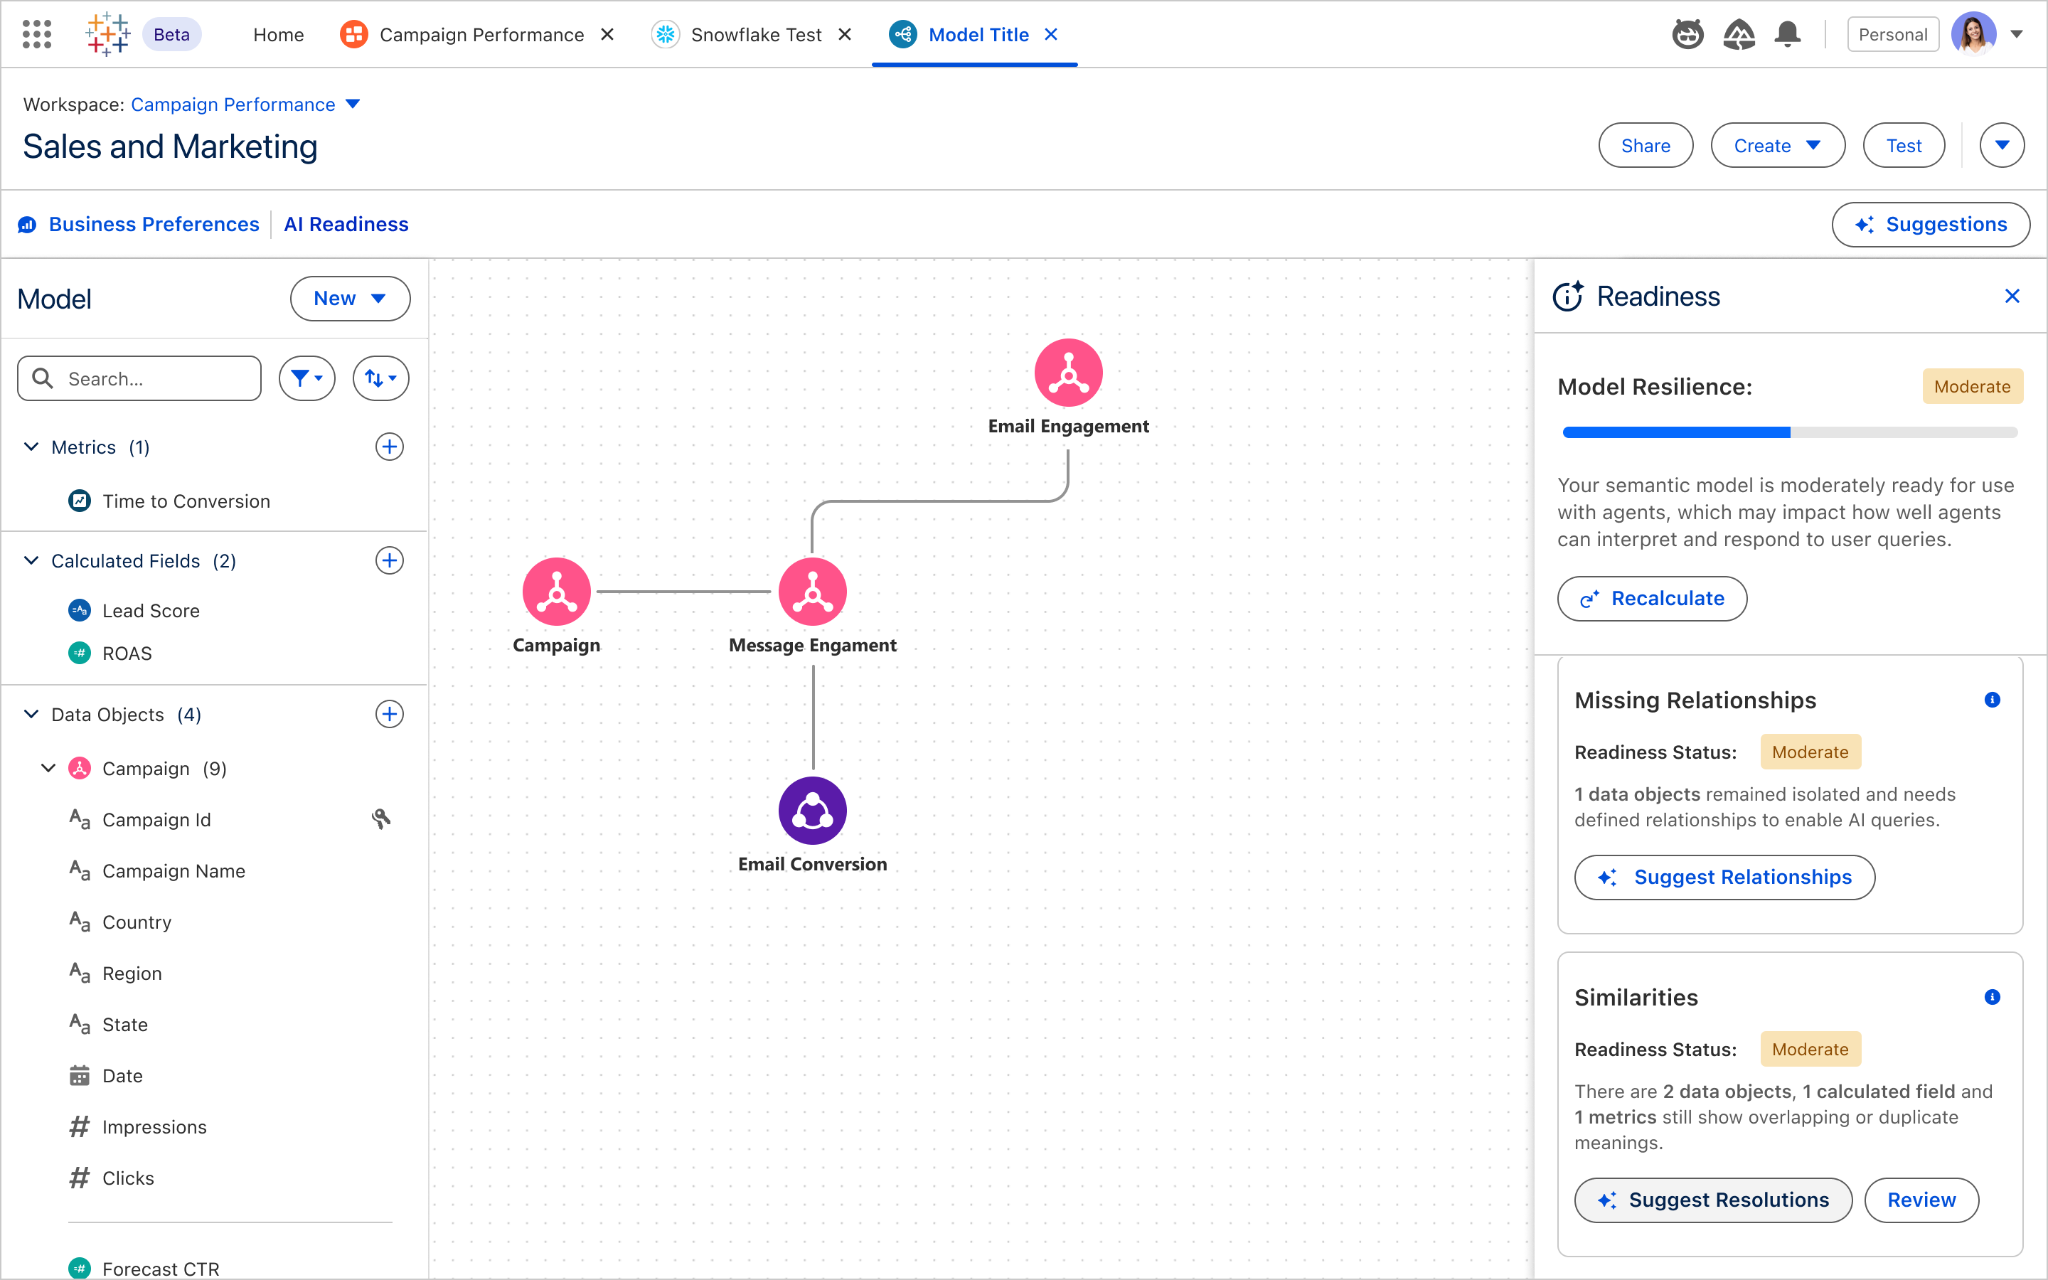

Tableau Next: Semantic Model AI Optimization
Optimize your semantic model for better agent performance with Semantic Model AI Optimization in Tableau Semantics. Get a health score along with AI-powered suggestions, ensuring agents interpret and respond to your queries more accurately.
Now available in Beta.