DataFam Roundup: June 21 - June 25, 2021


Dig into the latest DataFam Roundup—a weekly blog that brings together community content all in one post. As always, we invite you to send us your content—and the DataFam content from your peers that have inspired you! Find the content submission form here.
Celebrating Pride Month
Pride Month is a celebration of the impact that the LGBTQ+ community has had on making this world a better place. We are thrilled to be launching a new Pride exhibition in the Tableau Public Viz Gallery during the month of June - we hope you’ll take the time to explore the gallery and walk away feeling like you learned something new. Check out all the featured authors in this exhibit here.
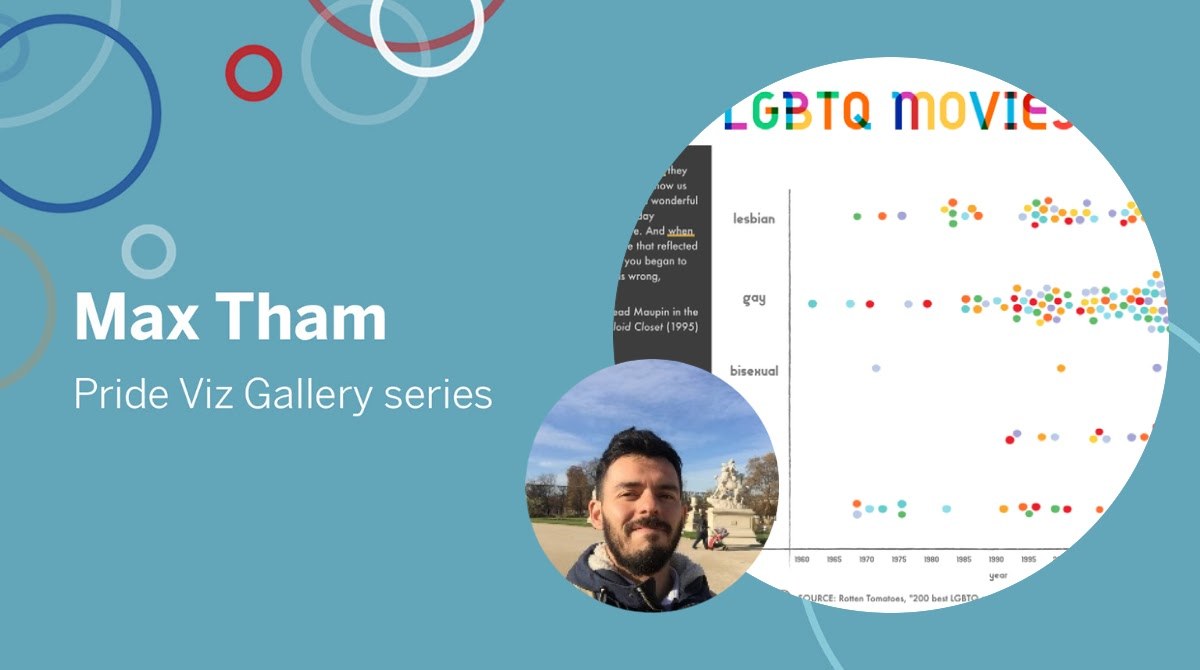
Learn more about Max Tham, his visualization ‘Top 200 LGBTQ Movies’ and his experiences with the Tableau Community in this featured blog post.
DataFam content
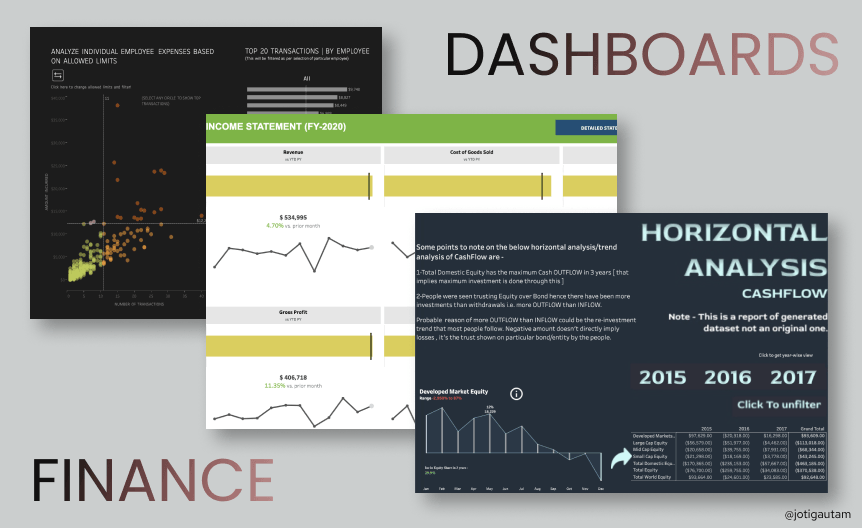
#triochallenge Week 7 — Finance Dashboards Joti Gautam
Dive into content created by the Tableau Community:
- Zach Bowders: Data + Love: Jim Dehner
- Mark Bradbourne w/ Zach Bowders: Inside the Analyst's Cubicle
- Priyanka Dobhal: 10 things in Tableau that I wish I knew earlier
- Dave Andrade: Peloton
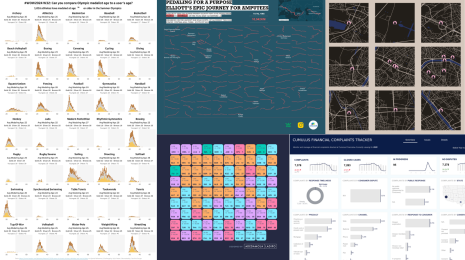
- Rajeev Pandey, Vizartpandey: How To Create a Normal Distribution Curve Within Tableau
- Joshua Feldman: How to query Wikidata from Observable
- Anthony B. Smoak: Stacked Bar Chart with Dynamic Totals in Tableau
- Heidi Kalbe, Queen of Data: Sorting a bar chart with multiple rows and columns
- Ken Flerlage, The Flerlage Twins: QGIS for Tableau Users # 2: Bending Text Files to Your Will!
- Dahee Lee, Tableau Wiki: Tabpy (Tableau X Python) 활용하여 BTS 곡 분석해보기 (Korean)
- Robert Crocker, Viz Simply: How to Create a Side Nav for your Tableau Portal with React
- Steve Adams: Building insightful dashboards and increasing productivity, with Tableau Training on Tap
- Joti Gautam: #triochallenge Week 7 — Finance Dashboards
- Andy Kirk, Visualising Data: Best of Visualisation Web...Feb 2021
- Laura Ellis, Little Miss Data: 3 Reasons Why You Should Pre-Sketch Your Data Visualizations
- Elliot Stam: Publish Tableau workbooks using the REST API and tableau-api-lib
- Heidi Kalbe, Queen of Data: Stop Tableau from destroying your dashboard layouts
- Dilyana Bossenz: Gesetze zur Gestaltung der visuellen Wahrnehmung (German)
- Nick Desbarats, Practical Reporting: My Dashboard Users Don’t Even Know What They Want!
- Rajeev Pandey, Vizart Pandey: Write to Google BigQuery Using Tableau Prep
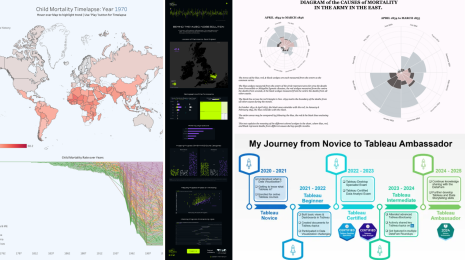
- Tableau Ambassador Spotlight | Graham Keller
Upcoming events
Check out all the virtual Tableau User Group events here and catch up on this past week's Tableau User Group Weekly: June 21 - June 25, 2021—a weekly blog series highlighting the latest Tableau User Group events around the world.
June 21 - 25 Iron Viz Feedback 10 Tableau Community members have teamed up to provide support for participants entering into the Iron Viz qualifer contest. Read more about it here and sign up for a 15 minute meeting slot here.
Vizzes
Catch this week’s Viz of the Days here and subscribe to get them emailed directly to your inbox.
Check out some inspirational vizzes created by the community:
- Sarah Battersby: Lego World Map...In Tableau
-
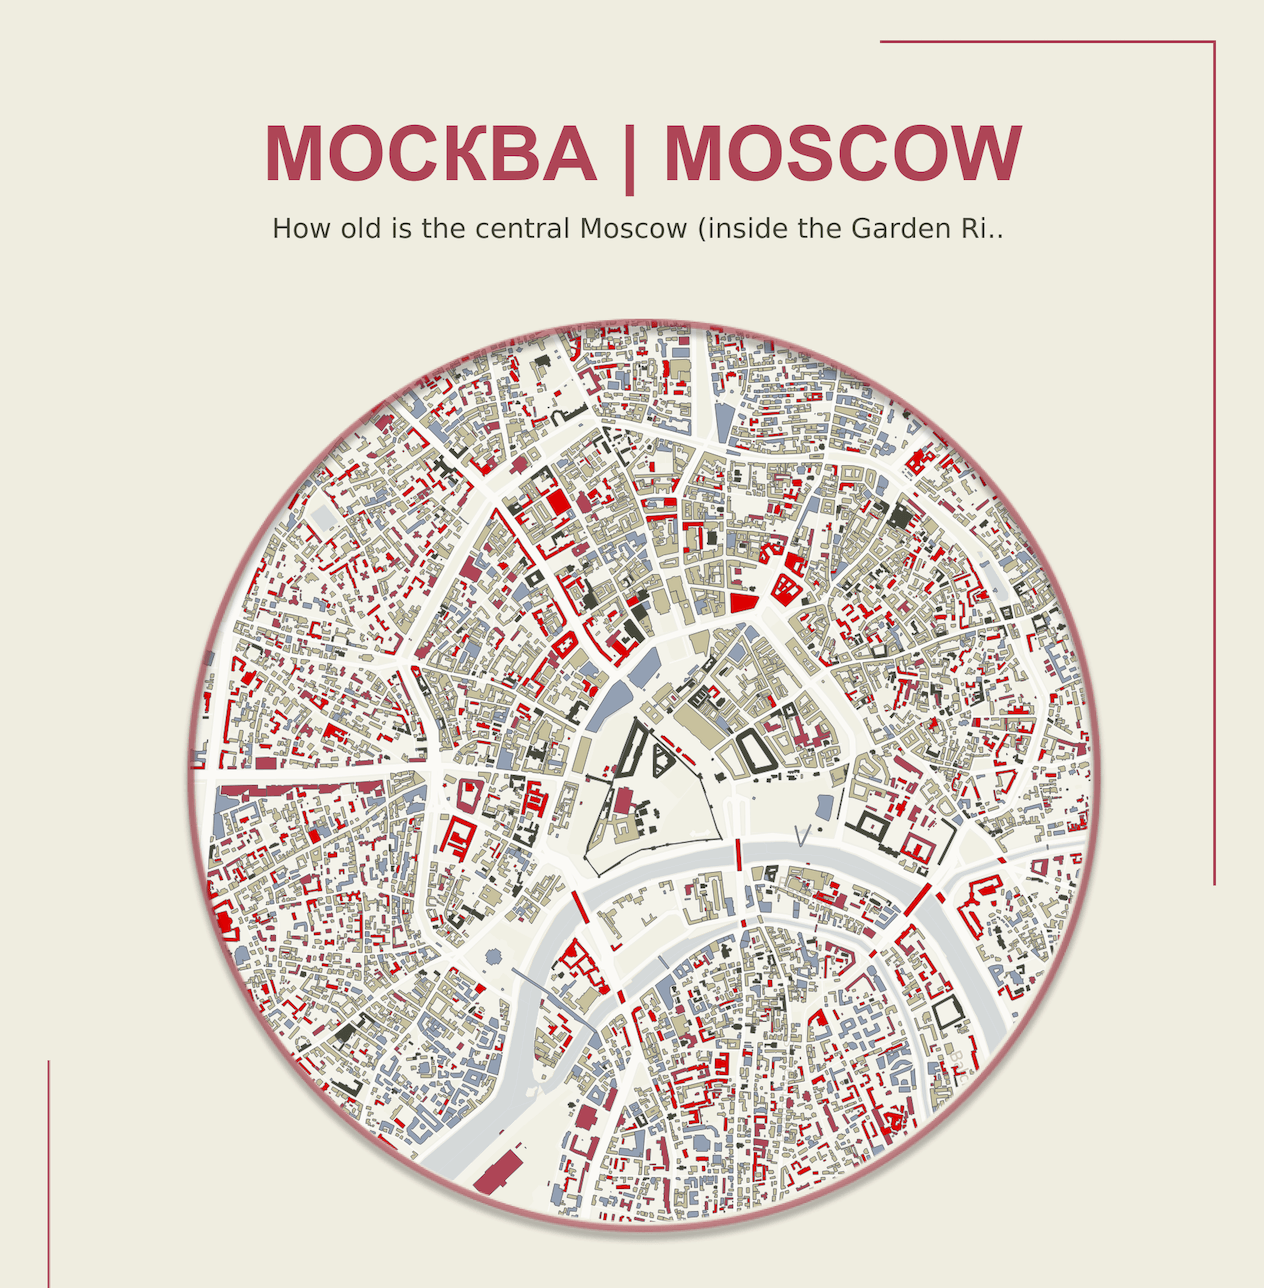
Anastasiia Komissarova: Central Moscow | Buildings Ag
-
Nir Smilga: Israel PMs: Timeline of Events
-
George Koursaros: How old are buildings in New York City?

Makeover Monday
Join the community every Monday to work with a given data set and create better, more effective visualizations.
Web: Makeover Monday
Twitter: #MakeoverMonday
Week 24: What Schools Create the Most Student Loans in the U.S.?
Workout Wednesday
Build your skills with a weekly challenge to re-create an interactive data visualization.
Web: Workout Wednesday
Twitter: #WOW2021
Week 24: Can you visualise the Cholera Outbreak?
Sports Viz Sunday
Create and share data visualizations using rich, sports-themed data sets in a monthly challenge.
Web: Sports Viz Sunday
Twitter: #SportsVizSunday
June 2021: Football European Championships
Iron Quest
Practice data sourcing, preparation, and visualization skills in a themed monthly challenge.
Web: Iron Quest
Twitter: #IronQuest
Storytelling with Data
Practice data visualization and storytelling skills by participating in monthly challenges and exercises.
Web: Storytelling with Data
Twitter: #SWDChallenge
June 2021 2021: reading into red
Project Health Viz
Uncover new stories by visualizing healthcare data sets provided each month.
Web: Project Health Viz
Twitter: #ProjectHealthViz
May 2021: Registered Nursing Labor Stats (1998-2020)
SDG Viz Project
Visualize data about Sustainable Development Goals provided by the World Health Organization.
Web: SDG Viz Project
Twitter: #TheSDGVizProject
Goal 16: Peace, Justice, and Strong Institutions
Preppin' Data
A weekly challenge to help you learn to prepare data and use Tableau Prep.
Web: Preppin’ Data
Twitter: #PreppinData
Week 24: C&BS Co Absence Monitoring
Real World Fake Data
Create business dashboards using provided data sets for various industries and departments.
Web: Real World Fake Data
Twitter: #RWFD
Dataset #11: Hospitality
Viz 2 Educate
Each month, create vizzes on global education syllabus topics as resources for teachers worldwide.
Web: Viz 2 Educate
Twitter: #Viz2educate
Diversity in Data
An initiative centered around diversity, equity & awareness by visualizing provided datasets each month.
Web: Diversity in Data
Twitter: #DiversityinData
June 2021: Pride Month
Viz for Social Good
Volunteer to design data visualizations that help nonprofits harness the power of data for social change.
Web: Viz for Social Good
Twitter: #VizforSocialGood
Related Stories
DataFam Roundup: September 9-13, 2024
 September 13, 2024
DataFam Roundup: September 2-6, 2024
September 6, 2024
DataFam Roundup: August 26-30, 2024
August 30, 2024
Subscribe to our blog
Get the latest Tableau updates in your inbox.