DataFam Roundup: May 20–24, 2024


Welcome! Dig into this week's DataFam Roundup—a weekly blog that brings together community content all in one post. As always, we invite you to send us your content—and the DataFam content from your peers that have inspired you! Find the content submission form here.
Community Highlight
To recognize new and consistent Tableau contributors—we’re excited to have a section within the weekly DataFam Roundup called the Tableau Community Highlight. Find out how to get involved.

Mesum Raza Hemani, VP of BI @ NBP Fund Management Limited & Karachi AI Founder
Karachi, Pakistan
Mesum Raza Hemani is a leader in the AI and ML space in Pakistan. He was introduced to Tableau through Tableau Public and developed an interest in specialization through a Tableau course. He attributes his learning to hands-on challenges such as Makeover Monday. He is now involved in the Karachi Tableau User Group and actively creates Tableau content on YouTube as well as his blog.
On his YouTube channel, Mesum creates and shares Tableau content with the goal of empowering more people to explore the power of data analytics. His content is especially niche as it is in Hindi and Urdu in order to enable more users in-region. Some of his latest creations have been recapping Tableau Conference 2024, feature tutorials, and data career counseling.
Connect with Mesum on Linkedin, X, Tableau Public, his YouTube channel, and his blog.
DataFam content
Dive into content created by the Tableau Community:
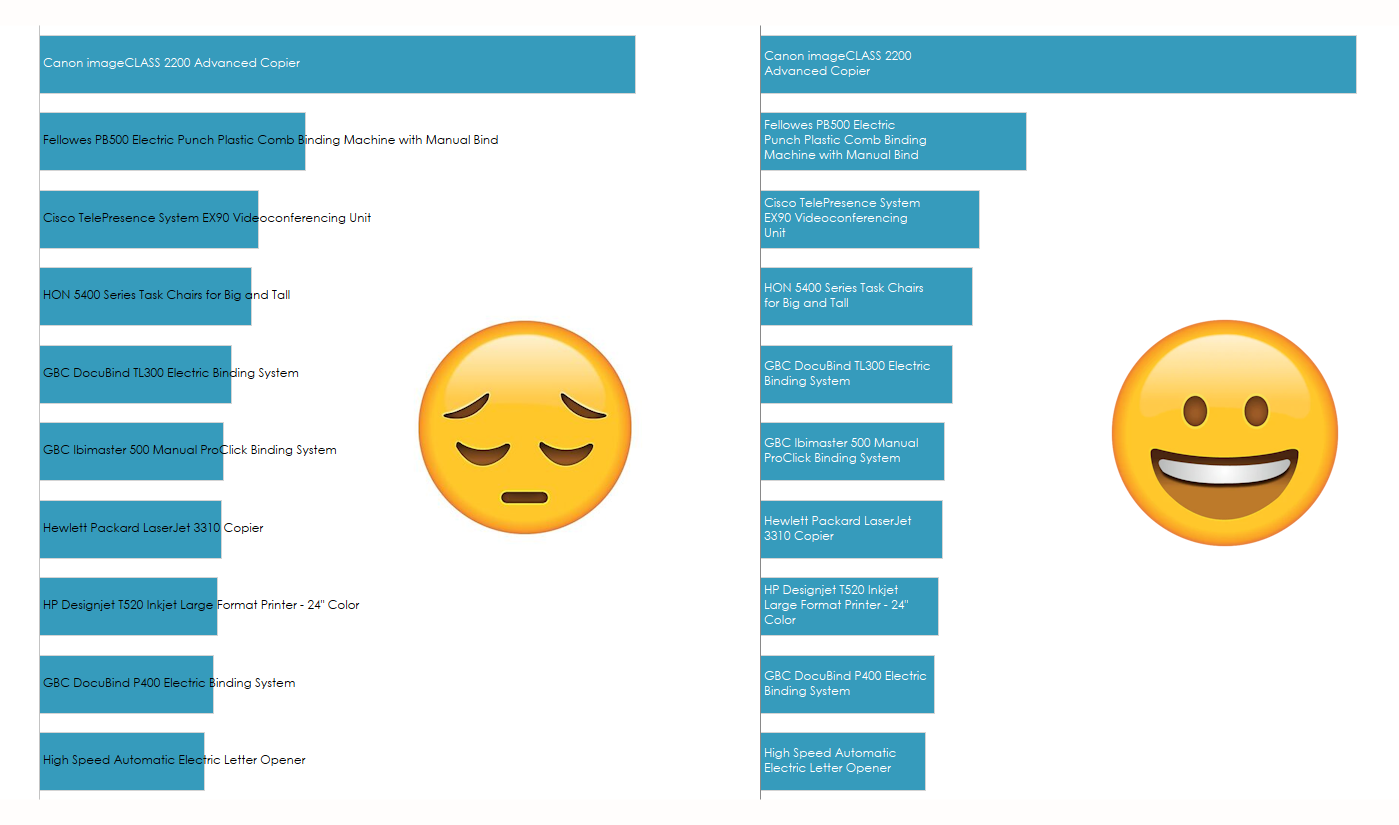
Ken Flerlage, The Flerlage Twins: Force That Text to Wrap in Tableau
-
Alexander Mou: Visible Difference, Creating Pareto Chart Multiples in Tableau
-
Ivett Kovács: The ASCII function in Tableau returns the ASCII code of the first character of a string.
-
Ken Flerlage, The Flerlage Twins: Force That Text to Wrap in Tableau
-
Brittany Rosenau: Visualize Tableau Conference: Results of the #Data24 Step Tracker Survey
-
Kira Wetzel, The Data Leadership Collaborative: Driving Greater Innovation through Broader Representation in Product Development
-
Takuya Kohama: Implementing IRR (Internal Rate of Return) with Tabpy
- Will Sutton, Suno: Why'd you have to go and make your viz so complicated?
- George Gorczynski: Understand Tableau INDEX function!
-
Prasann Prem: Tableau Buddy YouTube Channel
Team Tableau
Upcoming events and community participation
-
Lights, Camera, Action: Tableau and IMDb Launch Data Visualization Campaign for Movie Lovers
-
DataFam Birthday Roundup! In the effort of continuing support for one another, we thought it would be fun to gather data on DataFam birthdays! If you're willing, could you let us know which day you celebrate your birthday? Just go ahead and pick the day from this year's calendar, since it's a leap year and all possible days are available to choose from!
-
Mentorship Program by the Data Visualization Society
-
Women in Dataviz Virtual Coffee Breaks: Held every sixth Thursday morning and every sixth Wednesday afternoon in the EST time zone, Virtual Coffee Breaks are a casual networking event. Feel free to drop in and out as you need toduring the hour, and stay for as little time or as long as you want.
Vizzes
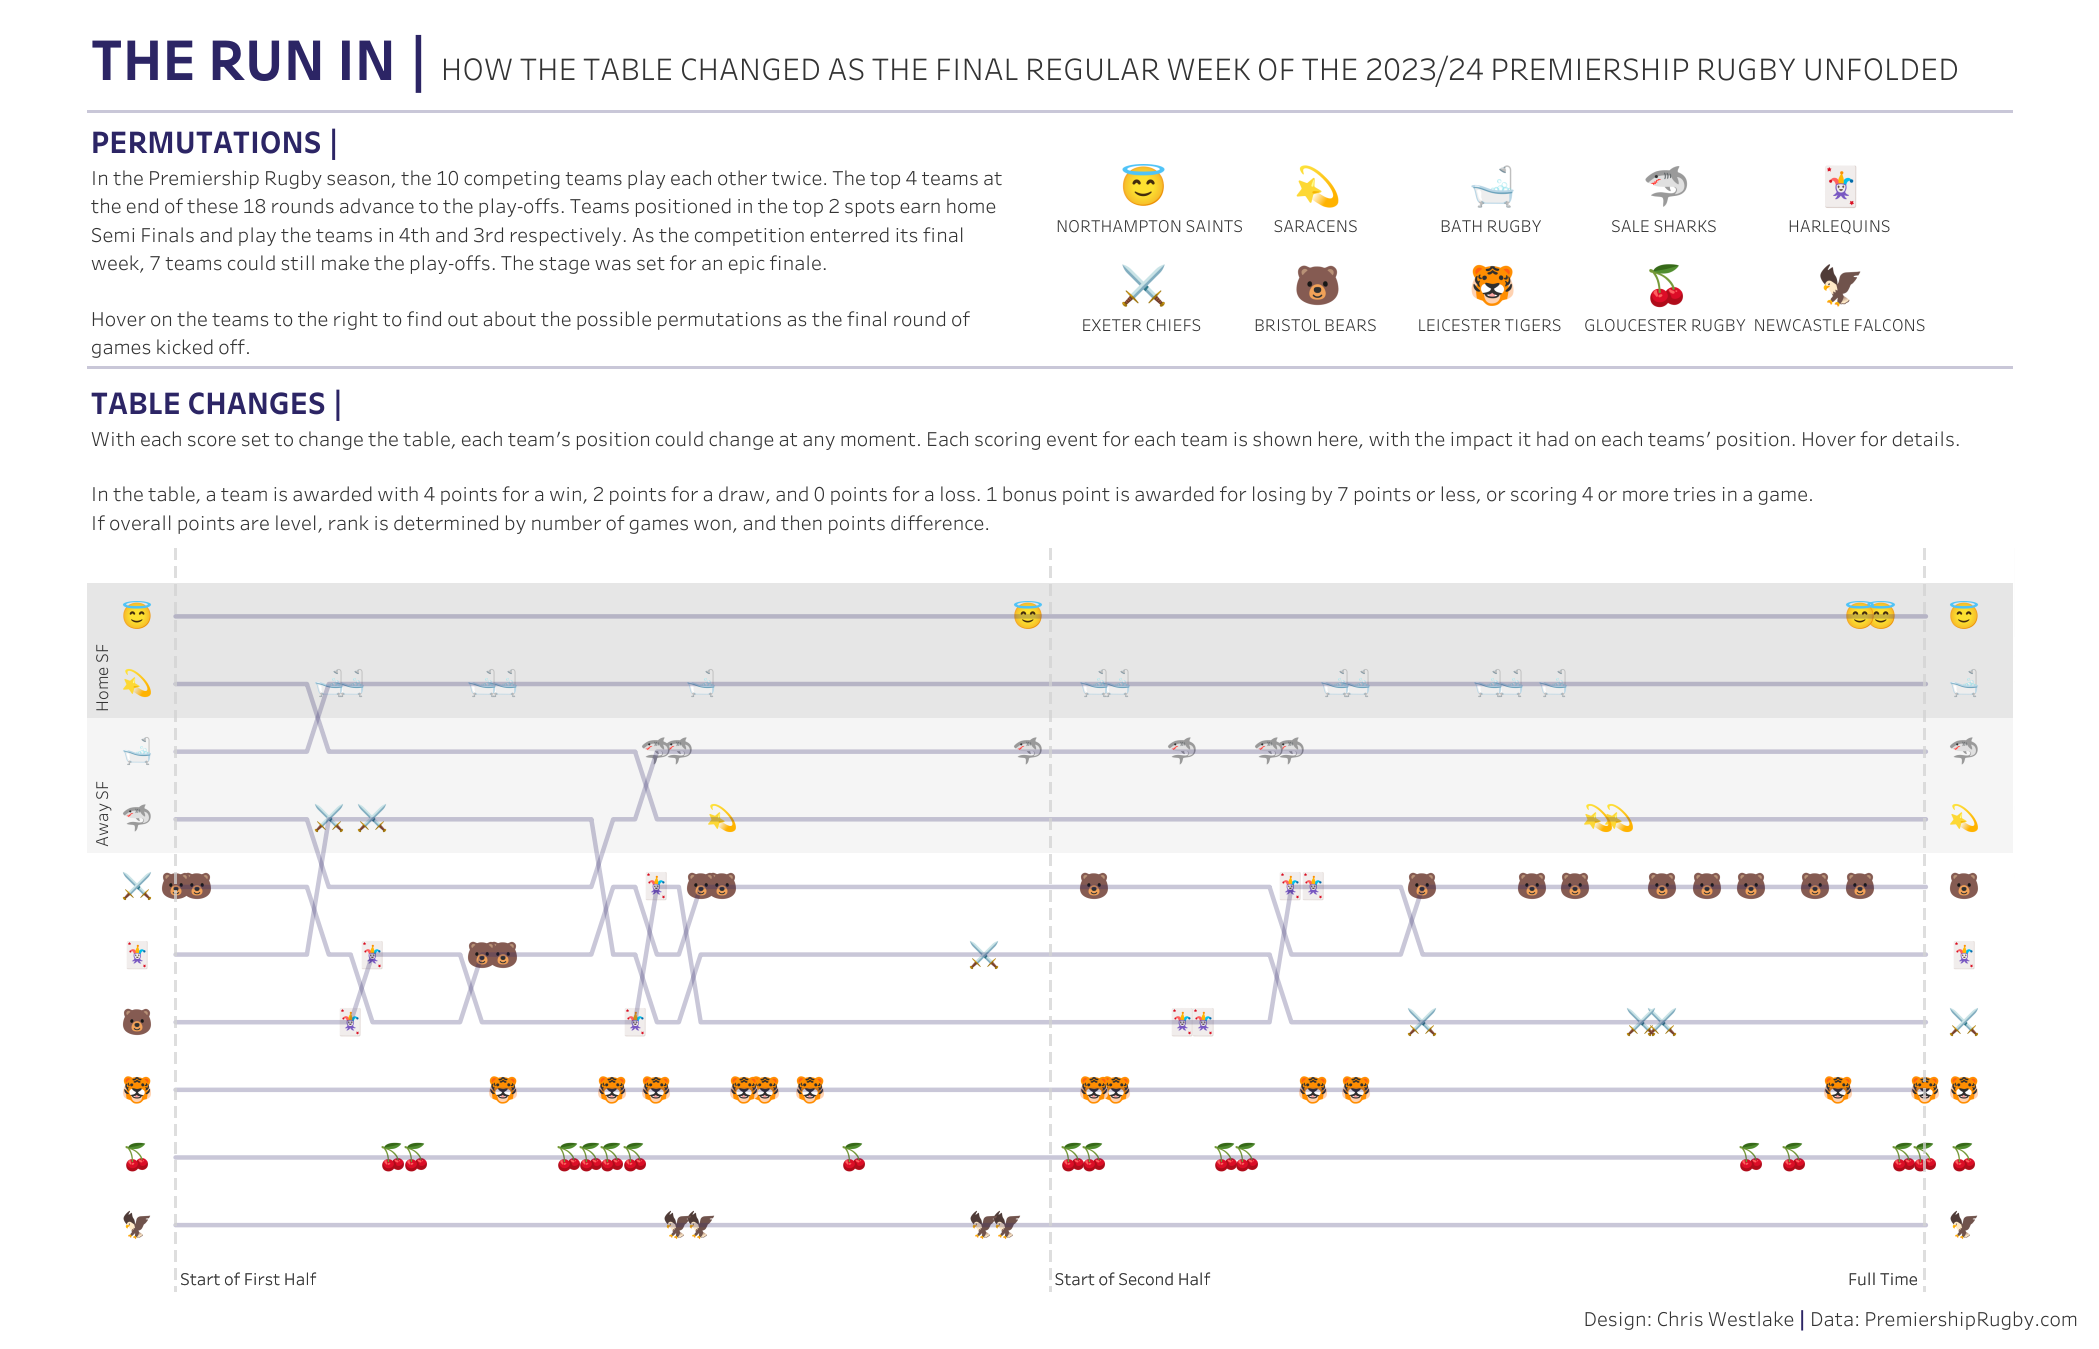
Chris Westlake: The Run In | Premiership Rugby Game 18
See the latest Viz of the Day, trending vizzes, featured authors, and more on Tableau Public.
Check out some inspirational vizzes created by the community:
-
Jenny Martin: Slam Dunk 2024
-
Prasann Prem: CO2 Emission per Capita
-
Alexander Varlamov: NBA Gems
-
Maureen Okonkwo: Optical Reporting Dashboard
-
Jonathan Akpogbo Chris: Top 50 highest paid Athletes in 2023 #MakeOverMonday #Sports
-
Neil Richards: Meldrew Point
-
Gbolahan Adebayo: Marketing Campaign Performance Dashboard
-
Chris Westlake: The Run In | Premiership Rugby Game 18
-
Nir Smilga: United by Music or Divided by Politics
-
Agata Ketterick: Access to Safe Drinking Water
-
Chasoso (Hideaki Yamamoto): #MoM 2024 Week 21 | The French are losing hope for Paris 2024
Community Projects
Back 2 Viz Basics
A bi-weekly project helping those who are newer in the community and just starting out with Tableau. Not limited just to newbies!
Web: Back 2 Viz Basics
Twitter: #B2VB
Week 10: Build a Heat Map
Workout Wednesday
Build your skills with a weekly challenge to re-create an interactive data visualization.
Web: Workout Wednesday
Twitter: #WOW2022
Week 21: Can you rebuild this tube map?
Preppin' Data
A weekly challenge to help you learn to prepare data and use Tableau Prep.
Web: Preppin’ Data
Twitter: #PreppinData
Week 21: Loyalty Points Percentages
DataFam Con
A monthly challenge covering pop culture and fandoms.
Web: DataFam Con
Twitter: #DataFamCon
March 2024 Challenge: Sports Movies Edition
Makeover Monday
Create business dashboards using provided data sets for various industries and departments.
Web: Makeover Monday
Twitter: #MakeoverMonday
Week 21: French people are losing confidence in the Paris Olympics
EduVizzers
A monthly project connecting real education data with real people.
Web: Eduvizzers
May 2024: FAFSA® Completion by High School and Public School District
Viz for Social Good
Volunteer to design data visualizations that help nonprofits harness the power of data for social change.
Web: Viz for Social Good
Twitter: #VizforSocialGood
May 2 - June 6, 2024: Global Deaf Research Institute
Games Night Viz
A monthly project focusing on using data from your favorite games.
Web: Games Nights Viz
Twitter: #GamesNightViz
Season 2: With great power comes great vizzes
Iron Quest
Practice data sourcing, preparation, and visualization skills in a themed monthly challenge.
Web: Iron Quest
Twitter: #IronQuest
Women
Storytelling with Data
Practice data visualization and storytelling skills by participating in monthly challenges and exercises.
Web: Storytelling with Data
Twitter: #SWDChallenge
April 2024: Napoleon's April
Project Health Viz
Uncover new stories by visualizing healthcare data sets provided each month.
Web: Project Health Viz
Twitter: #ProjectHealthViz
Diversity in Data
An initiative centered around diversity, equity & awareness by visualizing provided datasets each month.
Web: Diversity in Data
Twitter: #DiversityinData
Sports Viz Sunday
Create and share data visualizations using rich, sports-themed data sets in a monthly challenge.
Web: Sports Viz Sunday
Twitter: #SportsVizSunday
Real World Fake Data
Create business dashboards using provided data sets for various industries and departments.
Web: Real World Fake Data
Twitter: #RWFD
2024 - Admin Insights
Data Plus Music
A monthly project visualizing the data behind the music we love!
Web: Data Plus Music
Twitter: #DataPlusMusic
Related Stories

DataFam Roundup June 2026

Tableau Ambassador Nominations and Applications are Open
 June 10, 2026
