
Achieving the “Best Baton Pass,” One Part of the JAL Philosophy, by Expanding Tableau Usage Throughout the Entire Company
Countless Success Stories of Community-based Sharing of Knowledge and Skills!
Background to Implementation
Better Achievement of the “Best Baton Pass” Through Company-wide Tableau Usage
Established in 2011, the JAL Philosophy is the system of values that all employees working with JAL services and products are expected to hold. One part of this JAL Philosophy is to achieve the “Best Baton Pass,” which means the approach of having employees work together across the boundaries separating Group companies, departments, and job types to provide the best and safest air travel to customers.
Although this has spread throughout the company as a “behavioral philosophy,” it is most plainly apparent in activities that utilize Tableau throughout the entire Group and the organizational and personal connections upon which such activities are based. As covered in detail below, Tableau serves as a “shared language” within the JAL Group and its usage has strengthened collaboration between the organization and employees. Various improvements and transformations have been made in operational areas ranging from maintenance to aircraft operation, customer service, and safety and security thanks to data visualization and analysis enabled by Tableau. As the entire JAL Group comes together to fully prepare aircraft for flight, perform safe and comfortable aircraft operation, and provide and sell customized tour packages, the result is a more optimal delivery of the “Best Baton Pass.”
Takashi Yamazaki, a member of the Technology Strategy Group in the IT Planning Dept. of the IT Planning HQ at Japan Airlines Co., Ltd., recounts the expansion of Tableau usage at the company as follows.:
“We started with something called the Data College, which consisted of a small number of volunteers in the Group. This grew into the current organization, DANCU (Data Analytics and Culture Unit), which promotes data-driven management throughout the Group. We also have an internal Tableau user group called “tablab” with over 200 members who provide support to one another, which plays a major role in promoting Tableau use within the Group as a whole.
Why Tableau?
Ease of Use and Easy to Learn and Easy Integration with Systems
We originally used another BI product throughout the JAL Group. However, it had weak visualization features, so every organization and individual therein would have to download the data and analyze/share it via Excel. This apparently meant that multiple people were doing similar tasks at their respective workplaces, so in many cases the work was inefficient and dependent on individual skills.
It was in this context that the time came to renew our internal data analysis infrastructure in the JAL Group. We considered modernizing our BI products as well, before deciding to implement Tableau throughout the company. Satoshi Ganeko is a member of the Quality Control Group in the Operational Safety Promotion Dept. of Japan Airlines Co., Ltd. He described the process that led to the adoption of Tableau as follows:
“I felt that Tableau’s capabilities and latent potential were beyond question, and I had already started using it myself. In reality, there were several other such employees at various organizations in the Group. In other words, the groundwork was already laid for rapidly deploying Tableau in collaboration with other departments,” said Ganeko.
Other reasons he gave for Tableau having been adopted were its high ease of use, hands-on experience leaving the impression that Tableau was a tool that could be adequately learned by users in all organizations, the community and rich abundance of information available on Tableau use, the possibility of deployment using external networks, and the ease of linking Tableau up with various other systems.
I felt that Tableau’s capabilities and latent potential were beyond question, and I had already started using it myself. In reality, there were several other such employees at various organizations in the Group, so the groundwork was already laid for rapid deployment.

Tableau Implementation and Operating Environment/Effects at JAL Group Companies
JAL Engineering Co., Ltd.
Faster Deployment of Airplane Breakdown Prediction Monitoring Tools and Removal of the Reliance on Specific Individuals’ Skills
“At companies throughout the JAL Group, operational improvements are being made that make good use of Tableau to contribute to the ‘Best Baton Pass’. One representative example is the accelerated deployment of airplane breakdown prediction monitoring tools and the removal of the reliance on specific individuals’ skills at JAL Engineering Co., Ltd. Kuniharu Harada is a member of the Reliability Management Group at the Systems Technology Office in the Engineering Dept. of JAL Engineering Co., Ltd. Here, he describes the issues faced by the company prior to Tableau deployment.
“We developed a model to predict airplane breakdowns using flight data and have deployed that for use in monitoring operations. Initially, we used Excel macros to implement the logic we developed, and there were only a few people who knew how to use VBA, so the work tended to be reliant on specific individuals. Design, testing, and revisions all took an extremely long time to do. Other problems were that we weren’t able to do anything complex with Excel graphs, and they were lacking both in terms of aesthetics and interactivity,” said Harada.
Implementing Tableau solved all of those problems. We reduced the number of days needed to implement logic to one-tenth of the time, from roughly ten business days to just one. Moreover, although we have implemented roughly 100 Viz, you don’t need to do any scripting to use Tableau, so anybody can easily maintain the Viz or change requirements.
“Ease-of-use improved dramatically, and we drastically reduced the amount of time between users making decisions based on data and taking action based on that data. In addition, the range of analysis being done has increased now that users are able to do it themselves, and the fact that it is now easier than before to identify some risks is also helping to improve the quality of our equipment,” said Harada.
Building on these results, Makoto Higashijima of the IT Digital Promotion Dept. at JAL Engineering Co. emphasizes the following.
“If all you want to do is create dashboards, anybody can do that, and they can also do it with other tools. However, Tableau enables individual people to analyze data from the specific perspective in which they’re interested and display it as-is on their dashboard, so everyone is able to look at that and compare their current work flow with the ideal work flow to engage in deeper discussions and make improvements. I think the best part of Tableau is its potential to serve as a powerful tool for making operational innovations in this way,” said Higashijima.

Breakdown Prediction
Training Review Planning Office, Japan Airlines Co., Ltd.
Preflight Sharing of Visualizations of Landing Routes
Meanwhile, at the Flight Operations HQ of Japan Airlines Co., Ltd., Tableau is used for preflight sharing of visualizations of landing routes at airports. Airplane landing routes for each airport are changed as necessary based on weather conditions and direction from air traffic control. This requires pilots to calculate entry paths and elevations in advance based on several patterns and share this work with other pilots on the same flight. According to Harumi Ikeshita of the Training Review Planning Office at Japan Airlines Co., Ltd., integrating Tableau into this process improved the efficiency of preparatory work, made it easier to share information thanks to visualizations, and drastically improved the accuracy of mutual understanding between operators.
”In the past, for some types of takeoff routes, individual pilots would prepare for flights by plotting routes by hand on a topographic map. This could result in some differences between individuals with respect to flight paths and elevations, and there was a risk that pilots would not notice mistakes. Moreover, since this was done by hand, it involved a lot of work. Even once finished, it was possible that an error might have been made, so it was not always easy to share one’s work with other pilots,” said Ikeshita.
Using Tableau drastically reduced the workload involved in plotting maps and making calculations. As a result, it became possible to respond more quickly and appropriately than before in situations like the Sakurajima volcano eruption of July 2022, enabling personnel to quickly create and share landing routes to Kagoshima Airport that avoided the smoke from the eruption.
“By enabling pilots to share data with each other, it is easier to check whether there are any errors in the route settings. It also establishes a shared visualization of routes between pilots of the flight ahead, enabling flights to be conducted more smoothly and precisely. Additionally, the use of, among other things, up-to-date satellite imagery to show actual structures on the route and checkpoints along the way has dramatically improved visualization and interactivity. These advancements have made it easier to get an idea of turning points, elevations, and other aspects of flights as well as to compare multiple routes to each other, all of which directly benefit flight safety.
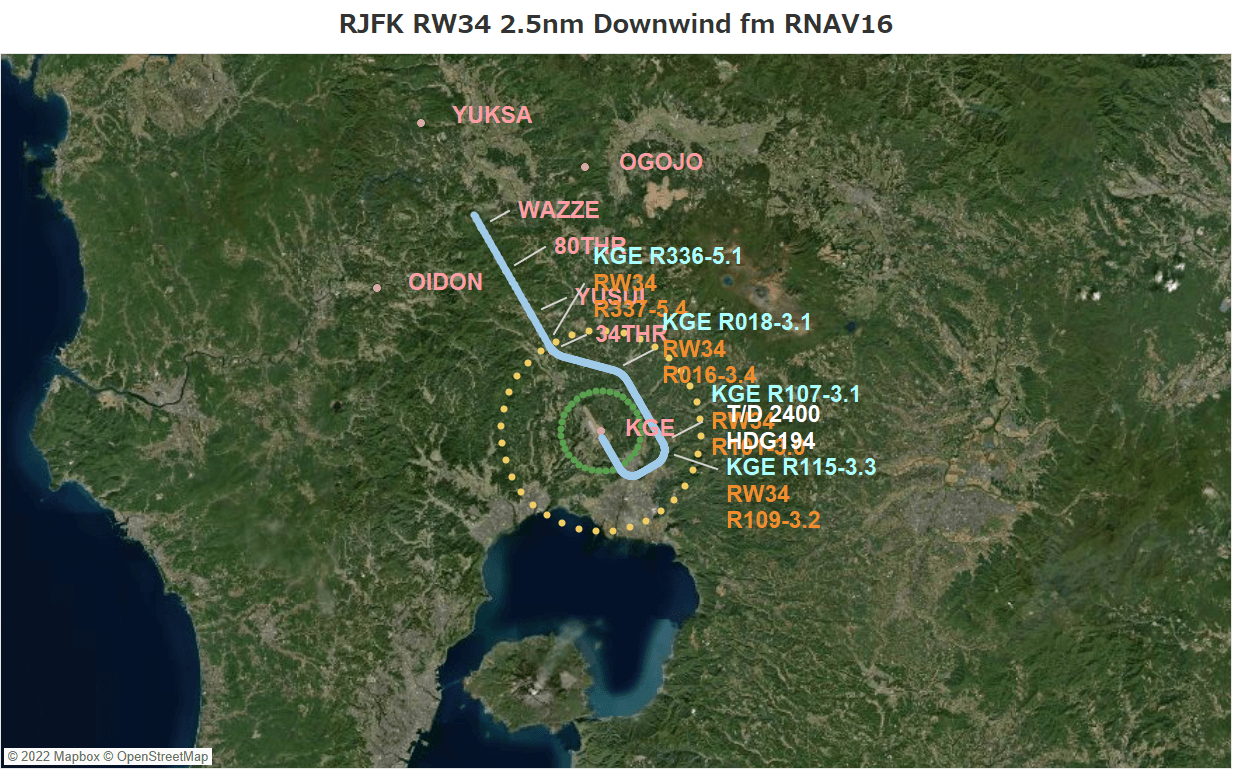
Takeoff and Landing Routes
JAL NAVIA Co., Ltd.
Better Customer Service for Counter Users
Tableau has also proven to be a powerful tool for improving customer service. JAL Plaza is JAL’s only face-to-face counter where customers can buy flight tickets and make inquiries. At JAL NAVIA Co., Ltd., which is responsible for operating the counter, work is underway to use Tableau to improve operations. At the center of those efforts is Aya Suzuki of the General Affairs Group in the Tokyo Center JAL Plaza Business Office.
“Although we had always collected data on visitors and customer service, aggregating and analyzing that data in Excel took time and didn’t help improve the quality of customer service provided by individual staff members. After Tableau was introduced, it became possible to aggregate customer service data for all 40 staff in an instant, and we were able to conduct briefings to improve individuals’ skills based on data on specific staff members’ customer service work volume and hours. We’ve also launched initiatives to optimize personnel allocation by identifying time periods with a lot of customer traffic and matters that take a lot of time to handle, and initiatives to provide customers with the right services by understanding trends in the purposes for which people come to the Plaza,” said Suzuki.
Quantitatively, as well, it can be seen from the data on time spent handling web-related inquiries that incorporating SMS and QR into the customer service process reduced average service times by around 10 minutes; from 31 minutes and 52 seconds to 22 minutes and 29 seconds.
Safely Planning Group, Safety Promotion Dept., Japan Airlines Co., Ltd.
Improving Aviation Safety and Security Data Monitoring
At the Safety Planning Group in the Safety Promotion Dept. at Japan Airlines Co., Ltd., which is in charge of aviation safety and security for the entire JAL Group., Tableau is used to improve the monitoring of aviation security and security data. Daisuke Higaki, also in the group, said the following:
“Previously, there was a system in place for the entire JAL Group that aggregated Excel data from each department. However, it did not have statistical analysis functionality. With Tableau, now anyone can easily handle large amounts of collected data. Dashboards that have been polished based on discussions with viewer users, and the documentation thereby created, are now used in many meetings by the management council and others,” said Higaki.
For example, if a question is asked during a meeting, Tableau makes it possible to simply look at the data and respond immediately rather than postponing the answer until more research can be done, making for smoother discussions. Higaki said that was the biggest benefit to using Tableau. He continued as follows:
“Safety is the most important thing to an airline company, and in order to discover and accurately deal with risks that threaten that safety, airline companies need to try out various methods of classifying events, etc., and run through a PDCA cycle. Tableau enables faster visualization and analysis that catalyze this PDCA cycle, and that has been an extremely big step forward for us,” said Higaki.
Multiple graphs move and interact with one another, and by clicking on a part of the graph that interests you, you can break down that element for further analysis. I never hit a mental block, and I was impressed how Tableau would answer my questions.

Future Outlook for the JAL Group
Promoting Community-based Tableau Use Throughout the Company
In just three years since it was first introduced in 2019, Tableau usage has expanded throughout the entire JAL Group. As Tableau implementation manager Yamazaki discussed in the opening, underlying this popularity is the active daily work by the members of “tablab,” an internal JAL user group, and “DANCU,” a data usage promotion organization. Satoshi Tamura is a member of the Technology Strategy Group in the IT Planning Dept. of the IT Planning HQ at Japan Airlines Co., Ltd. He is also one of the core members of the roughly 35-member DANCU organization.
“I have DATA Saber credentials, and I provide support for users who contact us because they want to do particular things in Tableau. I myself have been impressed by how easy it is to use Tableau, and I recommend it to others with the mindset that ‘as long as you have some data, you should try plugging it into Tableau,” said Tamura.
Masako Ono is a member of the Marketing Group in the Client Sales Dept. at JALPAK Co., Ltd., which provides package tours for both domestic and international travel. She began using Tableau without knowing anything about it, but she has now grown to become a core member of DANCU.
“If there’s ever something I don’t understand, I just ask in our Tableau group chat and instantly get an answer from a group member, so now I’m very capable with Tableau. I’ve been able to bring what I’ve learned back to my workplace and put it to use. During the COVID-19 pandemic, the availability of tours for travel changed on a moment-to-moment basis, so I am very grateful for Tableau because it enables us to visualize reservation data and use that to plan future policy,” said Ono.
Seiya Uchiumi is a member of the Data Strategy Office at JALCARD, Inc., which is a credit card company. He is also a core member of the same DANCU group, and he too puts the things he learned in the Tableau community to work to improve operations at his company, rapidly increasing the number of Tableau users at JALCARD. “Data analysis is extremely important to understanding our customers, and it was thanks to organizations like DANCU and Tablab that we were able to link up with other companies in the JAL Group to utilize data that we would never think to use otherwise. This is a wonderful community full of people with whom I would otherwise never come into contact in my work, all brought together by the ‘shared language’ of Tableau,” said Uchiumi.
Tableau usage throughout the JAL Group really manages to achieve the best baton pass among Group personnel. To conclude, Yamazaki discussed his outlook on the future as follows:
“Recently, there’s been no end to the examples of Tableau being put to good use that make you think, ‘Wow! I didn’t expect it to be useful there too!’ To that extent, Tableau use is really beginning to grow in unpredictable ways. Moving forward, we want to continue pushing forward to improve even further, working with companies both inside and outside the JAL Group to combine data in novel ways and thereby generate new business value,” said Yamazaki.
By visualizing various data, we have been able to establish a shared perspective across companies, departments, and job types that has boosted communication. Moving forward, we want to continue pushing forward to improve even further, combining data in novel ways and thereby generating new business value.