
The pace and evolution of business intelligence solutions mean what’s working now may need refining tomorrow. From natural language processing to the rise in data insurance, we interviewed customers and Tableau staff to identify the 10 impactful trends you will be talking about in 2018. Whether you’re a data rockstar or an IT hero or an executive building your BI empire, these trends emphasize strategic priorities that could help take your organization to the next level.
1 Don't Fear AI
How Machine Learning Will Enhance the Analyst
Popular culture is fueling a dystopian view of what machine learning can do. But while research and technology continue to improve, machine learning is rapidly becoming a valuable supplement for the analyst. In fact, machine learning is the ultimate assistant to the analyst.
Imagine needing to quickly look at the impact of a price change on a given product. To do this, you would run a linear regression on your data. Before Excel, R or Tableau, you had to do this all manually and the process took hours. Thanks to machine learning, you can now see the product’s consumption in a matter of minutes, if not seconds. As an analyst, you don’t need to do that heavy lifting, and you can move onto the next question—were the higher consumption months due to an extrinsic factor such as a holiday? Was there a new release? Was there news coverage influencing product purchase or awareness? What you’re not thinking about is how you wish you could have spent more time perfecting your regression model.
Machine Learning helps you look under lots and lots of rocks when you need assistance getting an answer.
There are two ways in which machine learning assists the analyst. The first is efficiency. With the example above, the analyst doesn’t spend valuable time on basic math. The analyst now has more time to think about business implications and the next logical steps. Secondly, it helps the analyst explore and stay in the flow of their data analysis because they no longer have to stop and crunch the numbers. Instead, the analyst is asking the next question. As Ryan Atallah, Staff Software Engineer describes it, “ML helps you look under lots and lots of rocks when you need assistance getting an answer.”
Machine learning’s potential to aid an analyst is undeniable, but it’s critical to recognize that it should be embraced when there are clearly defined outcomes. “Machine learning is not great when your data is subjective,” says Andrew Vigneault, Staff Product Manager with Tableau. For example, when conducting a survey to customers about product satisfaction, ML cannot always pick up on qualitative words.
Additionally, the analyst needs to understand success metrics for the data to make sense of it in a way that is actionable. In other words, inputs into a machine don’t make the outputs meaningful. Only a human can understand if the right amount of context has been applied—which means that machine learning cannot be done in isolation (without an understanding of the model and what inputs/outputs are being made).
While there might be concern over being replaced, machine learning will actually supercharge analysts and make them more efficient, more precise, and more impactful to the business. Instead of fearing machine learning technology, embrace the opportunities it presents.
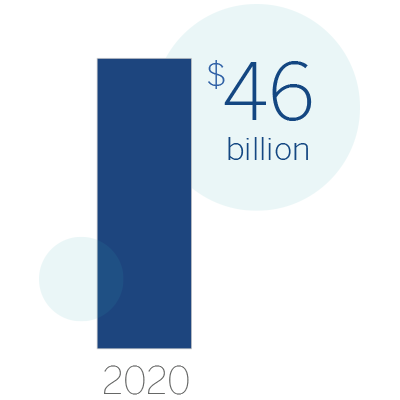
IDC forecasts revenues from AI and machine learning systems to total $46 billion by 2020.
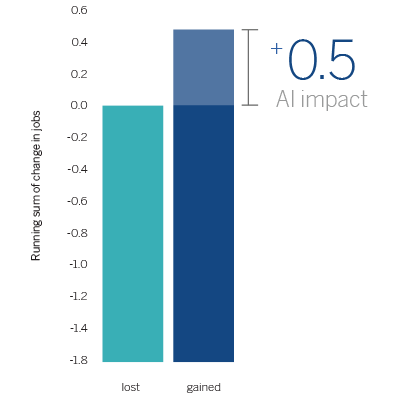
In 2020, AI will become a positive net job motivator, creating 2.3 million jobs while eliminating only 1.8 million jobs. (Gartner)
2 Liberal Arts Impact
The Human Impact of Liberal Arts in the Analytics Industry
As the analytics industry continues to seek skilled data workers, and organizations look to elevate their analytics team, we may have had a plethora of talent at our fingertips all along. We are familiar with how art and storytelling has helped influence the data analytics industry. That doesn’t come as a surprise. What comes as a surprise is how the technical aspects of creating an analytical dashboard, previously reserved for IT and power users, is being taken over by users who understand the art of storytelling—a skill set primarily coming from the liberal arts. Furthermore, organizations are placing a higher value on hiring workers who can use data and insights to affect change and drive transformation through art and persuasion, not only on the analytics itself.
As technology platforms become easier to use, the focus on tech specialties decreases. Everyone can play with data without needing to have the deep technical skills once required. This is where people with broader skills, including the liberal arts, come into the fold and drive impact where industries and organizations have a data worker shortage. As more organizations focus on data analytics as a business priority, these liberal arts data stewards will help companies realize that empowering their workforce is a competitive advantage.
Not only do we see a broad-base appeal to help hire a new generation of data-workers, we’ve also observed several instances where technology-based companies were led or heavily impacted by founders with a liberal arts education. This includes founders and executives from Slack, LinkedIn, PayPal, Pinterest and several other high-performing technology companies.
It takes a certain amount of skill to build a dashboard and to do analysis, but there's something that isn't really something you can teach—and that's really about the way you tell a story with the data.
One powerful example of bringing in the liberal arts to a predominantly technology company comes from Scott Hartley’s recent book, “the Fuzzy and the Techie.” Nissan hired a PhD anthropologist Melissa Cefkin to lead the company's research into human-machine interaction, and specifically the interaction between self-driving cars and humans. The technology behind self-driving vehicles has come a long way, but still faces hurdles when mixed human-machine environments persist. Using a four-way stop as an example, humans typically analyze situations on a case-by-case basis, making it nearly impossible to teach a machine. To help combat this scenario, Cefkin was tasked with leveraging her anthropology background to identify patterns in human behavior that can better teach these self-driving cars the patterns that humans follow, and in turn, communicate those back to the human riding in the car.
As analytics evolves to be more art and less science, the focus has shifted from simply delivering the data to crafting data-driven stories that inevitably lead to decisions. Organizations are embracing data at a much larger scale than ever before and the natural progression means more of an emphasis on storytelling and shaping data. The golden age of data storytelling is upon us and somewhere within your organization is a data storyteller waiting to uncover your next major insight.
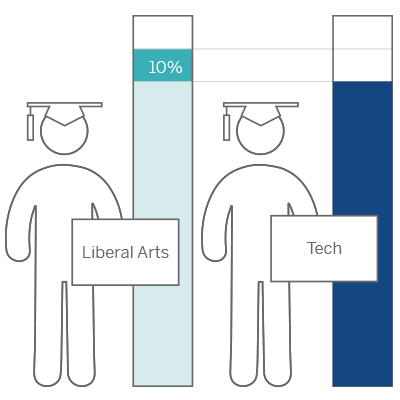
Liberal arts grads are joining the tech workforce 10% more rapidly than technical grads. (LinkedIn)

One third of all Fortune 500 CEOs have liberal arts degrees. (Fast Company)
3 The NLP Promise
The Promise of Natural Language Processing
2018 will see natural language processing (NLP) grow in prevalence, sophistication, and ubiquity. As developers and engineers continue to refine their understanding of NLP, the integration of it into unrealized areas will also grow. The rising popularity of Amazon Alexa, Google Home, and Microsoft Cortana have nurtured people’s expectations that they can speak to their software and it will understand what to do. For example, by stating a command, “Alexa, play ‘Yellow Submarine’,” the Beatles’ hit plays in your kitchen while making dinner. This same concept is also being applied to data, making it easier for everyone to ask questions and analyze the data they have at hand.
Gartner predicts by 2020 that 50 percent of analytical queries will be generated via search, NLP or voice. This means that suddenly it will be much easier for the CEO on the go to quickly ask his mobile device to tell him: “Total sales by customers who purchased staples in New York,” then filter to “orders in the last 30 days,” and then group by “project owner’s department.” Or, your child’s school principal could ask: “What was the average score of students this year,” then filter to “students in 8th grade,” and group by “teacher’s subject.” NLP will empower people to ask more nuanced questions of data and receive relevant answers that lead to better everyday insights and decisions.
[NLP] can open the analysts’ eyes a little bit and gives them some self-assurance and some confidence in what they're able to do.
Simultaneously, developers and engineers will make great strides in learning and understanding how people use NLP. They will examine how people ask questions, ranging from instant gratification (“which product had the most sales?”) to exploration (“I don’t know what my data can tell me—how’s my department doing?”). As Ryan Atallah, Staff Software Engineer for Tableau, notes, “This behavior is very much tied to the context in which the question is being asked.” If the end user is on their mobile, they are more likely to ask a question that generates instant gratification, whereas, if they are sitting at a desk looking at a dashboard, they’re probably looking to explore and examine a deeper question.
The biggest analytics gains will come from understanding the diverse workflows that NLP can augment. As Vidya Setlur, Staff Software Engineer with Tableau also puts it, “Ambiguity is a hard problem,” so understanding workflows becomes more important than the input of a specific question. When there are multiple ways of asking the same question of the data (e.g. “What sales rep had the most sales this quarter?” or “Who had the most sales this quarter?”), the end user doesn’t wish to think about the “right” way to ask it, they just want the answer.
Consequently, the opportunity will arise not from placing NLP in every situation, but making it available in the right workflows so it becomes second nature to the person using it.
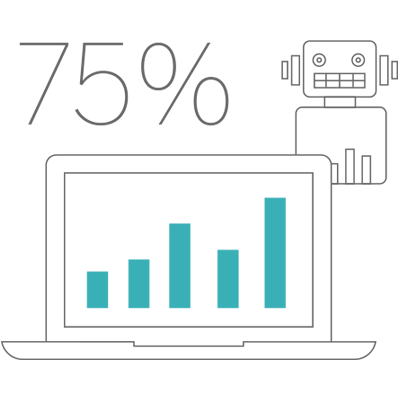
By 2019, 75% of workers whose daily tasks involve the use of enterprise applications will have access to intelligent personal assistants to augment their skills and expertise. (IDC)
By 2021, more than 50% of enterprises will be spending more per annum on bots and chatbot creation than traditional mobile app development. (Gartner)
4 The Debate for Multi-Cloud
The Debate for Multi-Cloud Rages On
If your organization is exploring and evaluating a multi-cloud strategy in 2018, you’re not alone.
“There's a stampede of organizations moving their data to the cloud and moving their core applications,” said Chief Product Officer Francois Ajenstat. “And whether it's a ‘lift and shift’ or a re-platforming, we see customers adopting the cloud at a much faster rate than ever.”
According to a recent Gartner study, “a multi-cloud strategy will become the common strategy for 70 percent of enterprises by 2019, up from less than 10 percent today.” Customers are growing sensitive about being locked into a single legacy software solution that doesn’t match their future needs. However, switch and migrations have become relatively easier with similar APIs and the use of open standards like Linux, Postgres, MySQL, and others.
It’s likely your organization is also evaluating how data centers are designed and run. Your IT department is evaluating hosting environments based on risk, complexity, speed and cost—all factors that increase the difficulty in finding one, single solution for your organization’s needs.
Evaluating and implementing a multi-cloud environment can help determine who provides the best performance and support for your situation. According to the Boston Herald, GE re-aligned its cloud hosting strategy to leverage both Microsoft Azure and Amazon Web Services, with the intention to understand the best performing hosting environment and see which contract provides the lowest cost to pass to their customers.
This multi-cloud or hybrid cloud strategy is becoming increasingly important to help reduce risk and provide more choice and flexibility for customers.
But the multi-cloud trend doesn’t come without a healthy awareness of the merits and challenges of moving to this type of environment. While flexibility is a plus, a multi-cloud environment increases overhead cost from splitting your organization’s workloads across multiple providers. And a multi-cloud environment forces an internal developer team to learn multiple platforms and have additional governance processes in place, depending on the different environments they have to support.
Additionally, a multi-cloud strategy could potentially diminish the buying power of a company or organization. If a company is splitting what they buy across multiple providers, it will hurt their volume discounts. This creates a model where a company is buying less at a worse price.
Surveys and stats, such as the Gartner data-point above, indicate multi-cloud adoption is on the rise. However, it doesn’t indicate how much of a given platform was adopted. In many multi-cloud cases, organizations are using one provider for most of their needs and very little for others. But most of these use cases fall on implementing a second cloud hosting environment as a backup in case of incompetency or failure of the main cloud hosting environment.
While the rise of multi-cloud adoption in 2018 is on the rise, organizations will have to maneuver through the nuance of assessing whether their strategy measures how much of each cloud platform was adopted, internal usage, and the workload demands and implementation costs.
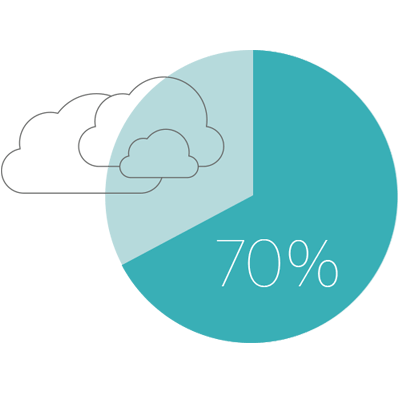
70% of enterprises will be implementing a multi-cloud strategy by 2019. (Gartner)
74% of Tech Chief Financial Officers say cloud computing will have the most measurable impact on their business in 2017. (Forbes)
5 Rise of the CDO
Rise of the Chief Data Officer
Data and analytics are becoming core to every organization. That is undebatable. As organizations evolve, they’re prioritizing a new level of strategic focus and accountability regarding their analytics.
Historically, most business intelligence efforts were assigned to the Chief Information Officer (CIO), who oversaw standardizing, consolidating, and governing data assets across the organization, which needed consistent reporting. This put BI initiatives (data governance, building analytical models, etc.) in competition with other strategic initiatives (such as IT architecture, system security, or network strategy) under the purview of the CIO—and often inhibited the success and impact of BI.
In some cases, a gap between the CIO and the business has formed due to speed to insight versus security and governance of the data. So to derive actionable insights from data through analytics investments, organizations are increasingly realizing the need for accountability in the C-Suite to create a culture of analytics. For a growing number of organizations, the answer is appointing a Chief Data Officer (CDO) or Chief Analytics Officer (CAO) to lead business process change, overcome cultural barriers, and communicate the value of analytics at all levels of the organization. This allows the CIO to have a more strategic focus on things such as data security.
My job is to bring tools and technologies and empower the team.
The fact that CDO’s and/or CAO’s are being appointed and assigned accountability for business impact and improved outcomes, also demonstrates the strategic value of data and analytics in modern organizations. There is now a proactive conversation at the C-level about how to deploy an analytics strategy. Instead of waiting for requests for a particular report, CDO’s are asking, “How can we anticipate or quickly adapt to business requests?”
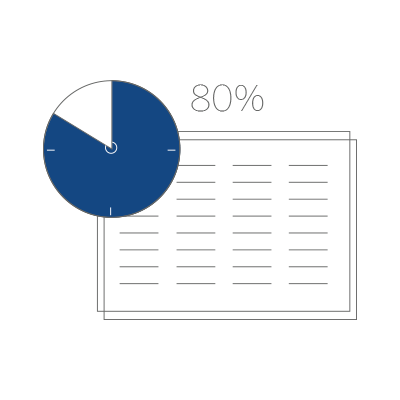
To best facilitate a highly effective team under this C-level position, organizations are dedicating more money and resources. According to Gartner, 80 percent of large enterprises will have a CDO office fully implemented by 2020. Currently, the average number of employees in the office is 38, but 66 percent of organizations surveyed expect that the allocated budget for the office will grow.
Josh Parenteau, Tableau’s Market Intelligence Director, notes that the role of the CDO is “outcome focused.” He states that “it’s not just about putting data into a data warehouse and hopefully someone uses it—they’re there to define what the use is and make sure that you’re getting value.” This outcome focus is critical, especially as it aligns with the top three objectives in Gartner’s 2016 CDO survey, which include greater customer intimacy, an increased competitive advantage, and an improvement in efficiency. These objectives are fueling companies like Wells Fargo, IBM, Aetna, and Ancestry to implement CDOs with the intent to take their data strategy to the next level, making the role of Chief Data Officer a business staple in 2018.
By 2019, 90% of large companies will have a CDO role in place. (Gartner)

By 2020, 50% of leading organizations will have a CDO with similar levels of strategy influence and authority as their CIO.
6 Crowdsourced Governance
The Future of Data Governance is Crowdsourced
The modern business intelligence outfit has progressed from data and content lockdowns to the empowerment of business users everywhere to use trusted, governed data for insights. And as people are learning to use data in more situations, their input on better governance models has become a monumental force within organizations.
It’s an understatement to say that self-service analytics has disrupted the world of business intelligence. The paradigm shifted to anyone having the capacity to create analytics leading to the asking and answering of critical questions across the organization. The same disruption is happening with governance. As self-service analytics expands, a funnel of valuable perspectives and information begins to inspire new and innovative ways to implement governance.
Governance is as much about using the wisdom of the crowd to get the right data to the right person as it is locking down the data from the wrong person.
Governance is as much about using the wisdom of the crowd to get the right data to the right person as it is locking down the data from the wrong person.
For the business user, the last responsibility they want is the security of the data. Good governance policies allow the business user to ask and answer questions, while allowing them to find the data they need, when they need it.
BI and analytics strategies will embrace the modern governance model: IT departments and data engineers will curate and prepare trusted data sources, and as self-service is mainstreamed, end users will have the freedom to explore data that is trusted and secure. Top-down processes that only address IT control will be discarded in favor of a collaborative development process combining the talents of IT and end users. Together, they will identify the data that is most important to govern and create rules and processes that maximize the business value of analytics without compromising security.
45% of data citizens say that less than half of their reports have good quality data. (Collibra)
61% of C/V Suite leaders say their own companies’ decision-making is only somewhat or rarely data driven. (PwC)
7 Data Insurance
Vulnerability Leads to a Rise in Data Insurance
For many companies, data is a critical business asset. But how do you measure the value of that data? And what happens when that data is lost or stolen? As we have seen with recent high profile data breaches, a threat to a company’s data can be crippling and potentially cause irreparable damage to the brand.
According to a 2017 study by the Ponemon Institute, the average total cost of a data breach was estimated at $3.62 million.
But are companies doing everything they can to protect and insure their data? One industry rapidly growing in response to data breaches is the cybersecurity insurance market. This industry has seen 30 percent year-over-year growth, with the industry set to reach $5.6 billion in annual gross written premium by 2020. (AON)
Cyber and privacy insurance covers a business’ liability for a data breach in which the customer’s personal information is exposed or stolen by a hacker.
However, even with the market’s growth and the continued threat of data breaches, only 15 percent of U.S. companies have an insurance policy that covers data breaches and cybersecurity. Furthermore, when you look at those 15 percent of U.S. companies covered, a majority come from large, established financial institutions.
You have to decide where the pain point is. What is the real risk to your business?
The need for policies with financial institutions is clear. But the trend will broaden to other verticals because nobody is immune to the threat of a data breach.
Doug Laney, Gartner Analyst, recently wrote a book titled, “Infonomics: How to Monetize, Manage, and Measure Information for Competitive Advantage.” He gives distinct models on how companies across all industries can review the value of their data, both in non-financial models and financial models.
Non-financial models focus on the intrinsic value, the business value, and the performance value of the data. These values can measure a company’s uniqueness, accuracy, relevancy, internal efficiencies and overall impact on its usage.
Financial models focus on the cost value, the economic value, and the market value of the data. These values can measure the cost of acquiring data, administering the data internally, and the value of selling or licensing your data.
Data as a commodity means its value will only increase, and ultimately drive new questions and conversations around how this raw material will continue to project companies to greater heights and advantages. And like any product, what good is it if it can be pilfered without consequence?

The average total cost of a data breach was estimated at $3.62 million. (Ponemon)
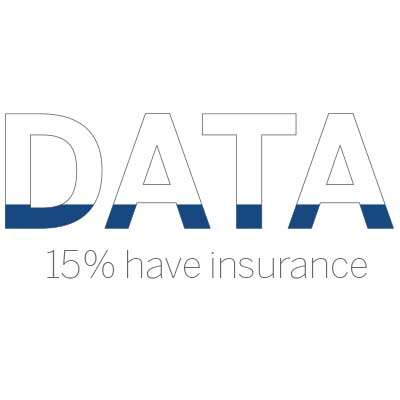
Only 15% of US companies have an insurance policy specifically for their data. (Ponemon)
8 Data Engineer Role
Increased prominence of the data engineer role
Here is a certainty: you can't create a dashboard without having all of your charts built out so you can understand the story you're trying to communicate. Another principle you likely know: you can't have a reliable data source without first understanding the type of data that goes into a system and how to get it out.
Data engineers will continue to be an integral part of an organization’s movement to use data to make better decisions about their business. Between 2013 and 2015, the number of data engineers more than doubled. And as of October 2017, there were over 2,500 open positions with “data engineer” in the title on LinkedIn, indicating the growing and continued demand for this specialty.
Data engineers play a fundamental part in enabling self-service for the modern analytics platform.
So what is this role and why is it so important? The data engineer is responsible for designing, building, and managing a business’s operational and analytics databases. In other words, they are responsible for extracting data from the foundational systems of the business in a way that can be used and leveraged to make insights and decisions. As the rate of data and storage capacity increases, someone with deep technical knowledge of the different systems, architecture, and the ability to understand what the business wants or needs starts to become ever more crucial.
Yet, the data engineer role requires a unique skillset. They need to understand the backend, what’s in the data, and how it can serve the business user. The data engineer also needs to develop technical solutions to make the data is usable.
In the words of Michael Ashe, Senior Recruiter for Tableau, “I’m no spring chicken. I’ve been in technical recruiting for over 17 years. And it’s no surprise that data and storage capacity has continued to grow—I’ve seen it happen in quantum leaps. The data will always need tweaking. Businesses need to plug into this role. They need to dive into specific data to make business decisions. The data engineer most definitely will continue to grow as a role.”

A 2016 Gartner study found respondent organizations were losing an average of $9.7 million annually as a result of poor data quality.
Data scientists and analysts can spend as much as 80% of their time cleaning and preparing data. (TechRepublic)
9 Location of Things
The Location of Things will Drive IoT Innovation
It’s an understatement to say that the proliferation of the internet of things (IoT) has driven monumental growth in the number of connected devices we see in the world. All of these devices interact with each and capture data that is making a more connected experience. In fact, Gartner predicts that by 2020 the number of IoT devices available to consumers will more than double “with 20.4 billion IoT devices online.”
Even with this growth, the use cases and implementation of IoT data hasn’t followed the same desirable path. Companies have concerns about security, but most don’t have the right organizational skill sets or the internal technical infrastructure with other applications and platforms to support IoT data.
When most people think location or geospatial, they think of it as a dimension. It's something I'm going to analyze...the new trend is that it is becoming an input into the analytical process.
One positive trend we are seeing is the usage and benefits of leveraging location-based data with IoT devices. This subcategory, termed “location of things,” provides IoT devices with sensing and communicates their geographic position. By knowing where an IoT device is located, it allows us to add context, better understand what is happening and what we predict will happen in a specific location.
For companies and organizations seeking to capture this data collection, we are seeing different technologies being used. For example, hospitals, stores, and hotels have begun to use Bluetooth Low Energy (BLE) technology for indoor location services, which were typically difficult for GPS to provide contextual location. The technology can be used to track specific assets, people and even interact with mobile devices like smartwatches, badges or tags in order to provide personalized experiences.
As it relates to analyzing the data, location-based figures can be viewed as an input versus an output of results. If the data is available, analysts can incorporate this information with their analysis to better understand what is happening, where it is happening, and what they should expect to happen in a contextual area.

IoT endpoints will grow to 30 billion by 2020. (IDC)
Explosive growth of IoT is expected, exceeding more than $5 billion by year-end 2020. (Gartner)
10 Academics Investment
Universities Double Down on Data Science & Analytics Programs
North Carolina State University is home to the first Master of Science Analytics program. The MSA is housed within their Institute of Advanced Analytics (IAA), a data hub with the mission to “produce the world’s finest analytics practitioners—individuals who have mastered complex methods and tools for large-scale data modeling [and] who have a passion for solving challenging problems…” As the first of its type, the NC State program has foreshadowed academia’s pronounced investment in data science and analytics curriculum.
Earlier this year, the University of California, San Diego launched a first for their institution—an undergraduate major and minor in data science. They didn’t stop there. The university also made plans, supercharged by an alumnus donation, to create a data science institute. Following suit, UC Berkeley, UC Davis, and UC Santa Cruz have all increased their data science and analytics options for students, with demand exceeding expectations. But why?
I'm constantly surprised by what the students come up with, and blown away with how they're able to just intuitively look at the data and play with the data and come up with some visualizations.
According to a recent PwC study, 69 percent of employers by the year 2021 will demand data science and analytics skills from job candidates. In 2017, Glassdoor also reported that “data science,” for the second consecutive year, was a “top job.” As demand from employers grows, the urgency to fill a funnel of highly-skilled data fiends becomes more critical. But there’s a reality gap. The same PwC report cites that only 23 percent of college graduates will have the necessary skills to compete at the level employers demand. A recent MIT survey found that 40 percent of managers are having trouble hiring analytical talent.
The hard skills of analytics are no longer an elective; they are a mandate. 2018 will begin to see a more rigorous approach to making sure students possess the skills to join the modern workforce. And as companies continue to refine their data to extract the most value, the demand for a highly data-savvy workforce will exist — and grow.
By 2021, 69% of employers will demand data science and analytics as a critical skill set of job candidates. (PWC)
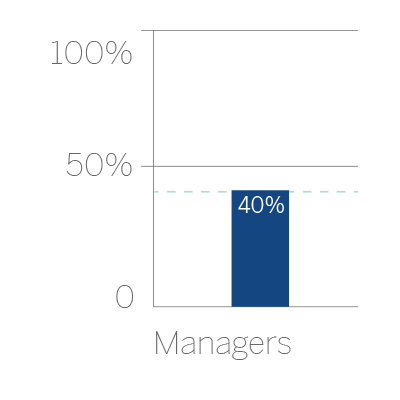
A recent MIT survey found that 40% of managers have had trouble hiring analytical talent. (MIT)