
Tableau 2024.3 is Coming Soon
Explore the new features coming soon to Tableau
Notice for Tableau Cloud Users
We roll out Tableau Cloud updates over several weeks across our worldwide infrastructure for every quarterly product release. We begin with official Cloud infrastructure upgrades and then continue to release our on-premises products (e.g., Desktop, Server) to ensure that Tableau Cloud Users have immediate access to our new releases.
If you are a Tableau Cloud User, you may already have access to the new features listed here as “coming soon” on your site! To learn more about the Tableau Cloud releases, please visit the Tableau Cloud System Maintenance page.
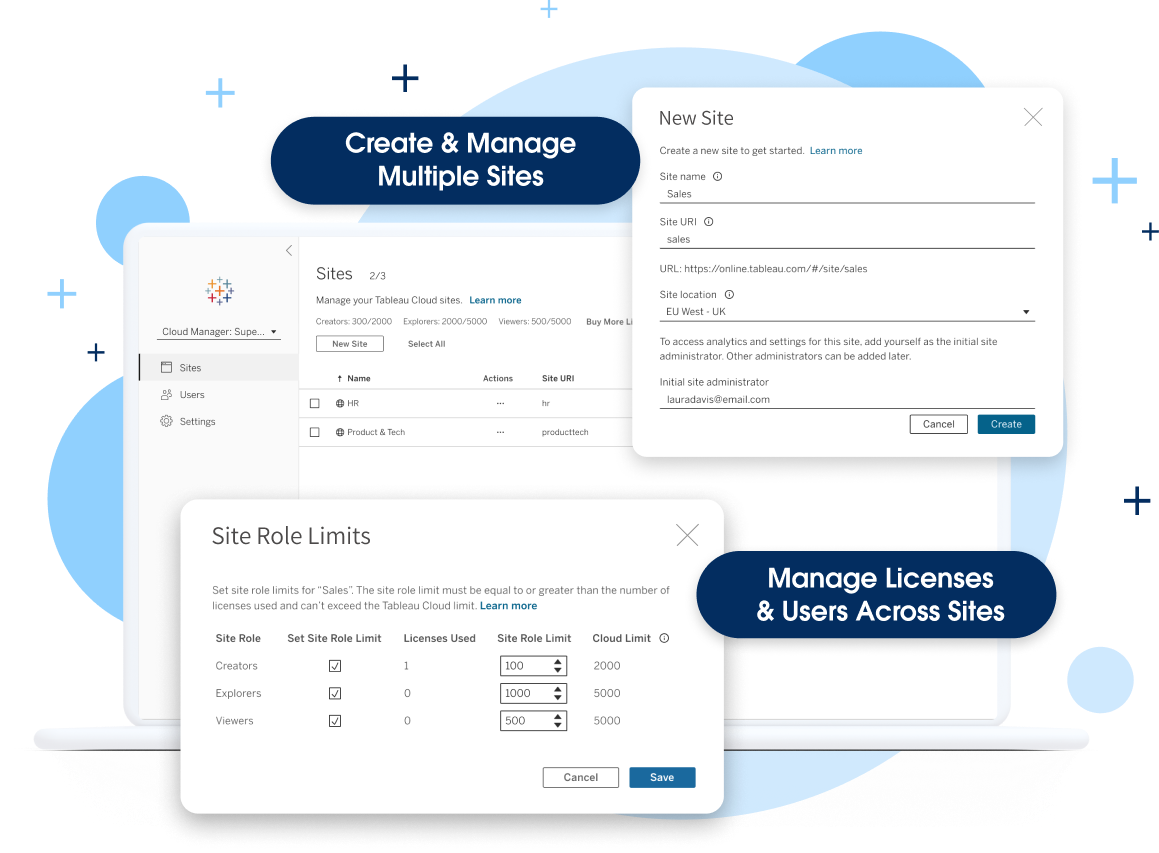
Tableau Cloud Manager
Tableau Cloud Manager allows admins to create and manage multiple Tableau sites in the regions of their choice. Admins can manage licenses and users across sites without having to license a single user multiple times. This simplifies the expansion and management of their cloud analytics environment while helping ensure they meet data residency requirements and maintain governance.
Note: This feature will be deployed in waves. Admins will receive an email two weeks before this feature is deployed to their site.
Spatial Parameters
Bring the full Tableau experience to geospatial data with geospatial support for Parameters. Spatial Parameters create rich, interactive dashboards so users can ask and answer questions about geospatial data.
Table Viz Extension
Evolve from legacy reporting to visual analytics while meeting your users' current needs. Now, you can add detail tables and grid views to dashboards for users who prefer traditional reporting views.
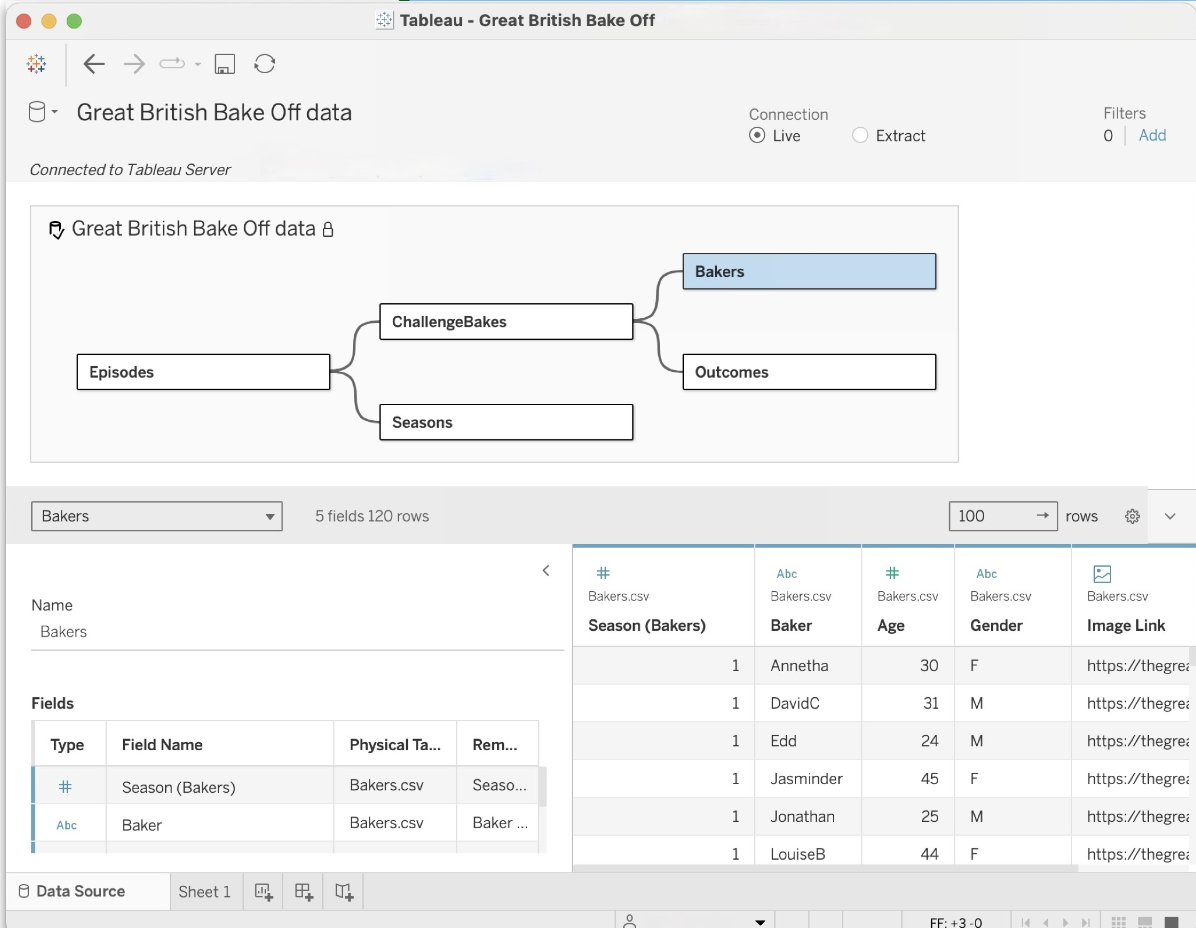
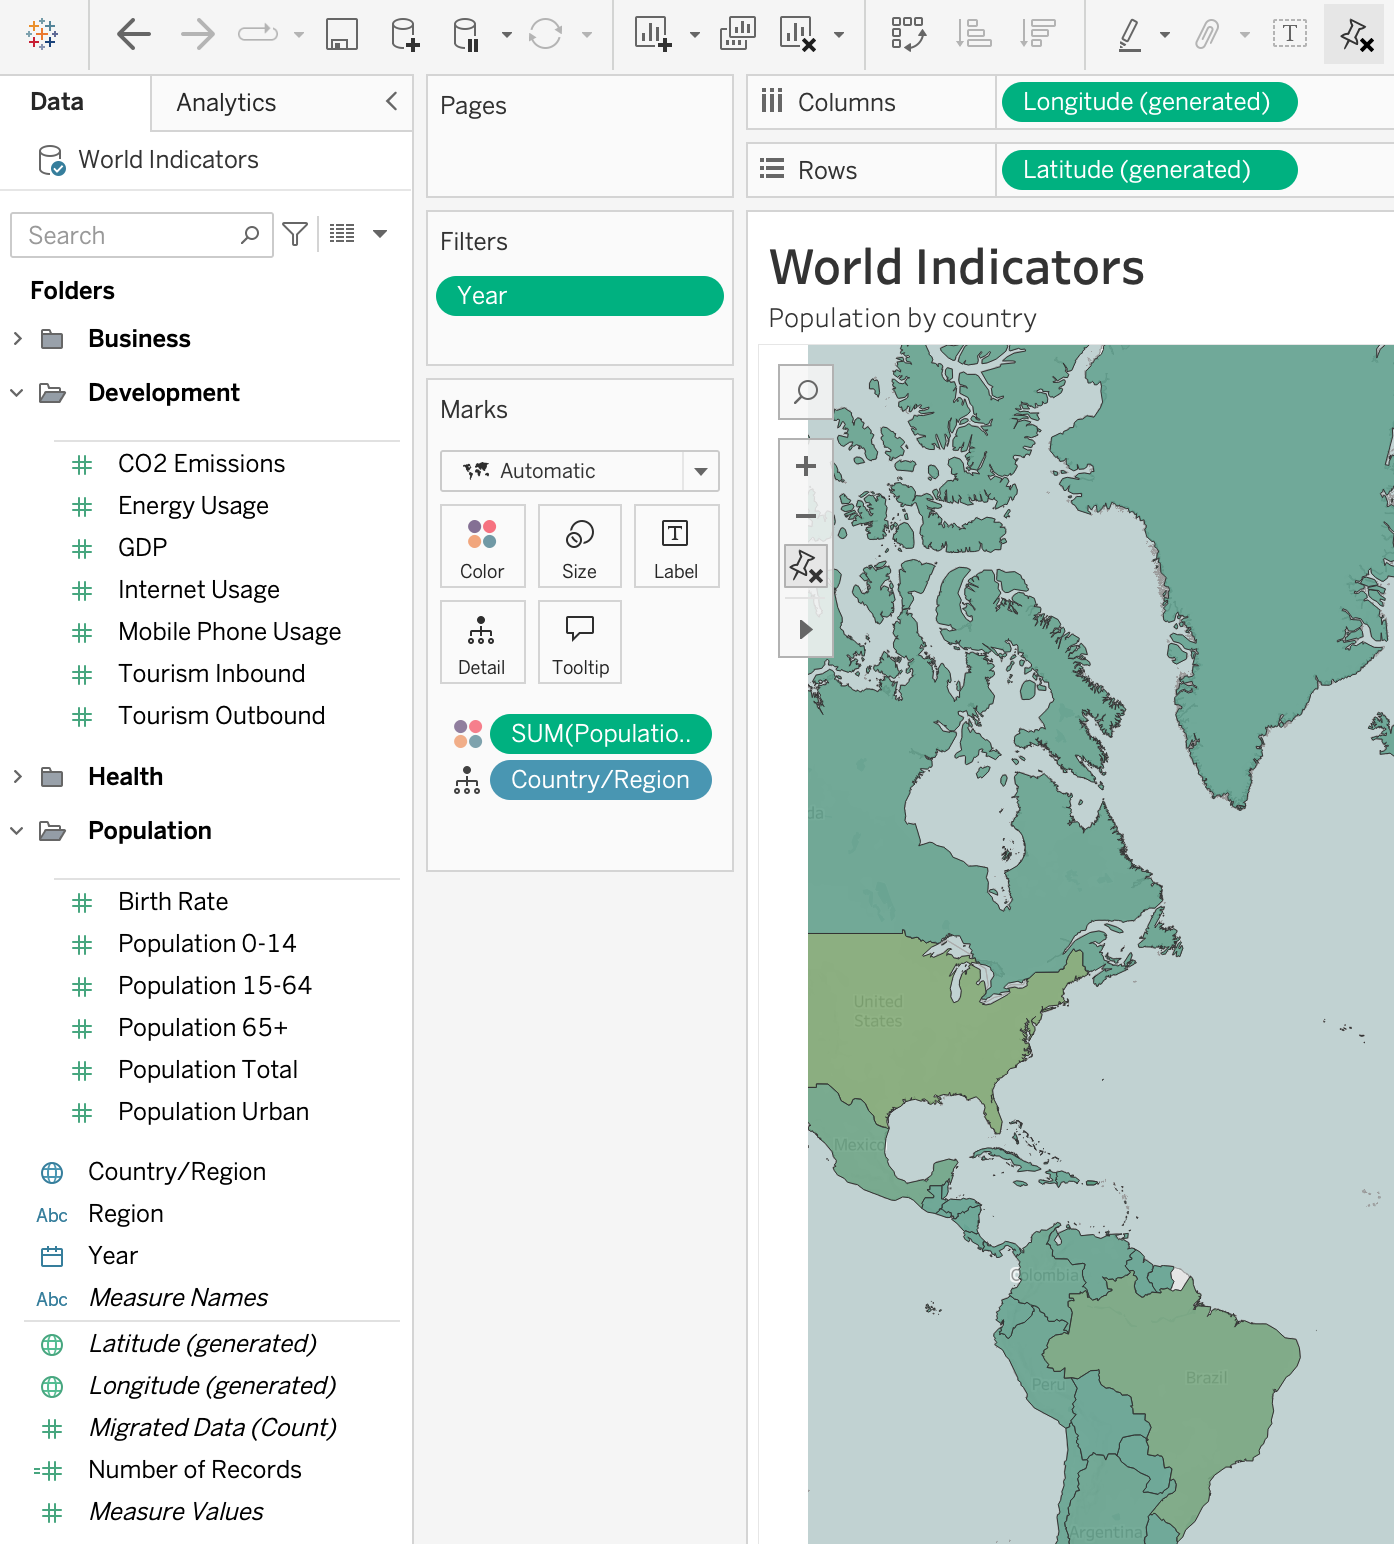
Display Data Model for Published Data Sources
View and understand how tables in your data model are related in Published Data Sources. Create accurate visualizations and understand the relationships between different tables and fields in Tableau by simply clicking the Data Source pane in a Tableau workbook.
Custom Domains
Improve end-user navigation experience and reflect your brand with Custom Domains. Custom Domains can also help admins meet third-party cookie compliance requirements to ensure embedded solutions operate as expected.
Mutable Email Address for Notifications
Allow Tableau Cloud users to update their email if they lose access to the inbox to ensure they can still get important notifications from Tableau Cloud. Available in a weekly release coming after the initial availability of 2024.3.
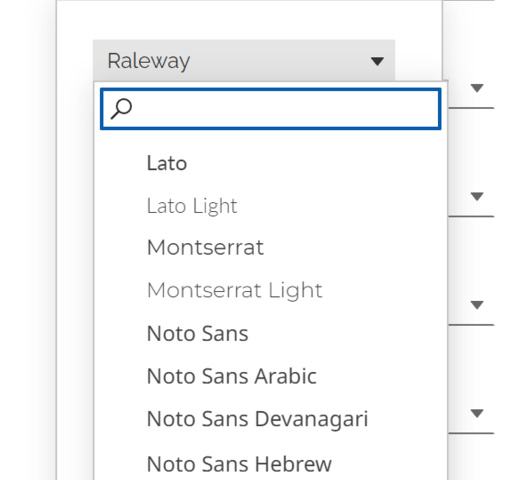
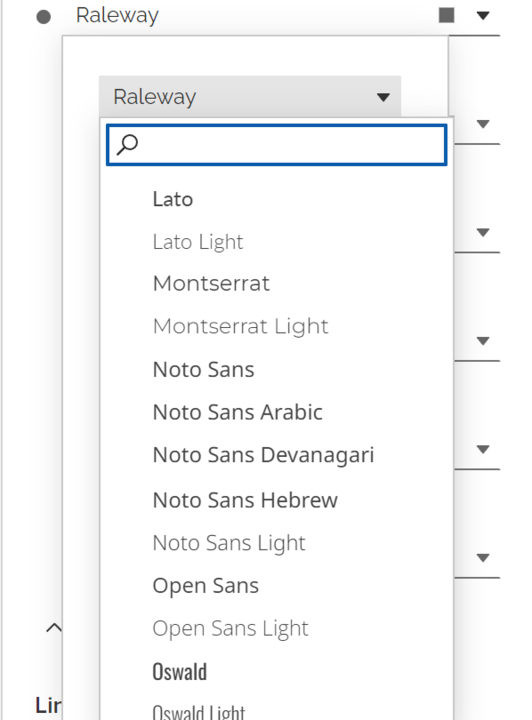
Google Font Support
Get more font options in Tableau Cloud with support for a set of Google Fonts. Tableau Cloud now supports Lato, Montserrat, Noto Sans, Noto Sans Hebrew, Noto Sans Arabic, Noto Sans Devanagari, Open Sans, Oswald, Poppins, and Raleway.
Accessibility Improvements
Enable users that use assistive technologies to explore, navigate, and interact with visualizations and dashboards without a mouse with three accessibility improvements. Now, users can use the "Enter" key to navigate a viz. We've also improved screen reader announcements and mouse-to-keyboard transitions.
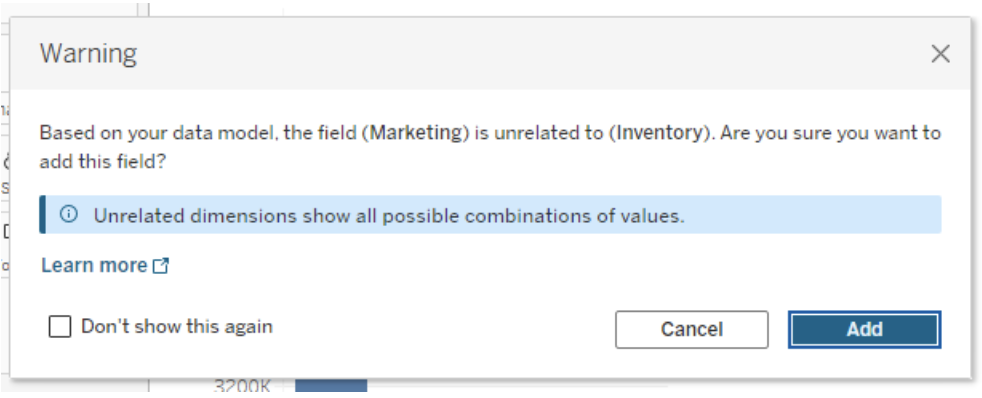
Multi-Fact Relationships Infoscenting
Receive proactive information, in the flow of work, without requiring the full understanding of the underlying data model. Multi-Fact Relationship Infoscenting surfaces guidance and additional information about the relatability between fields in use and those in the data pane.
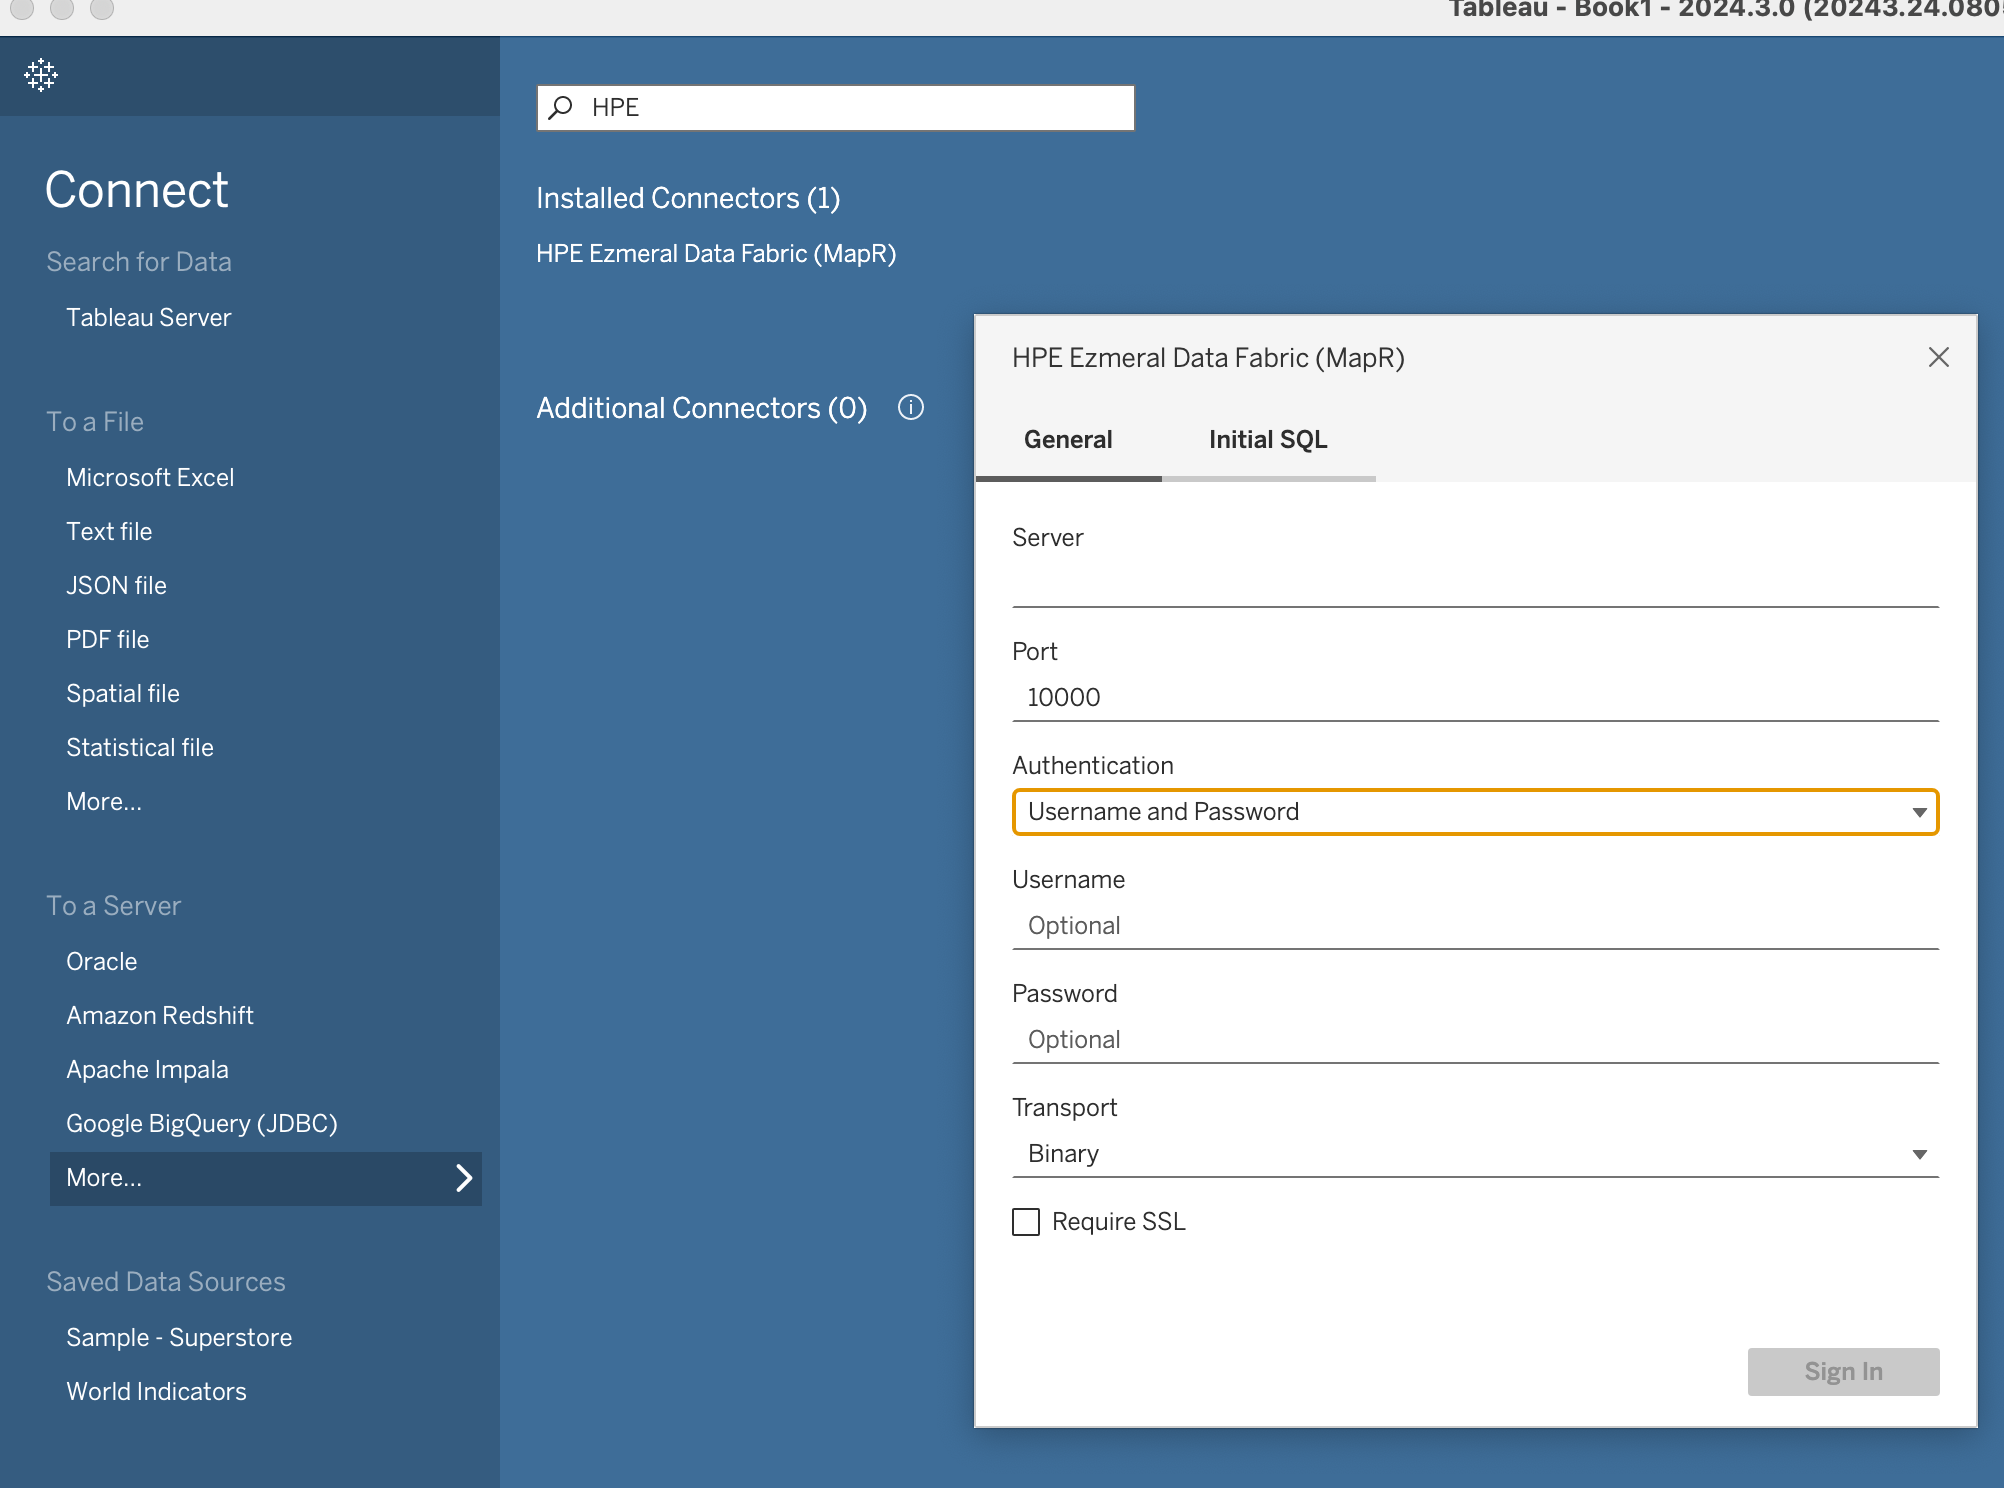
HPE Ezmeral Data Fabric (MapR) Connector
Previously know as MapR, connect to and analyze the data stored in HPE Ezmeral Data Fabric. The connector is available by default in the Connectors list starting in 2024.3.
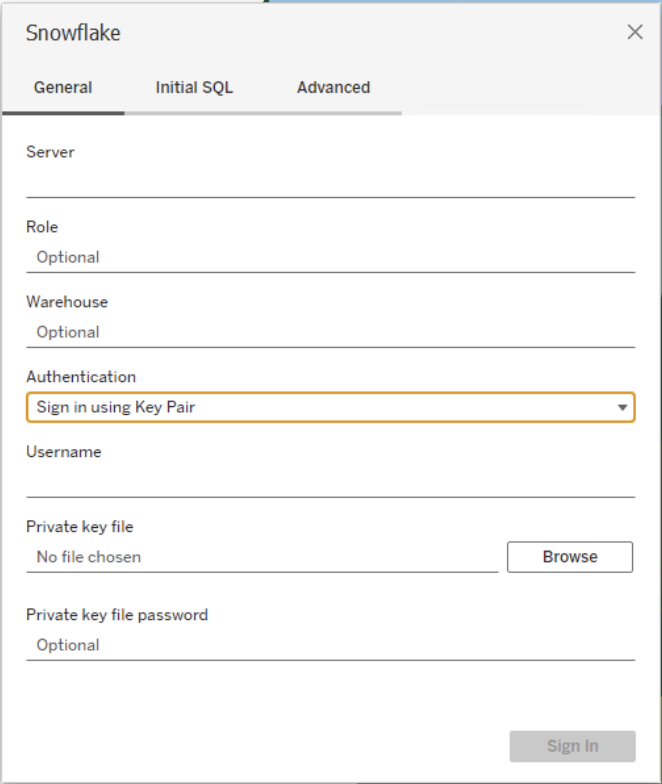
Key Pair Authentication for Snowflake
Keep your credentials safe and secure with a new option to Sign in using a Key Pair when connecting to Snowflake. Business users can publish Snowflake connected content to Tableau Server or Tableau Cloud using individual user accounts, and admins can edit connections to use a key pair authenticated service account. This authenticator provides better control over access and credential rotation.
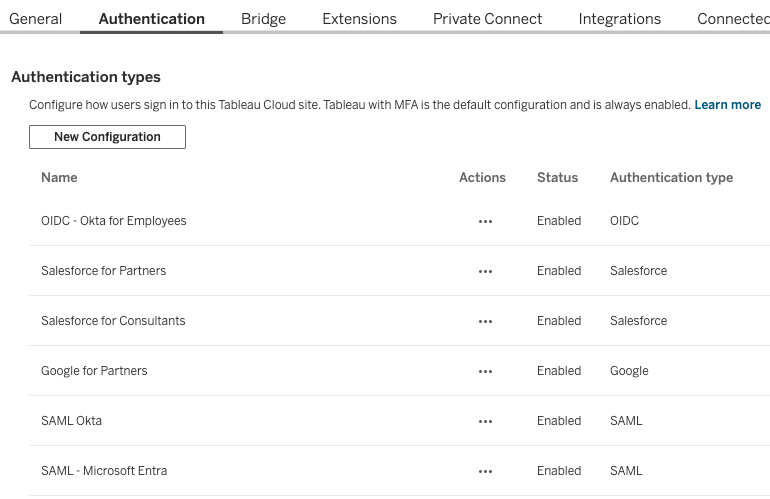
Multiple External Identity Providers on a Site
Enable up to 20 identity providers on a single Tableau Cloud site. Use multiple identity providers to allow external users, internal users, and partners secure access to your Tableau Cloud site.
Note: Available in a weekly release coming soon after the initial availability of 2024.3.
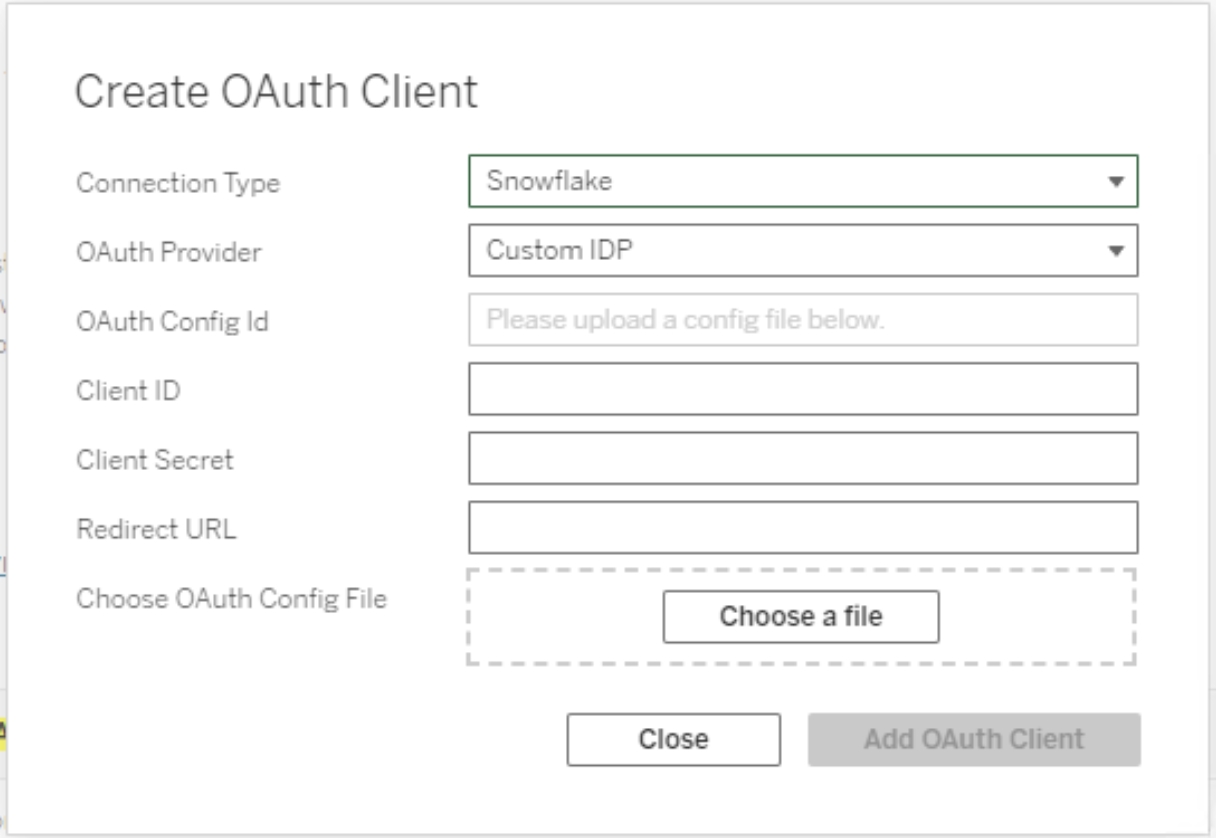
External Identity Provider for Snowflake
Integrate Tableau and Snowflake with your existing identity provider and security policies. Ensure trust by configuring your identity provider for the relevant Tableau clients, and create and deploy OAuth configuration files.
Explore in Tableau API
Empower your customers to start an analytics session in Tableau with a single click from your data platform. Tableau creates a new workbook with a data source based on their data, so they can instantly begin analysis without needing to connect to data or redefine their data model.
Tableau Cloud Germany Region
Bring analytics to new teams in Europe while meeting data residency requirements. Use the new Hyperforce region in Germany to deploy Tableau Cloud Sites in Germany.
Note: Customers in the Dublin region will be migrated to the Germany region.
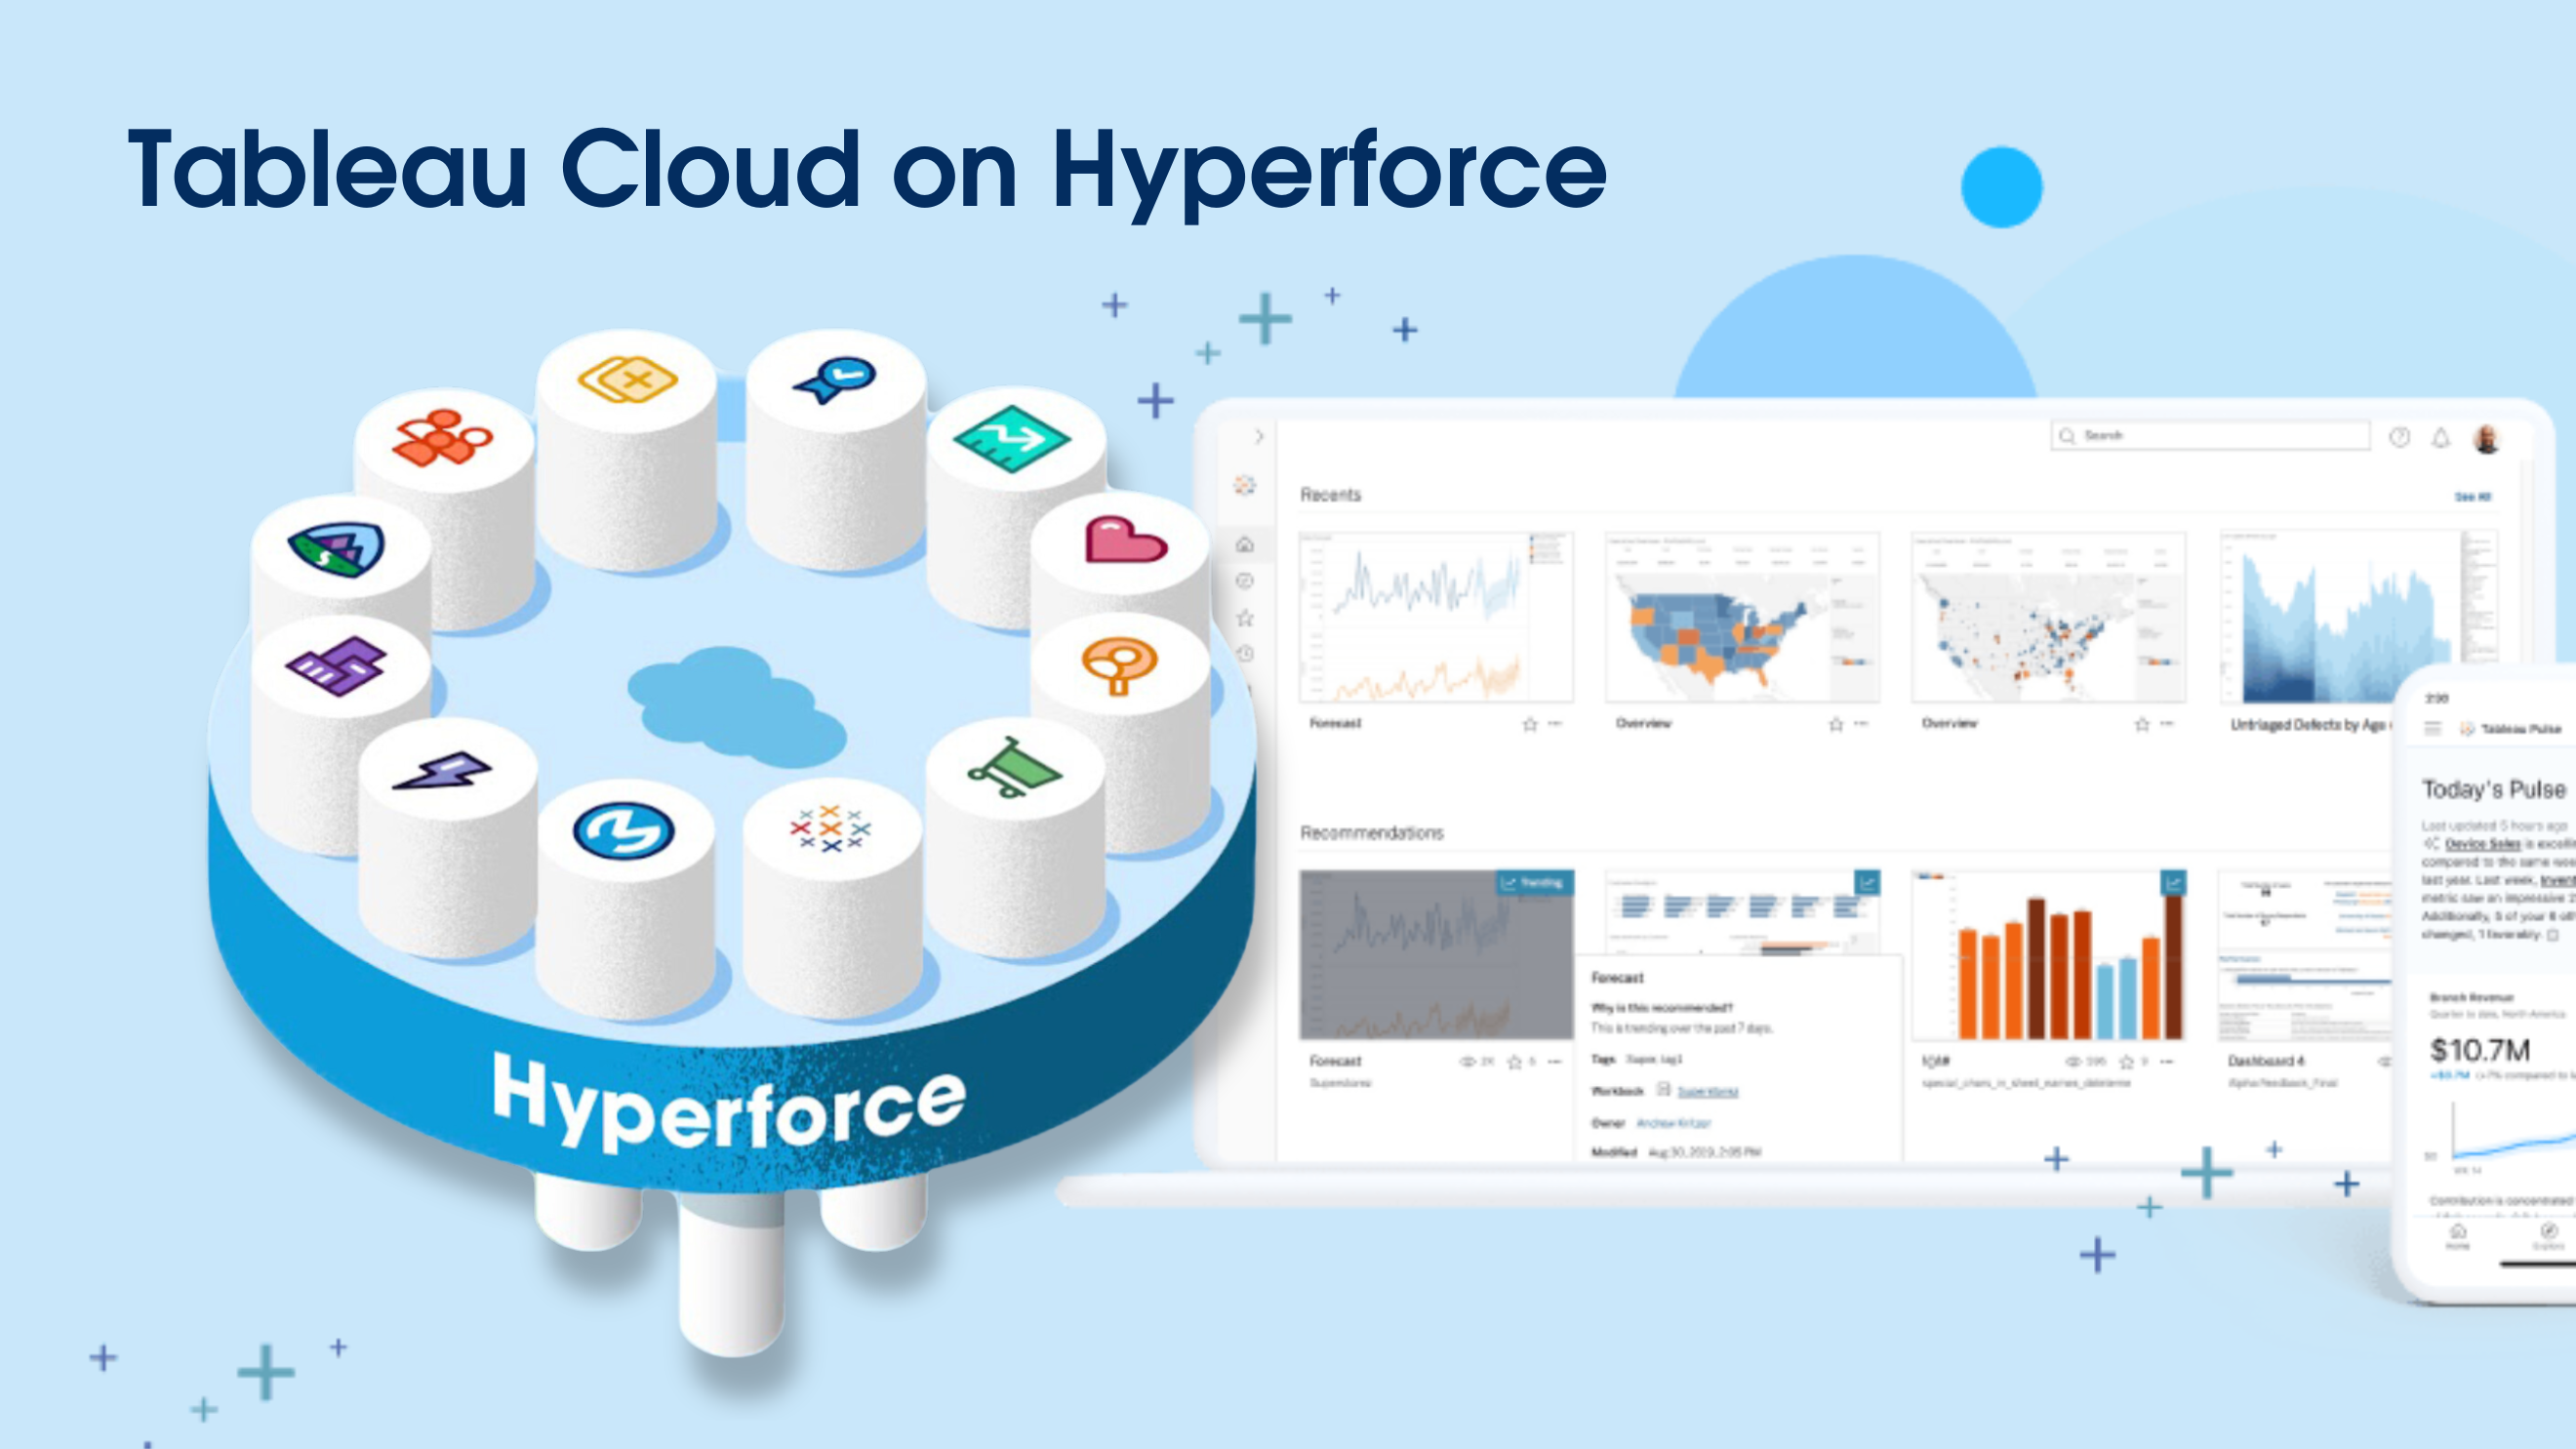
Tableau Cloud on Hyperforce
Salesforce's Hyperforce platform is a groundbreaking platform redefining scalability, security, and compliance across the globe. To meet customer demand for more robust, secure, and scalable cloud analytics solutions, Tableau Cloud is moving to Hyperforce.
Note: Migration will accrue over several weeks. Admins will be notified before their migration takes place.
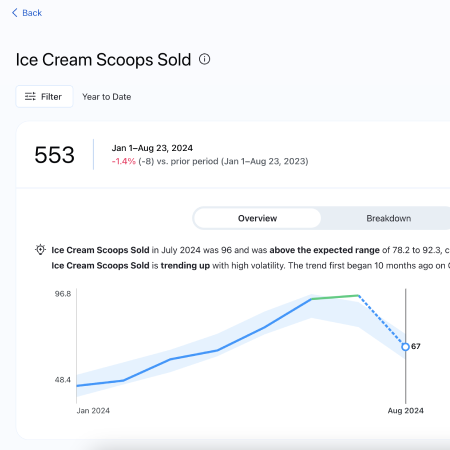
Tableau Pulse: Enhanced Seasonality Insights
Tableau Pulse now more accurately reflects the expected range of metrics and recognizes unusual changes for data with seasonality trends. *Released August 2024
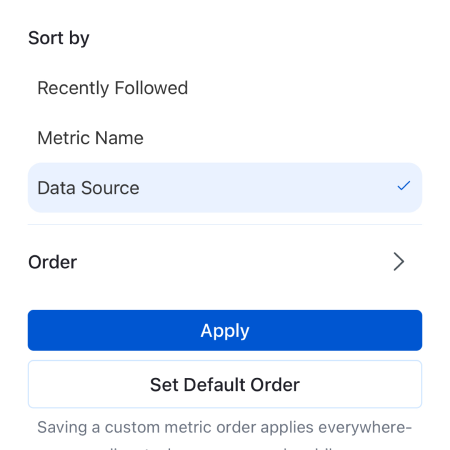
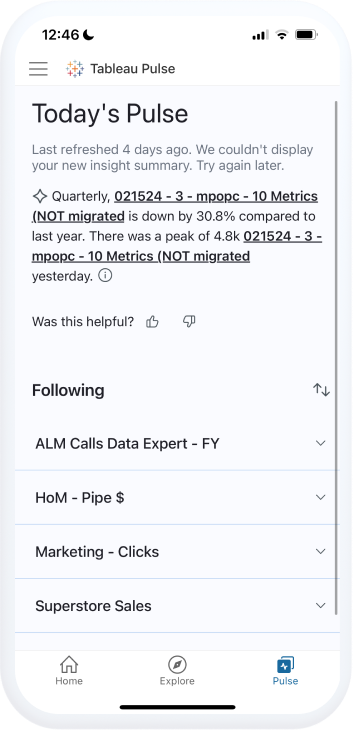
Tableau Pulse: Sorting & Grouping on Mobile
The ability to sort and arrange your metrics to organize and evaluate related metrics together is available on the Tableau Mobile app. You can group your metrics from your phone based on the metric name, the data source, and when you start following them. Set the default view to be consistent across your email digests, web view, and the Tableau Mobile app.
*This is a premium capability available in Tableau+
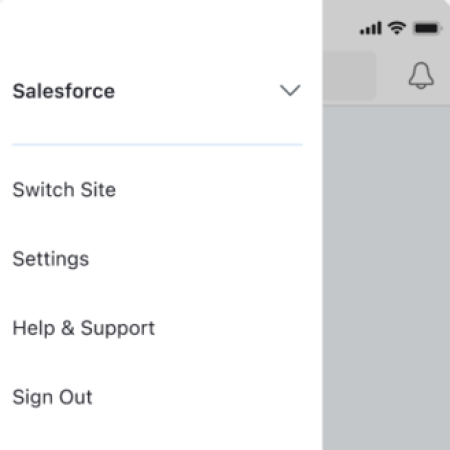
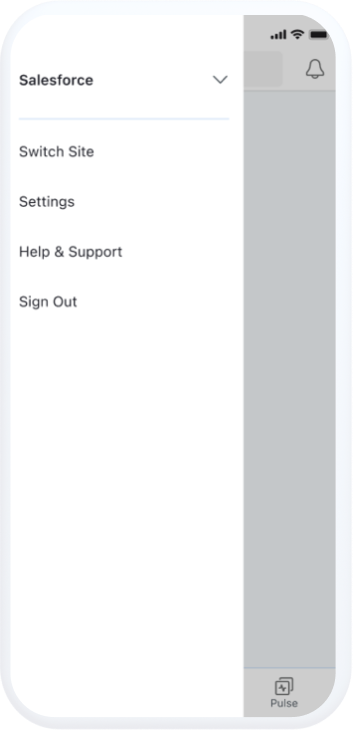
Tableau Pulse: Swap between sites on Mobile
Easily transition between various Tableau Cloud sites and access all your content quickly while using the Tableau Mobile app. With a site switcher, similar to the web experience, you can view all your available sites and switch to access the respective content without logging out and re-enter credentials.
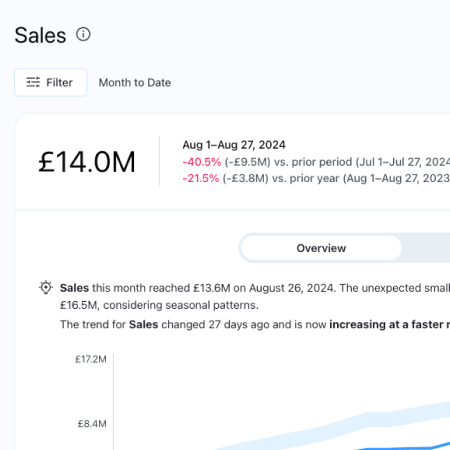
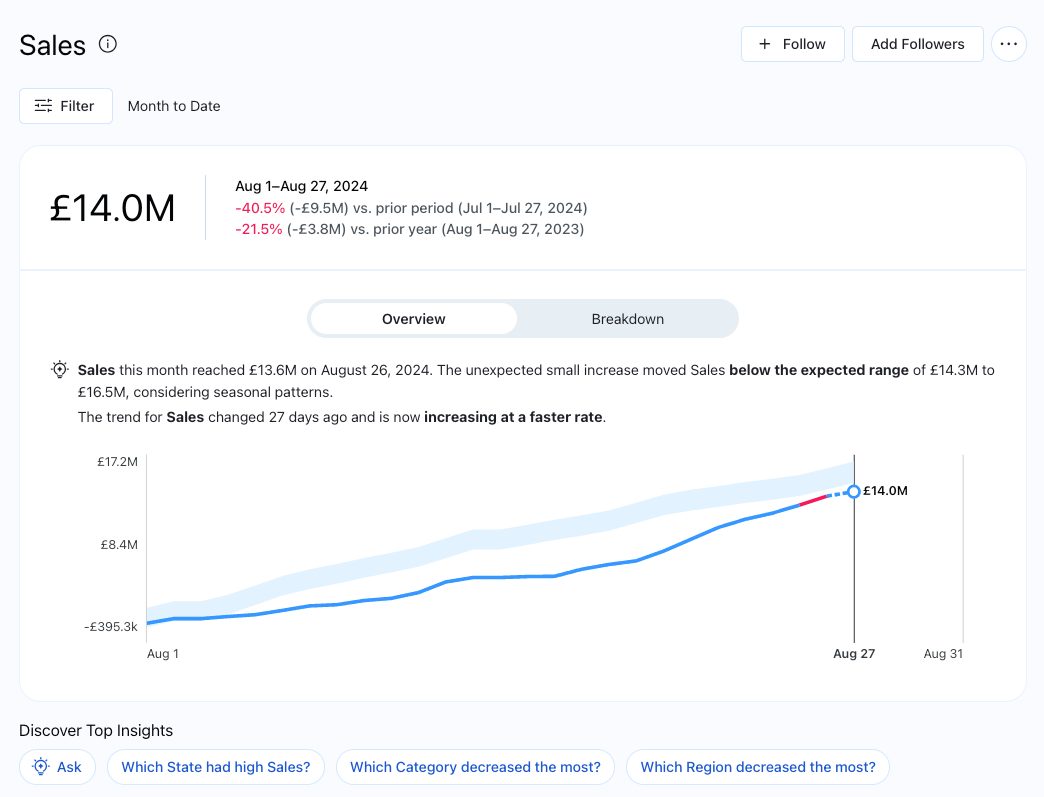
Tableau Pulse: Global Currency Symbols
Make your Tableau Pulse metrics clearer and more personalized by showing the right currency symbol. Pulse now supports over 130 different symbols. Once you specify the currency symbol in your metric definition, the value will be used across all the metrics that use that central definition. *Released September 2024
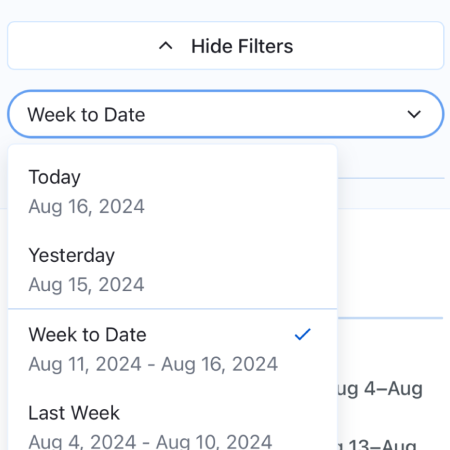
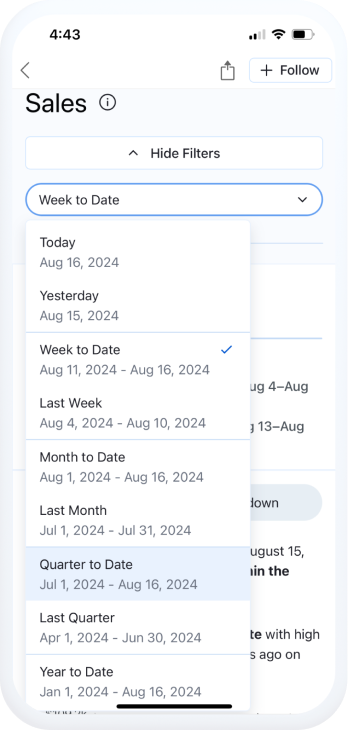
Tableau Pulse: Change Mobile Time Period
Pulse on mobile now better matches web functionality around the most common Pulse interactions. Select the ‘filter’ dropdown to change the time period for a metric when browsing your metrics on mobile—without needing to switch to the web to explore. *Released August 2024
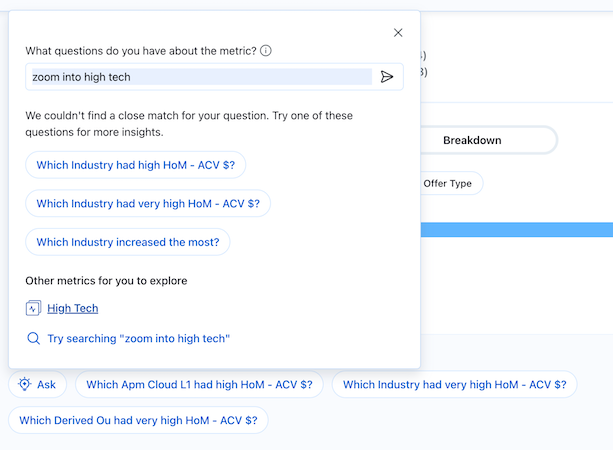
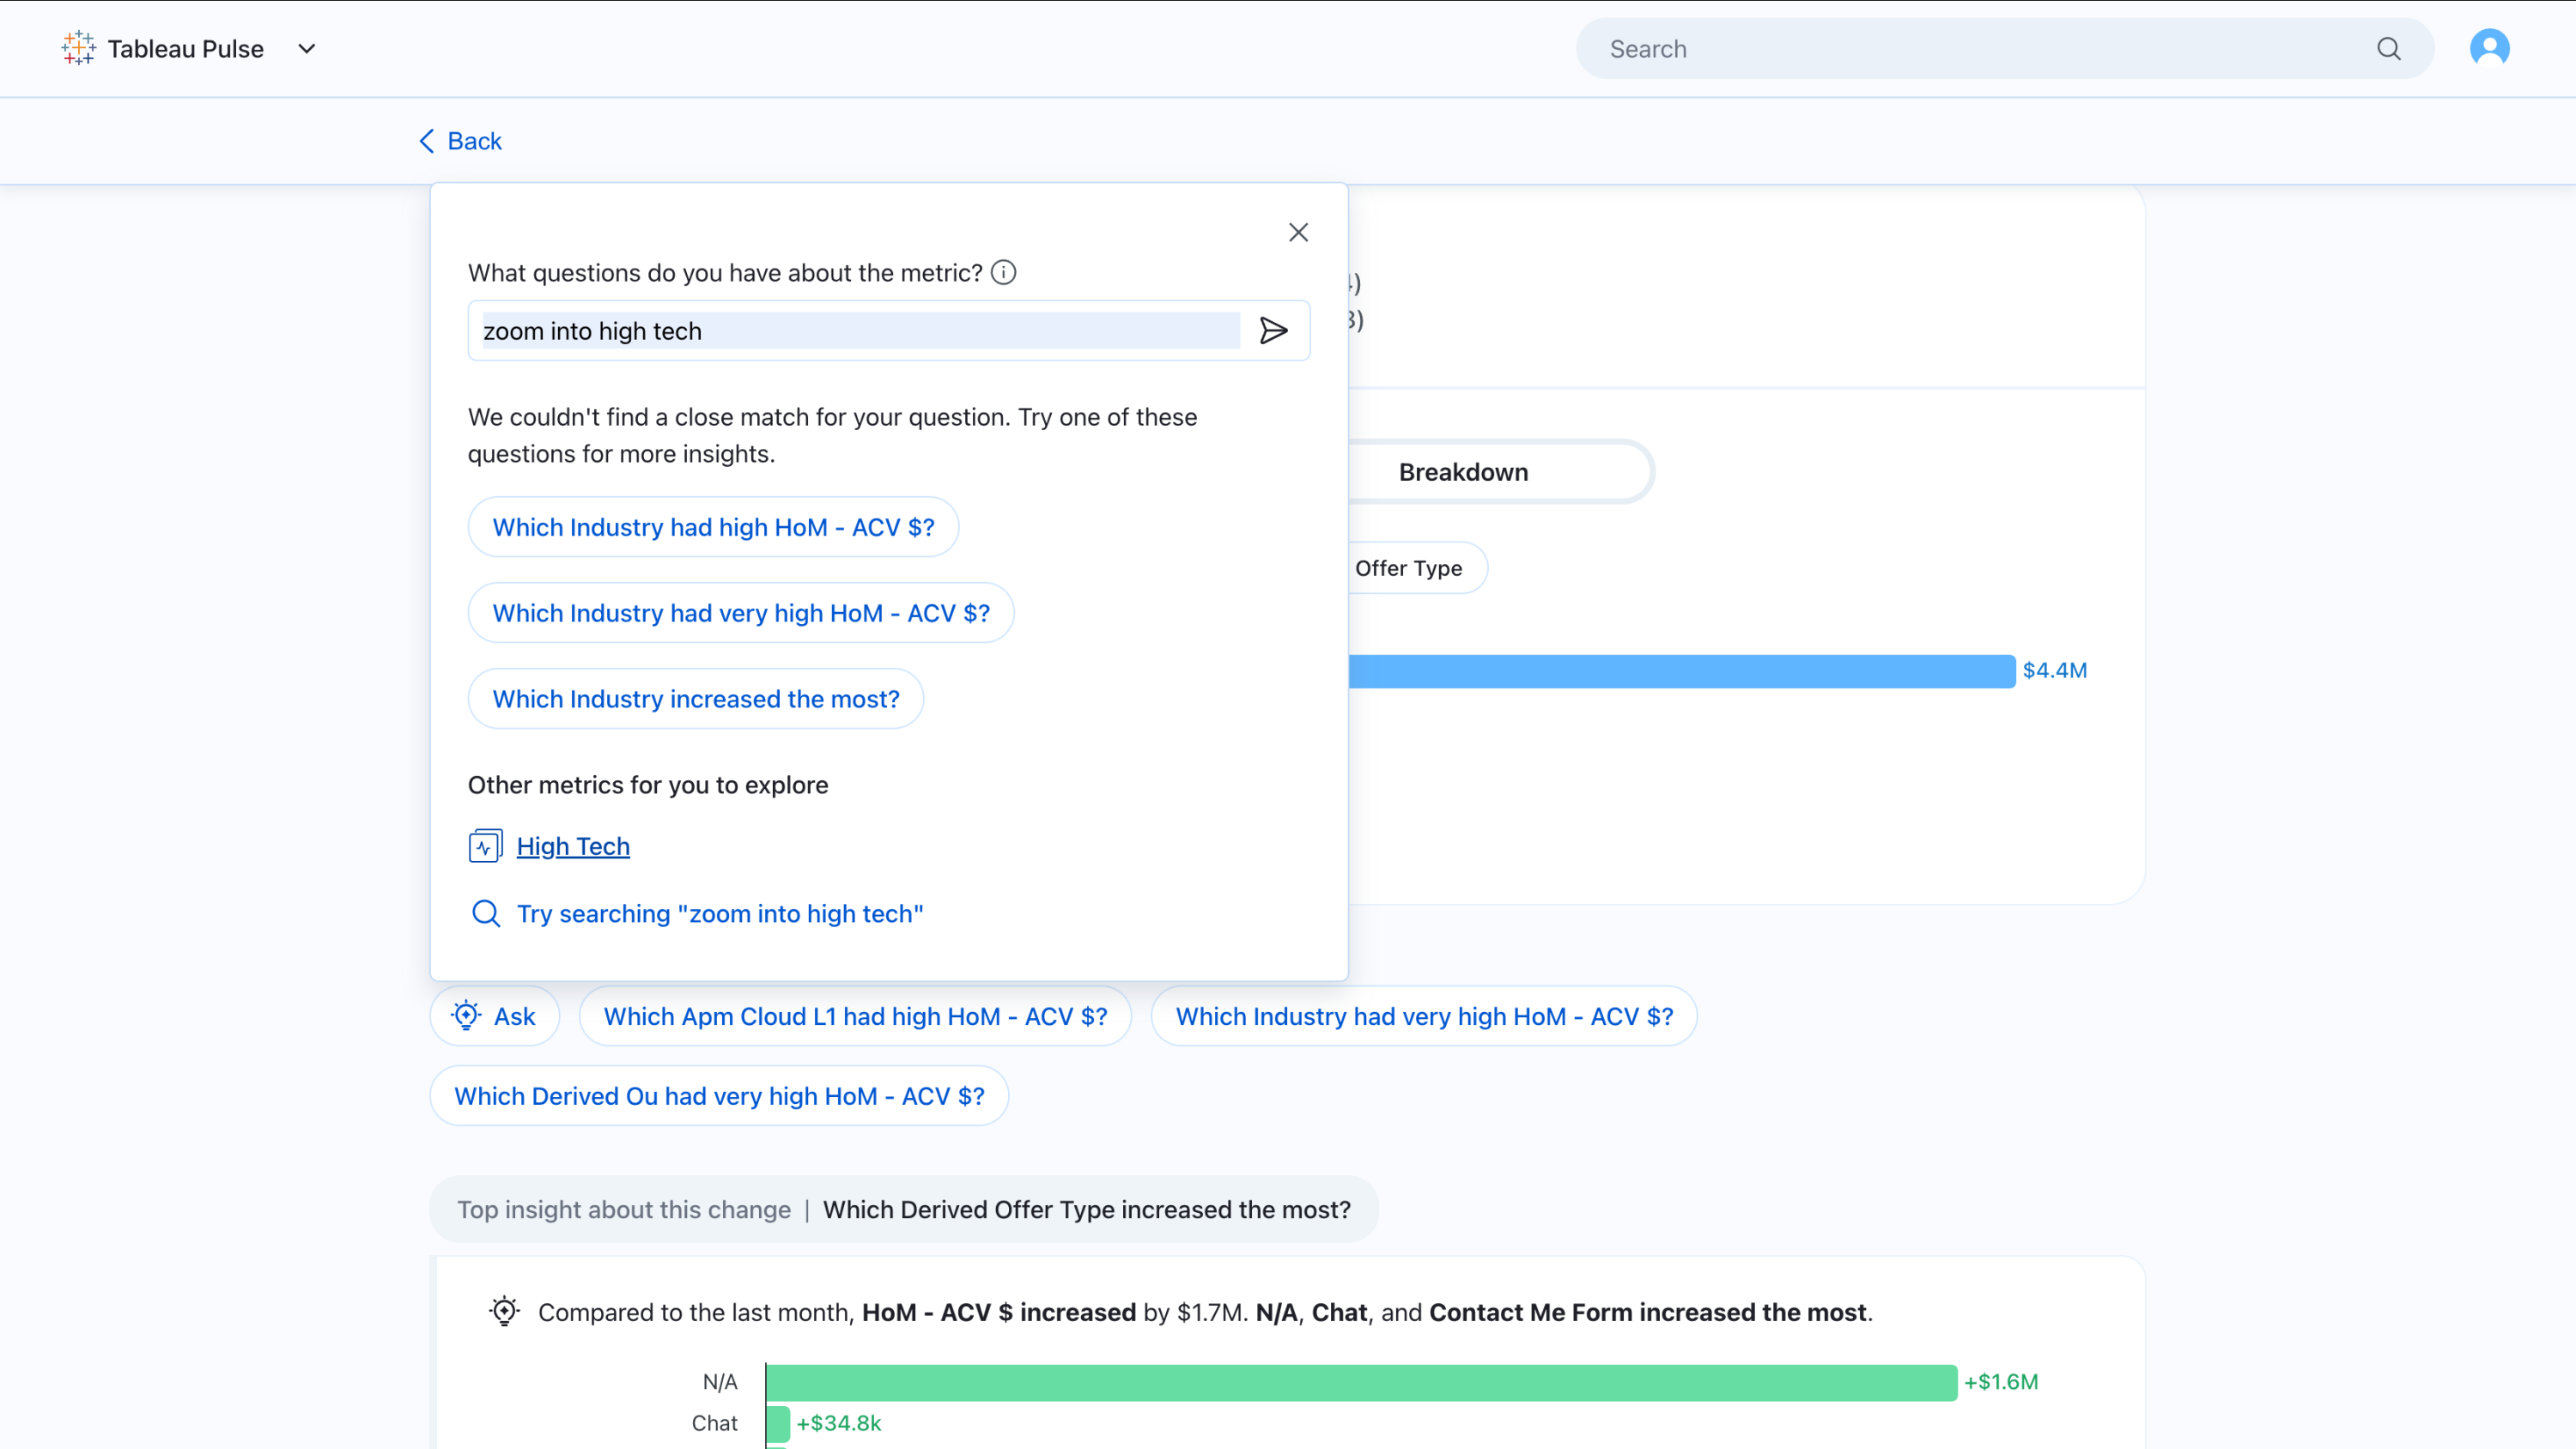
Tableau Pulse: Enhanced Ask - Related Metrics
Answer questions extending beyond what Pulse insights previously detected. Ask about another metric from the same metric definition to better discover relevant insights.
*This is a premium capability available in Tableau+, released August 2024
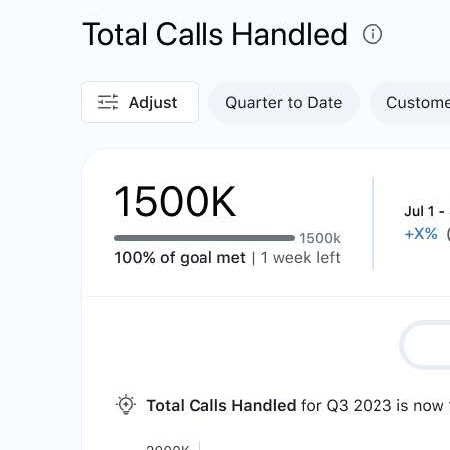
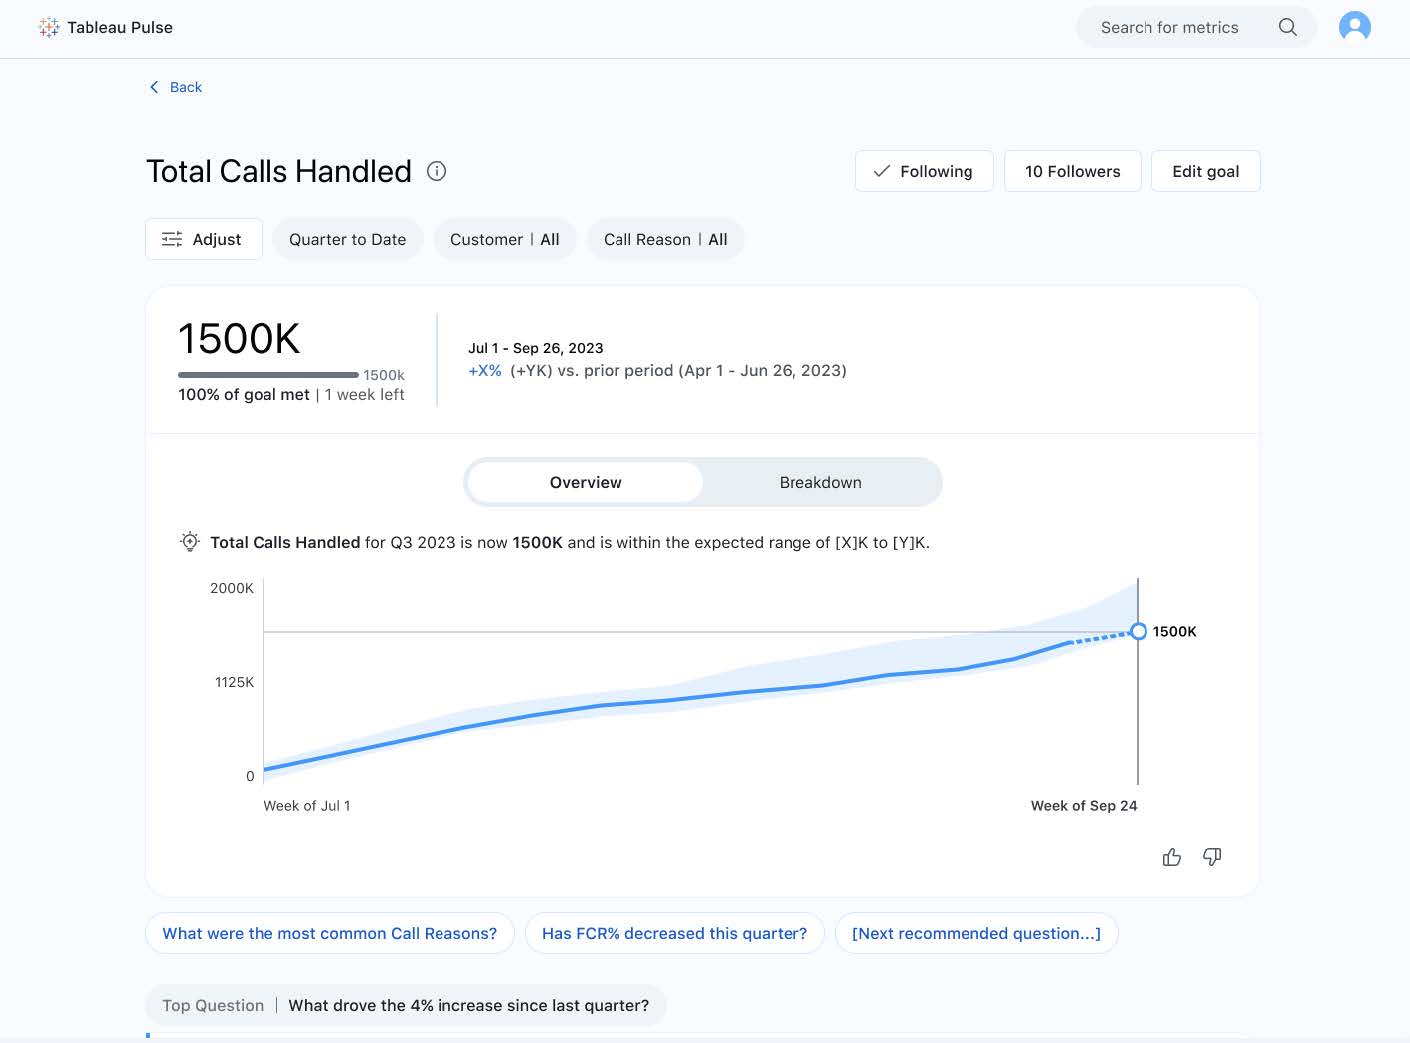
Tableau Pulse: Manually Created Goals
Set a goal in the Insight Exploration page and monitor metric performance against that goal across workflows. Analytics professionals can restrict who can create, edit and delete manual goals associated with a metric definition to ensure only authorized users can make changes.
*This is a premium capability available in Tableau+, released August 2024
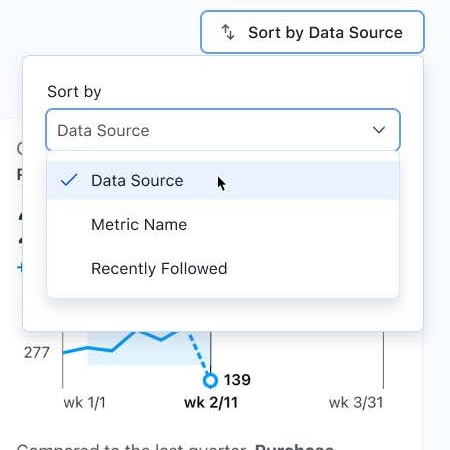
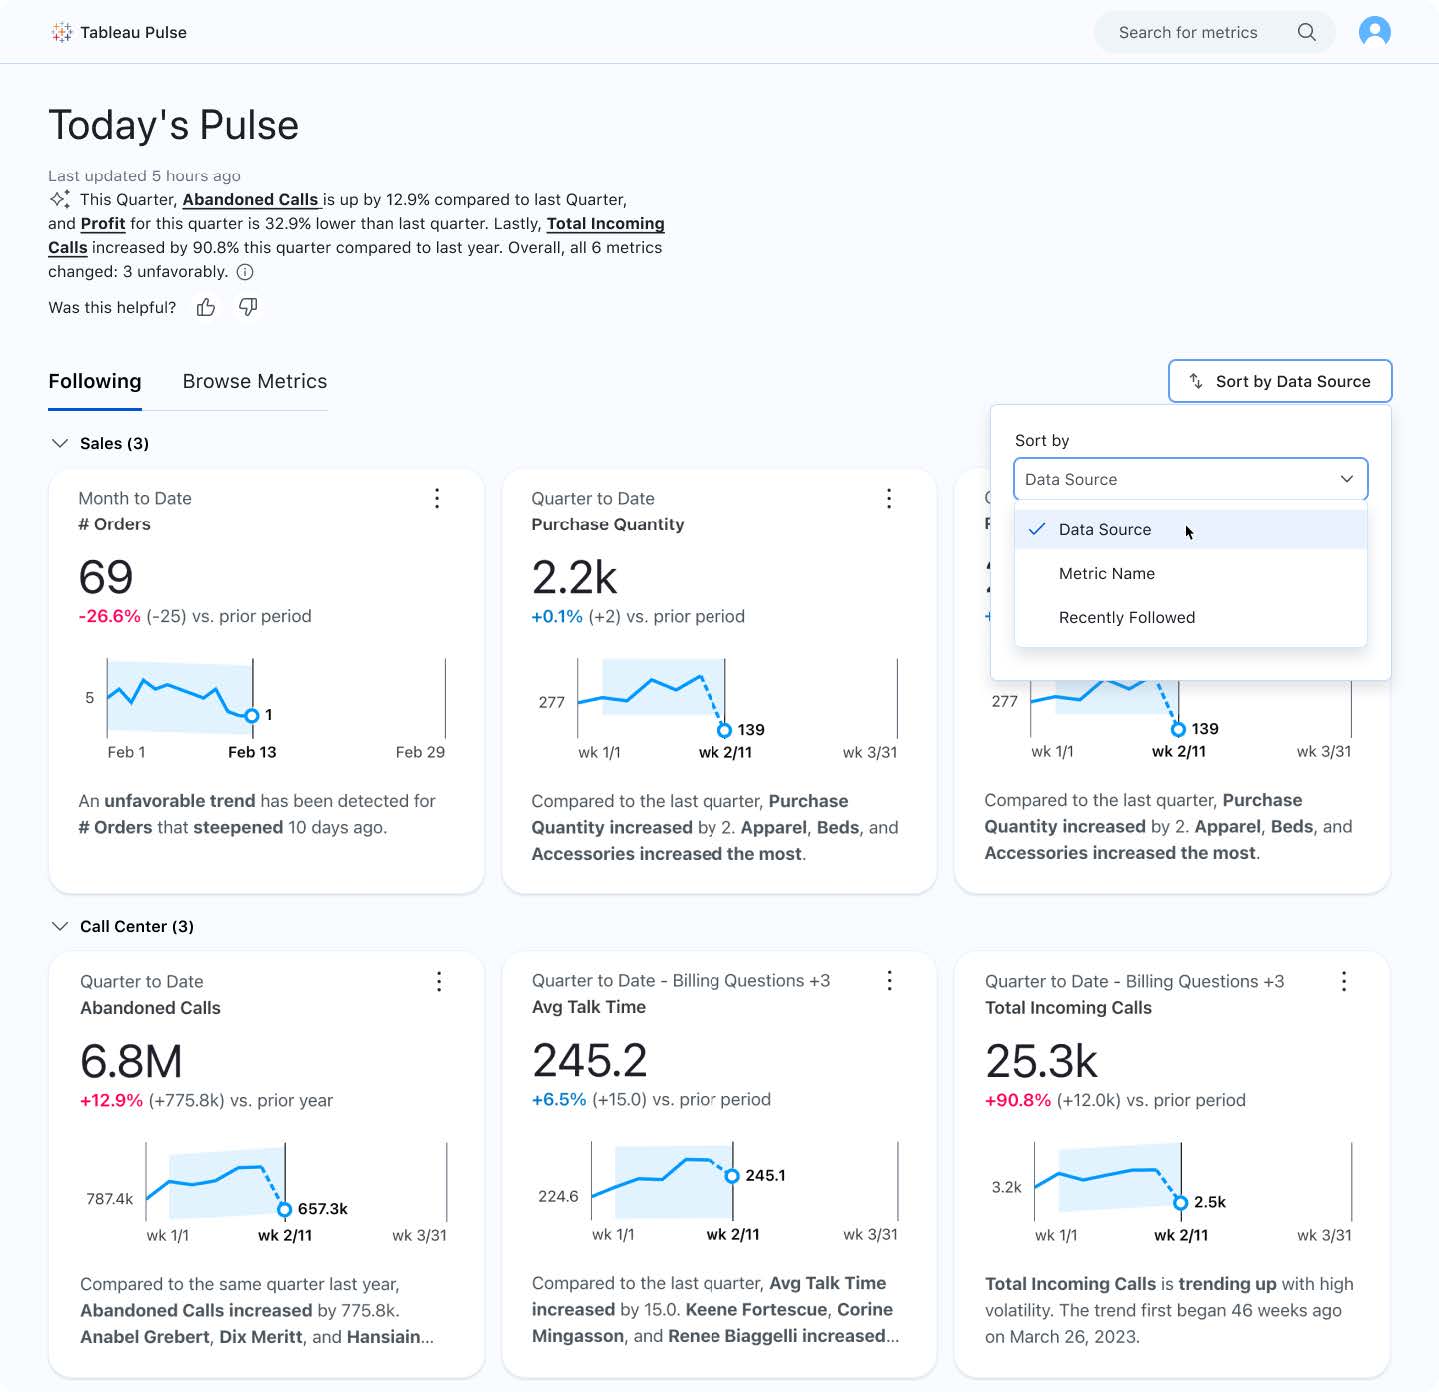
Tableau Pulse: Dynamic Sorting & Grouping
Sort and arrange your metrics leveraging metadata such as metric name, data source, and time range. This feature allows you to organize and evaluate related metrics together. Detect important patterns and trends in your data with a flexible and user-friendly method for organizing and grouping metrics.
*This is a premium capability available in Tableau+, released August 2024
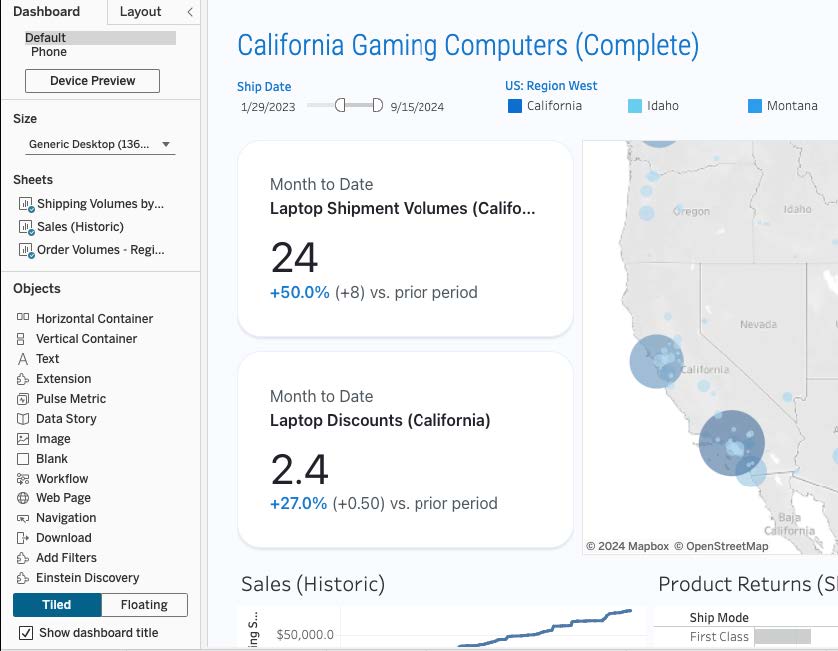
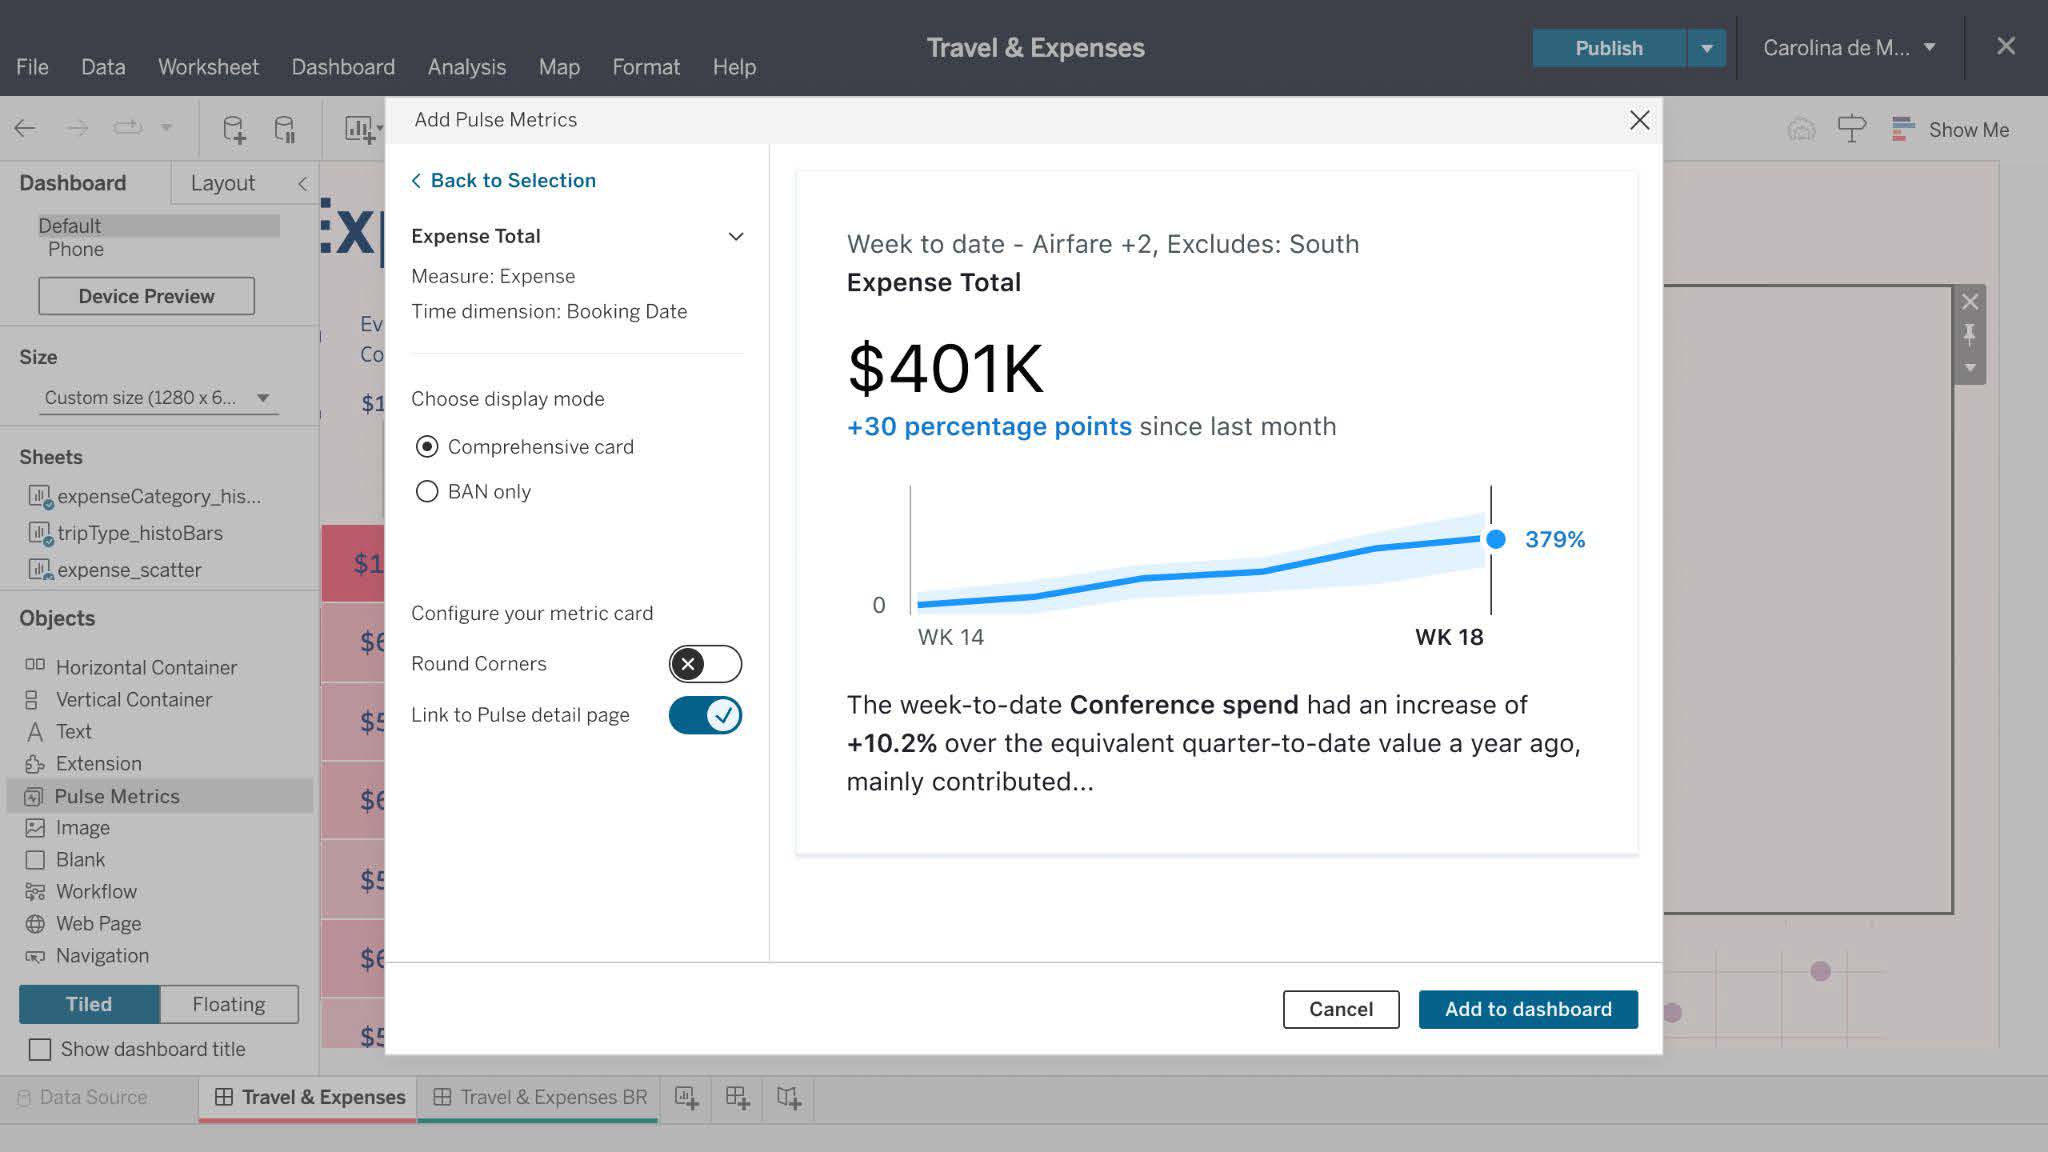
Tableau Pulse: Metrics in Dashboards
Tableau dashboard creators can now embed Pulse metrics using a built-in dashboard object available in both Desktop and Server dashboard authoring. By embedding Pulse metrics in operational, strategic, and performance dashboards, users can click on a metric to navigate to its detail page, where they can delve deeper into metric trends and readable insights. *Released August 2024

Tableau Pulse: Popular Metrics
Tableau Pulse helps you discover metrics more easily by exposing metric follower count in the insight exploration page and metric search. *Released August 2024

GAI Profile Organization
Organizing your Tableau Public profile has never been easier. Seamlessly organize the vizzes on your Tableau Public profile page into unique categories using Tableau AI. Alternatively, opt for manual categorization to have complete control over how your vizzes are displayed.
Exchange on Tableau Public
Discover free dashboard and viz extensions available for Tableau Public web authoring and Tableau Desktop Public Edition. Enhance your visual analysis with additional functionalities and viz types. Expand the core capabilities of Tableau Public to elevate your data analytics portfolio and uncover new insights with customized vizzes and dashboards.
Bridge Support for Taco Files
A subset of connectors in the Tableau Exchange are now enabled for Tableau Cloud through Bridge, making your data more accessible and easier for you to connect to.
Supported connectors include Actian JDBC, Altinity Connector for ClickHouse, Guidanz BI Connector, Couchbase Analytics, Stratio Crossdata, Data, Virtuality JDBC, Jethro ODBC, Oracle NetSuite, SAP Successfactors, ServiceNow, SingleStoreDB JDBC
Bridge Support for Embedded Flat Files
For Tableau Bridge on Windows, embed flat files into your Tableau workbook directly and receive greater access to file-based sources. Save time refreshing embedded Excel, CSV, PDF, and spatial files.
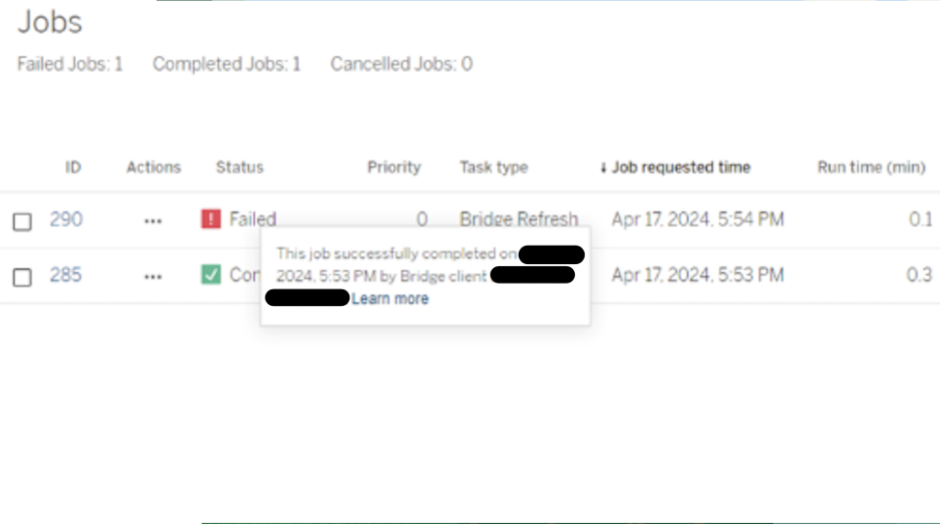
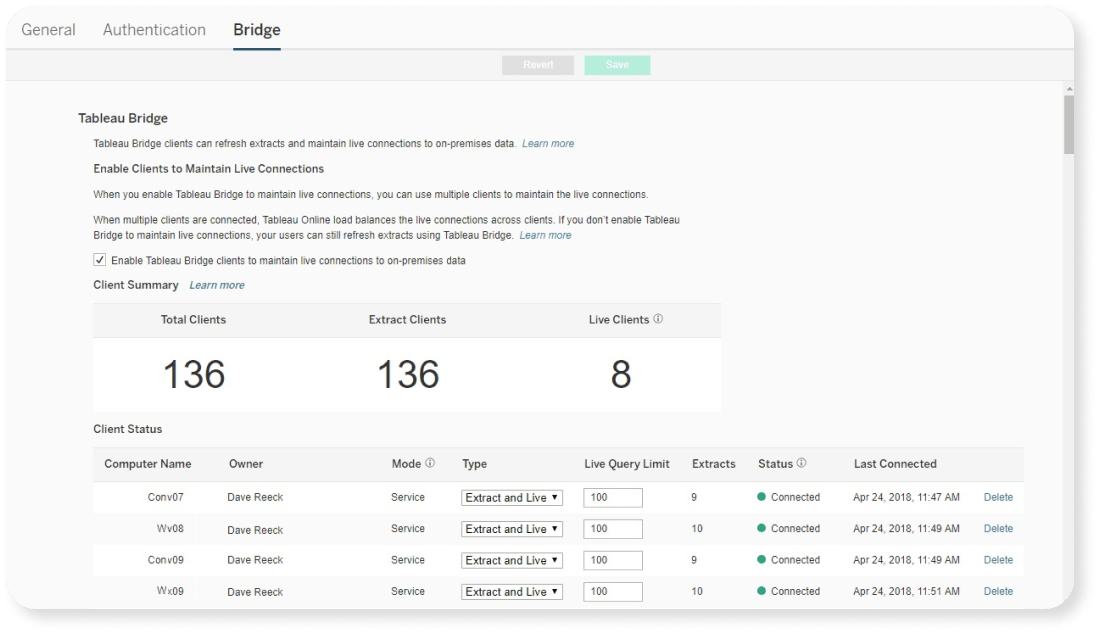
Bridge Performance and Monitoring Improvements
Analyze data faster and with more trust in Tableau Bridge. Live queries and Embedded Extracts are significantly faster (20%+) on both Windows and Linux, and the Jobs page now provides real-time status updates. If you're using Bridge, you will see faster performance on your Jobs and be able to resolve issues with relevant troubleshooting information.
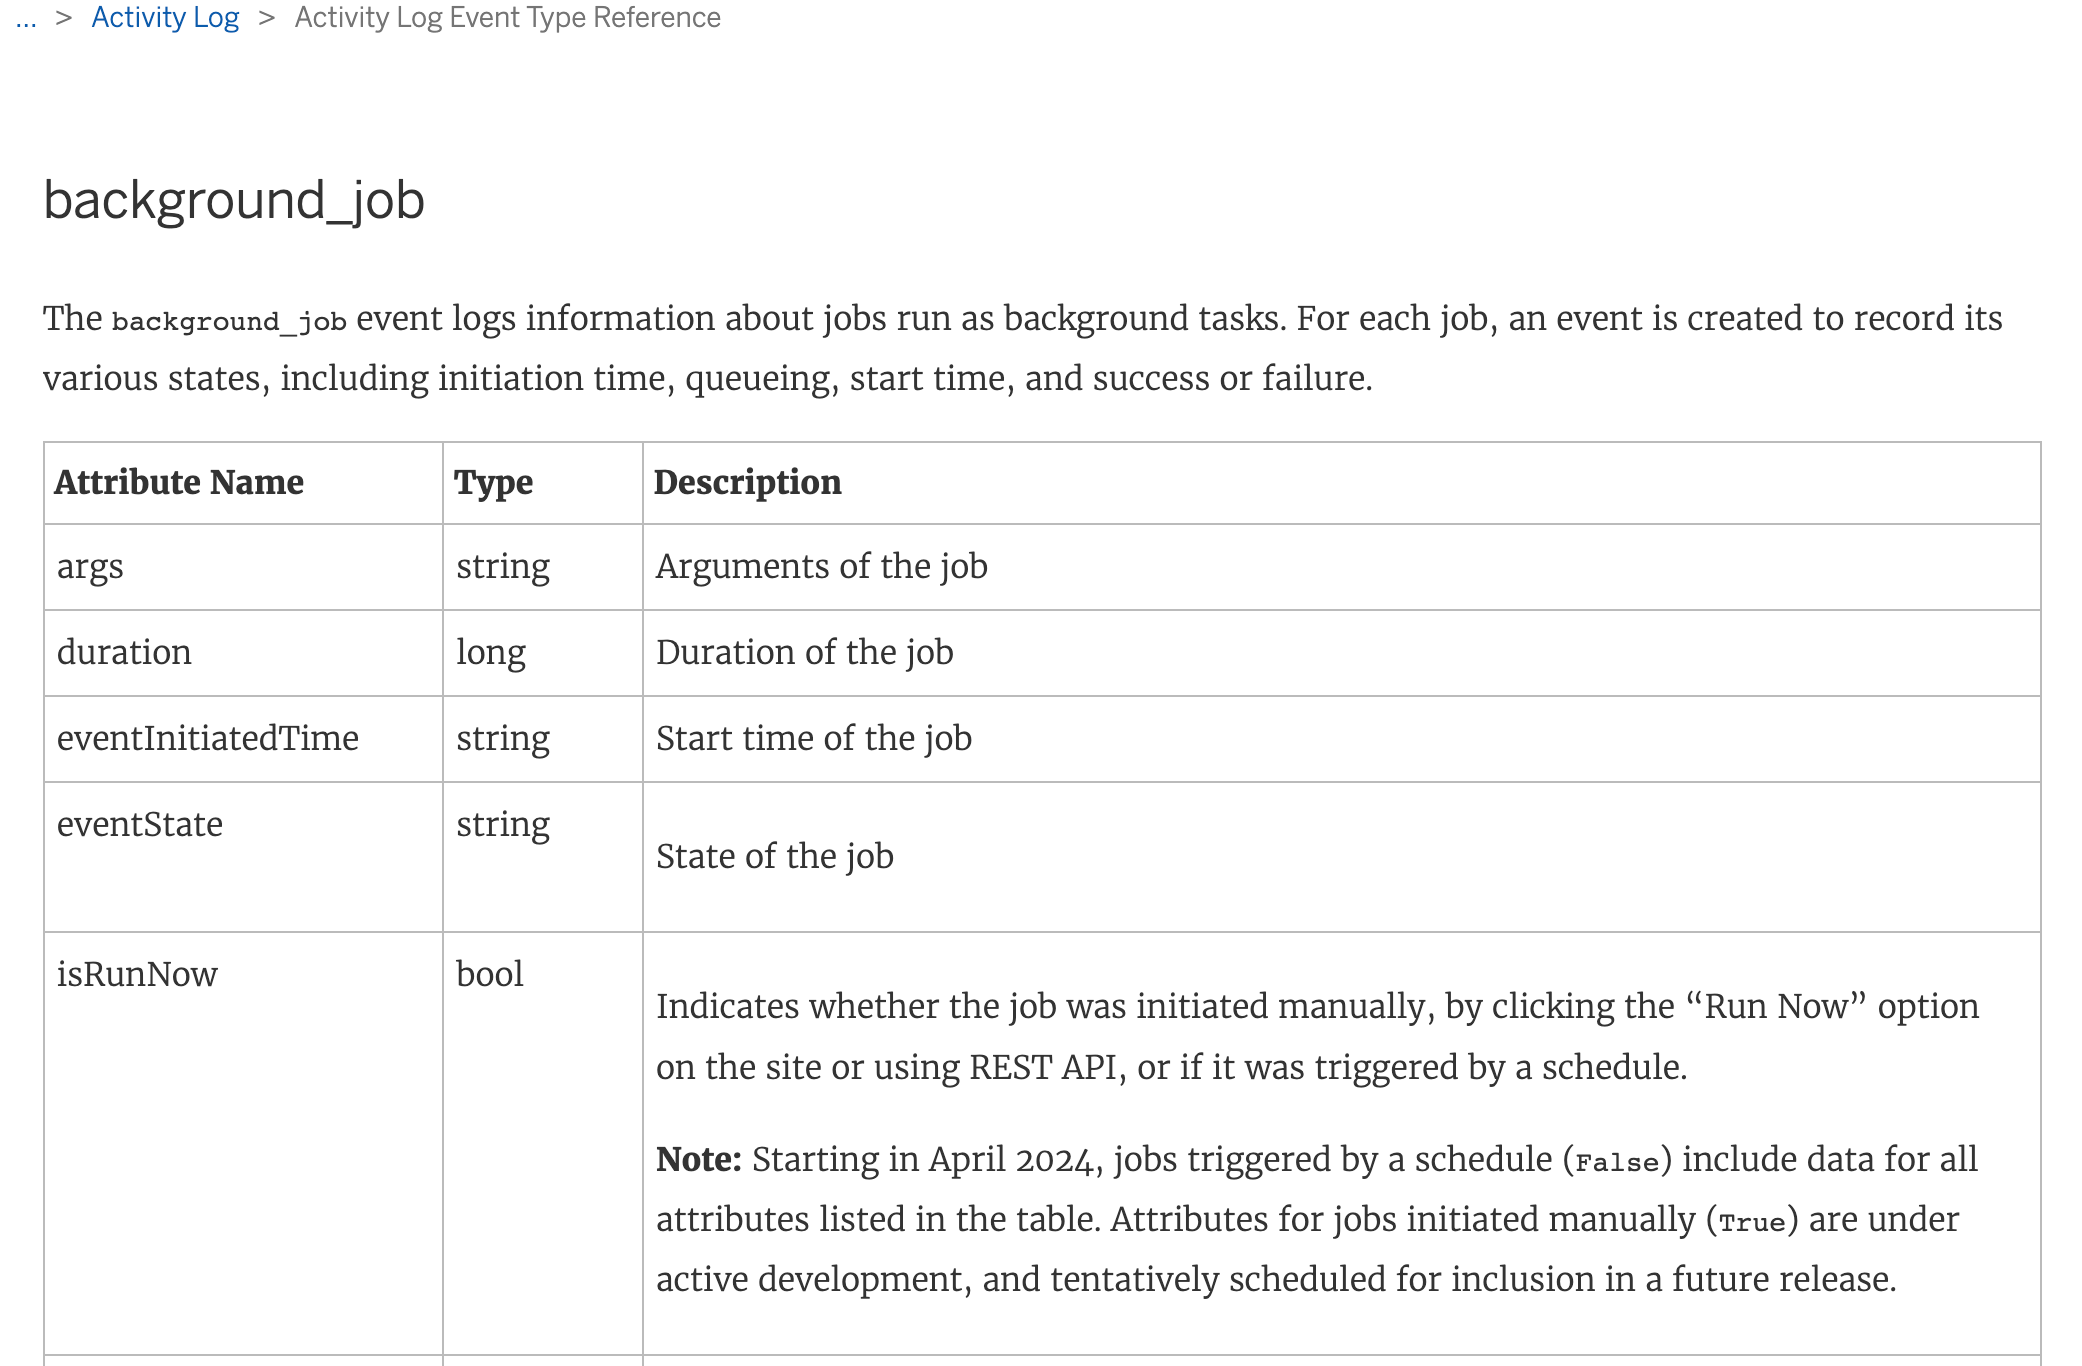
Activity Log Enhancements
Monitor extract refreshes in real time to meet data freshness requirements. Ensure data is up-to-date and quickly troubleshoot problems with the background_job event type.
SAP HANA Authentication Improvements
Enhance the security of your connection to SAP HANA from Tableau Cloud. Connect to SAP HANA using an OAuth (JWT) and use your existing access policies.
Note: Available in a weekly release after the initial availability of 2024.3.
Maintain Folder Structure when Mapping Data with Accelerators
Analysts can easily get started with Tableau dashboards using Accelerators and maintain field structure and categorization.
Migrate Embedded OAuth Credentials
When migrating from Tableau Server to Tableau Cloud, admins need to be able to migrate OAuth credentials embedded in data sources and workbooks programmatically and at scale. New REST API methods will allow admins to programmatically download credentials from Tableau Server and re-upload them to their Tableau Cloud site.
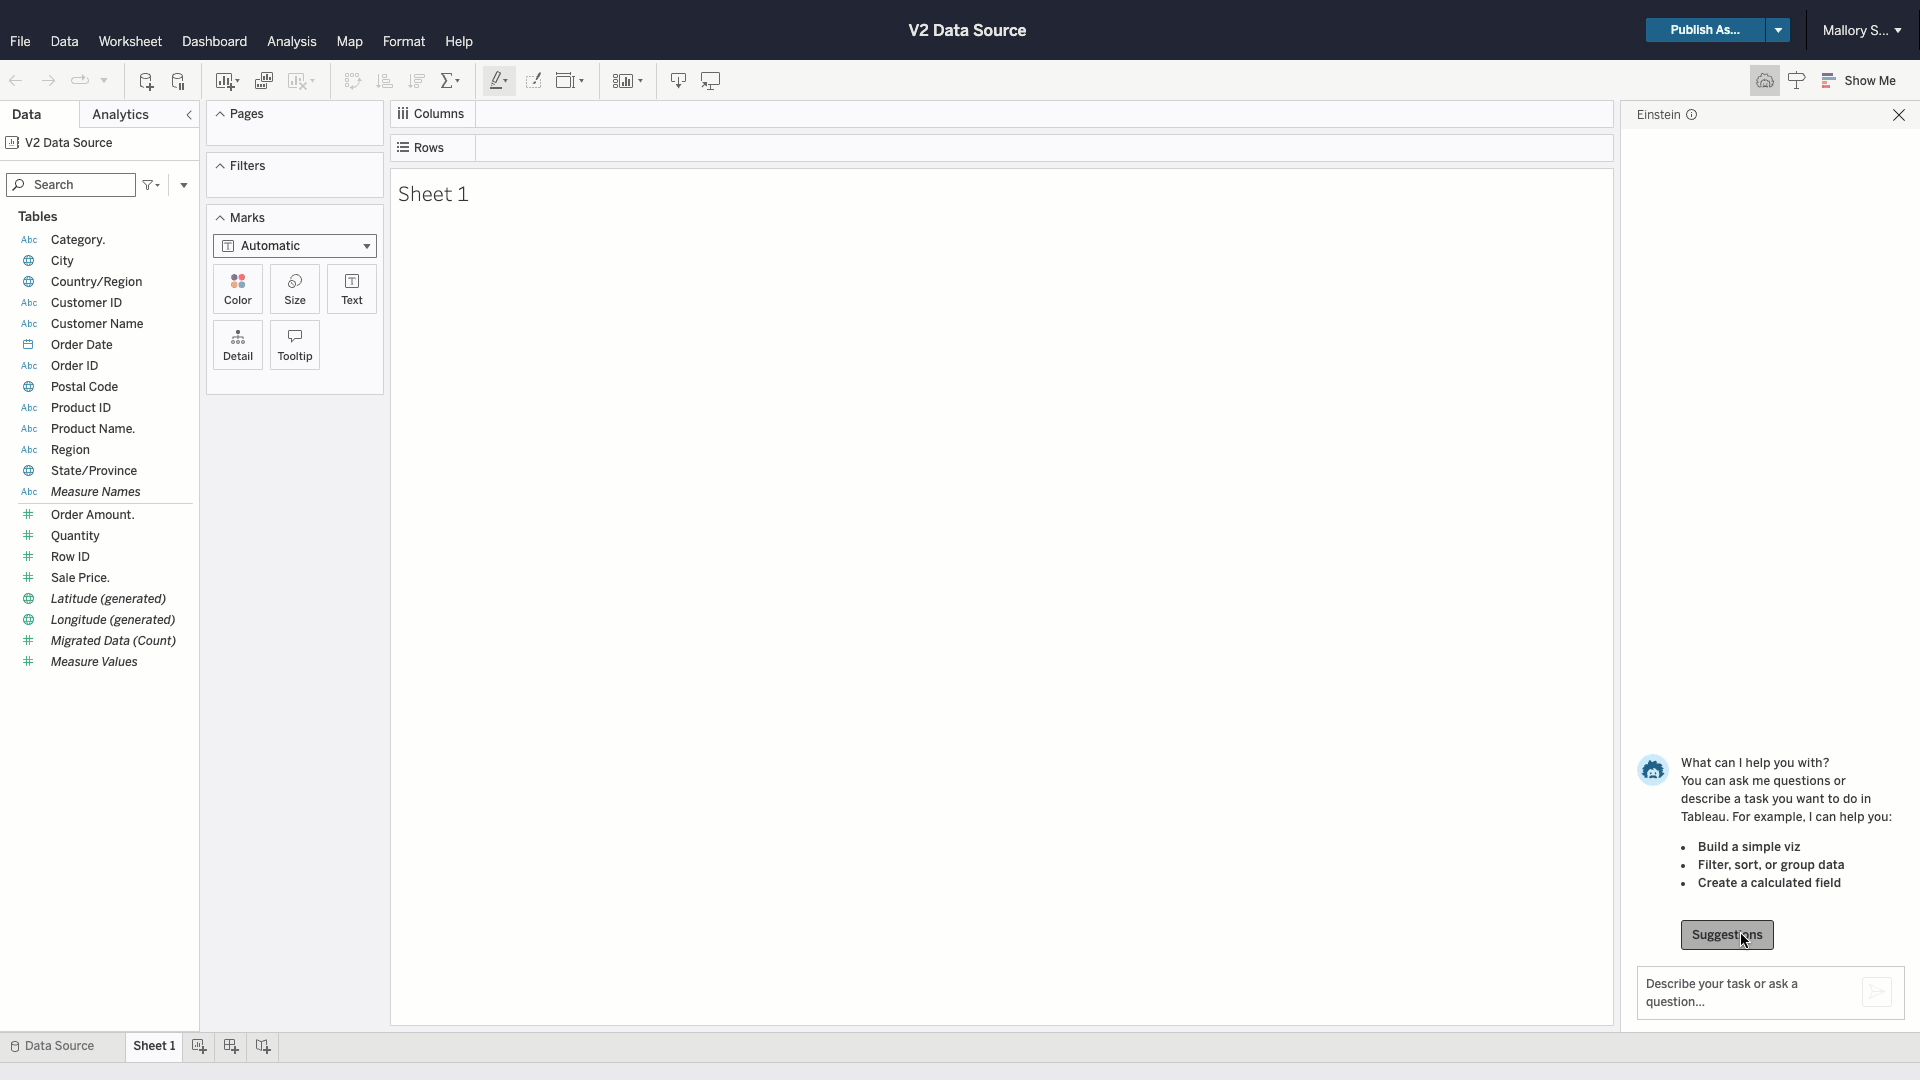
Tableau Agent: Web Authoring
Simplify the analytics process with the help of a trusted AI assistant. Transform natural language prompts into visualizations, formulate calculations to enhance your analysis, and get suggested questions based on your data. Tableau Agent will work with you, so you can move freely between manual drag and drop actions and formula editing to communicating requests with your agent.
Learn More About Tableau Releases