
Learning
Get Your Data Tableau-Ready
Tableau loves well-structured data. We'll show you how to best organize your data to make analysis in Tableau a breeze.
If you have data files, you can use these tips to get them ready for Tableau. If your data lives in a database and you're having trouble accessing it, check out our drivers page or contact your internal data expert for access.
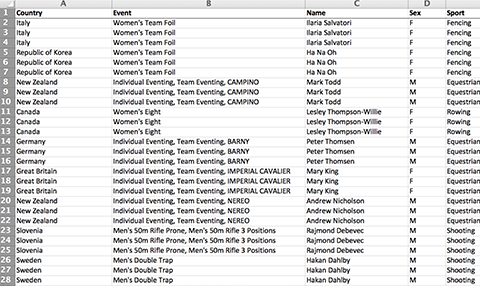
This is what your data should look like
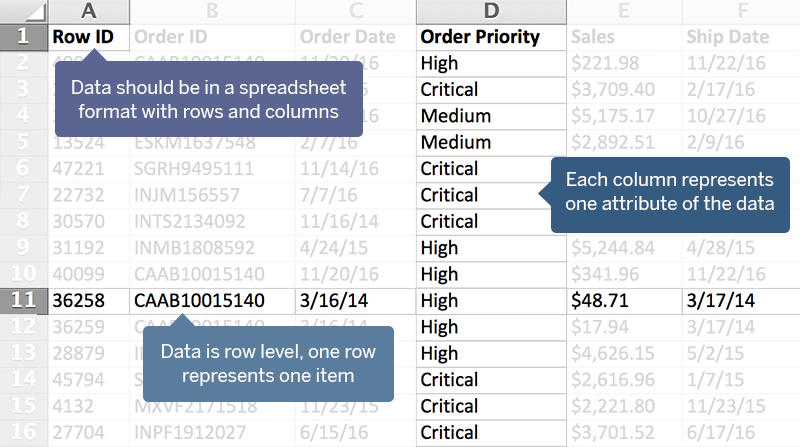
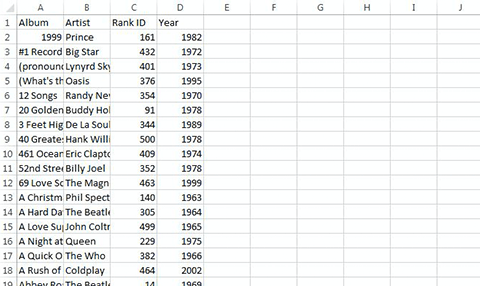
Tidy data = easy analysis
For best success with Tableau, your data should be formatted like a table or spreadsheet as seen here. If your data needs to be prepped before you use it, read on for details on Tableau’s built-in tools to help.
How to clean up your data
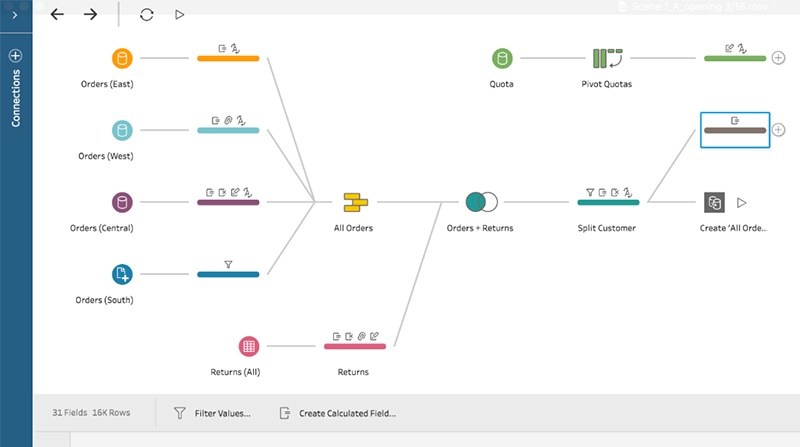
Tableau Prep
Tableau Prep will get your data analysis-ready by helping you quickly and confidently combine, shape, and clean your data. The flexible, visual experience of Tableau Prep gives you a deeper understanding of your data. It makes common, yet complex tasks like joins, unions, pivots and aggregations simple and visual. With your Creator license, you get access to Tableau Prep.
Use Tableau Prep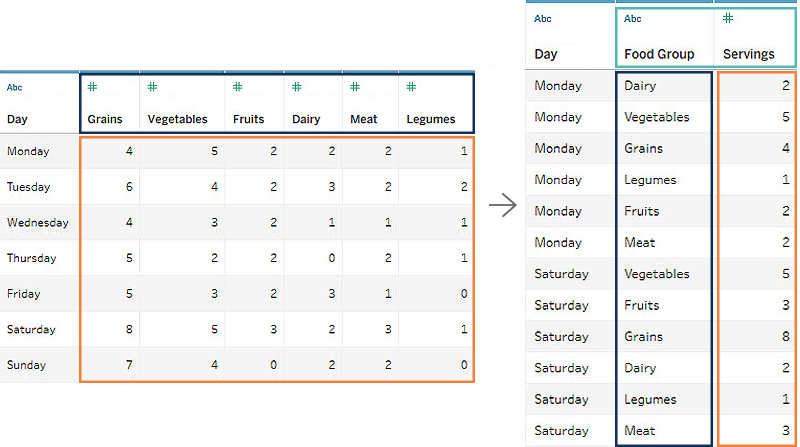
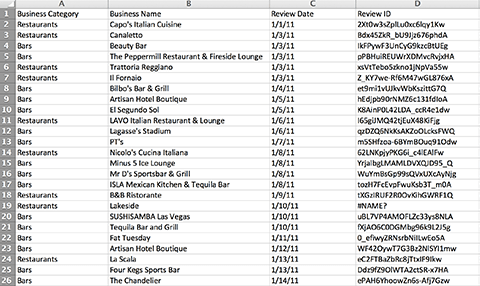
Pivot
Analyzing data stored in a crosstab format can be difficult. When one type of information is stored in multiple columns, pivoting the data from columns to rows makes the data much easier to work with. Tableau's native pivot option makes this operation easy.
Pivot your data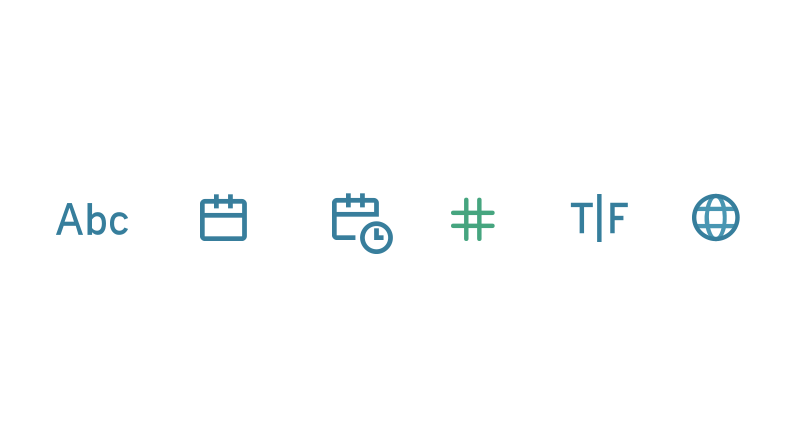
Data types
Each field has an icon that represents its data type. This helps Tableau understand how the data should be formatted, interpreted, and used. For example, geographic fields can be mapped and Boolean fields contain only two possible values: true or false. You can change the data type by clicking on the icon.
Change data types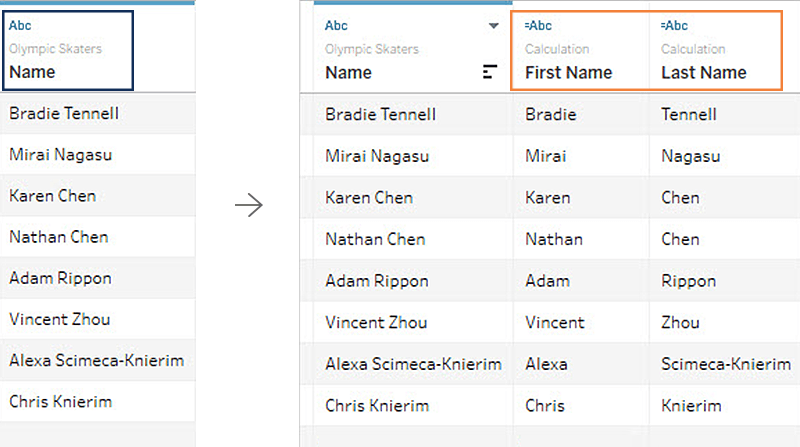
Split fields into multiple fields
Your data may contain multiple units of information in a single field. A common example of this is the first and last name of a customer in one column. In these cases, it’s often easier to analyze the data if you have a column for each piece of information. You can use split or custom split capabilities in Tableau to separate the values into multiple columns.
Split fieldsSimple data prep in Tableau Desktop
Use Tableau Desktop to tidy up your data
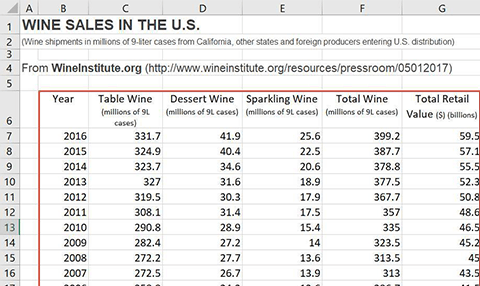
Data Interpreter
The Data Interpreter lives within Tableau Desktop. After connecting to data, if Tableau detects sub-tables in your data, you'll be presented with the option to turn on Data Interpreter. The Data Interpreter will draw out sub-tables and exclude any extraneous information.
Use the Data InterpreterMore data structure troubleshooting
Check out suggestions for other common formatting issues that can make analyzing your data in Tableau challenging.
Format your survey data for Tableau
Raw survey data can be tricky to handle. One of our Tableau Visionaries, Steve Wexler, makes it easier with these detailed instructions.