Using Tableau to Break Through the Limitations of Conventional Data Analysis
Agile Development and Cost Reduction Through Insourcing
Faster Decision-making via DX

Members of the Global Transaction Banking Dept. Business Development & Risk Management Team (From left: Maeda, Ko, Muramatsu, Izuma, Nakano)
Background of Implementation
Mizuho Bank,Ltd. provides banking services and other financial services primarily to individuals, SMEs, large corporations, financial and public sectors, and both Japanese and non-Japanese companies overseas. The Global Transaction Banking Dept. Business Development & Risk Management Team is responsible for planning Mizuho's transaction banking business worldwide.
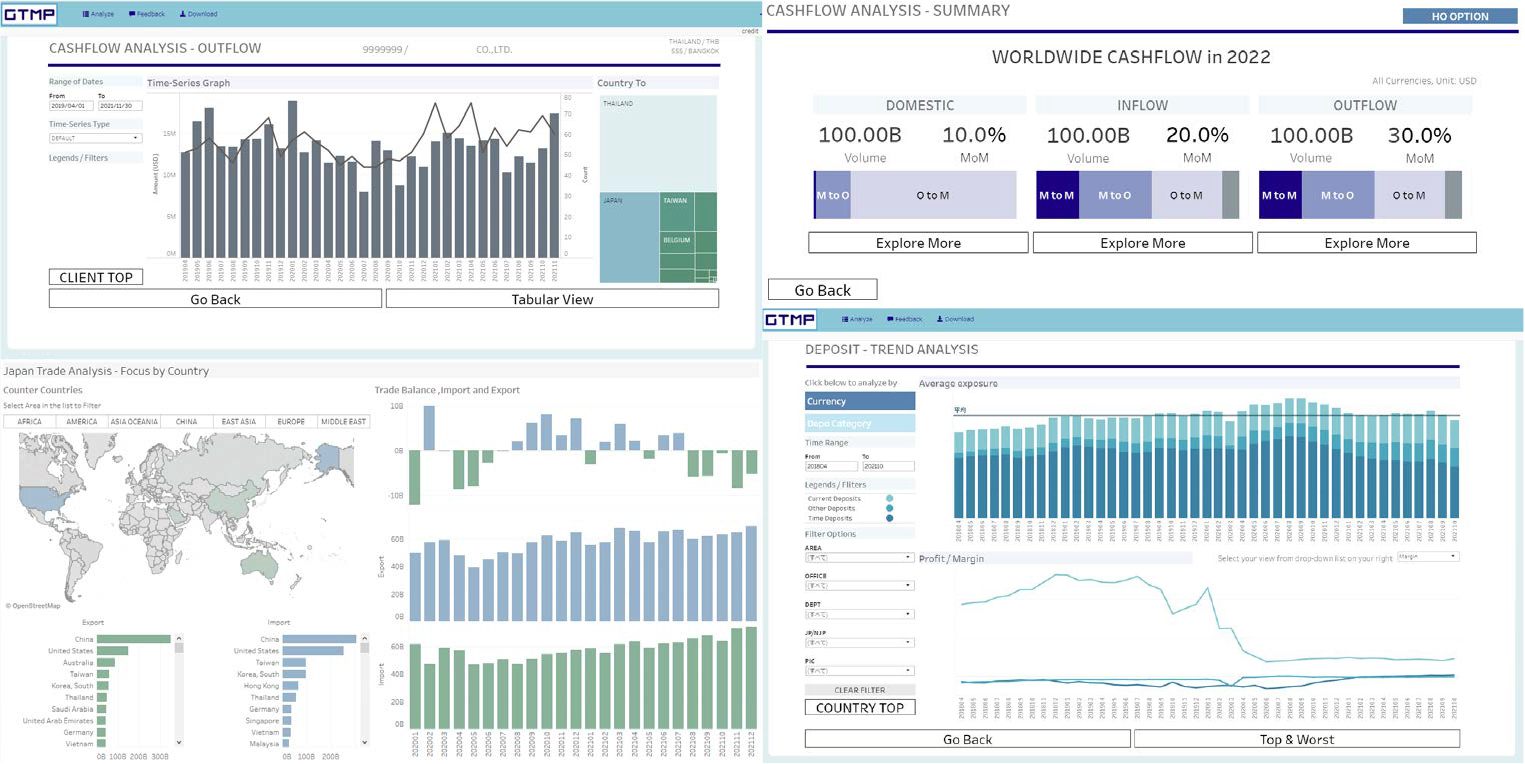
”For Global Transaction Banking Sales, before proposing a solution to a customer, we need to thoroughly understand the customer’s cash flow situation by looking at the amount of funds being transferred globally across the entirety of Mizuho Bank as well as visualizing Mizuho Bank's transaction data for each customer,” says Yoshisuke Maeda, Managing Director of the Business Development & Risk Management Team. He claims that there is a massive amount of data to be analyzed for that purpose, and it is not uncommon for the amount of data to exceed millions of units per month.
”In the past, we would download data in CSV format from several servers and import it into a database product for analysis,” says Shiori Muramatsu, Vice President of the Business Development & Risk Management Team. She reflected that highly time-consuming data aggregation work would be performed dozens of times every month. “Moreover, there was a limitation on the volume of data we could handle at one time, and depending on the objective of the report, we had to do some aggregation in advance to avoid exceeding that limitation.” Feeling they were being held back by this, Muramatsu chose Tableau as a way to resolve their issues. They first began using Tableau Desktop in April 2018. To spread the benefits throughout the entire organization, she created proposals for projects and presented them to Maeda.
Reflecting on that time, Maeda said, “I was impressed not only by the content of the presentations, but also by how strongly she felt about it”. “At the time, we were actually considering ways to enhance our competitiveness in the Asia region. I determined Muramatsu’s proposal would be a big contribution to those efforts, so I decided to give a greenlight for the launch of the project.”
Tableau Implementation and Operation
The project was officially approved in October 2019. Muramatsu worked to push the project forward together with Nobuko Izuma, who is also Vice President of the Business Development & Risk Management Team. In July 2020, Ahra Ko joined the team as a key member. In August 2020, the first production release was carried out to provide planning analysis functionality for Tokyo headquarters.
Izuma explains the system configuration as follows.
“We used AWS because of an umbrella agreement with our IT Department, and we built an environment that could run Tableau Desktop, Prep, and Tableau Server. For ETL (Extract/Transform/Load), we outsource data that is important or needs complex processing, and other data is processed by users using Tableau Prep.”
In addition to building this environment, we also actively conducted an internal promotion to increase the number of users within the bank. “Not only did we want to educate users, we wanted to make the whole organization data driven. We added our own elements to the Tableau Blueprint, which was introduced by the Tableau Customer Success Team, and created a roadmap,” says Muramatsu. “Based on this roadmap, we are working to find personnel capable of using Tableau in advance, both in Japan and overseas, and we have personnel take official training programs hosted by Tableau, amongst other initiatives.”
This contributed to promote understanding of Tableau, not only within the department but amongst personnel in a wide range of relevant departments, and increased the number of Tableau users to around 300. Fifteen people have already participated in the training session held for talent discovery purposes.
The benefits of Tableau are, firstly how data extraction and processing can be performed easily and quickly. Secondly, features that were achieved by writing and using web programs can be easily achieved in dashboards. Thirdly, you can distribute dashboards easily and with finely tuned conditions.

Why Tableau?
So why did Muramatsu choose Tableau for a data analysis platform? Muramatsu gives three main reasons.
First of all, Tableau can produce high-level visual representations of cash flow data, which contain a high volume of data for each record and are difficult to handle. “In order to understand cash flow status, it is necessary to use dynamic visualizations that enable you to drill down from aggregate data to check on specific details, then return back to aggregate data again. With Tableau, this can be accomplished with a single click of the mouse. For example, you can show the movement of funds for specific regions on a map.”
Secondly, Tableau has a data update alert feature. By sending a notification email to users right when data is updated, “Client data will go directly to the user, who is in charge of the sales,” says Muramatsu, describing how Tableau makes it easier to utilize data.
Finally, Tableau can be used for agile development that responds to ever-changing user needs. “I am in charge of developing and improving dashboards based on user requests,” says Ahra Ko. “I can immediately have users see the dashboard I create and have total control to change it on the spot, enabling me to quickly respond to user feedback.” The Business Development & Risk Management Team has already created over 100 dashboards, and some of those are improved and updated every day.
Benefits of Tableau Implementation
By implementing Tableau on the company platform as a business intelligence (BI) tool, the Global Transaction Banking Dept. has seen the following benefits.
1. Agile Development and Cost Reduction Through Insourcing
By insourcing most dashboard creation, we have reduced costs for work that was previously outsourced. Development speed has also increased dramatically. After training and some hands-on experience, we think even non-IT personnel can develop their own dashboards.
2. Faster Decision-making via DX
Over 100 dashboards have been created in the year after implementation, and 80% of those were for information that could not previously be visualized. It is also possible to conduct analysis that goes back and forth between macro and micro perspectives, which means both planning and sales are able to use Tableau to help them make decisions quickly.
3. Taking work styles and customer solutions to the next level through an enhanced data-driven approach
Whereas previously data analysis required months, high-quality analysis can now be done at incredible speeds in days or weeks. The alert feature prompts Sales to take their action, making it easier to bring up customer data in Tableau to find an opening for a sales pitch before a customer visit, amongst other things.
In the future, with Tableau, we hope to make not only dashboards that help global Sales but also dashboards that help management with strategy formulation.

Future Developments
These initiatives are viewed highly throughout the entire Mizuho Group. Yuichi Hirano, Assistant to the Director in the Security & Data Management Dept. at Mizuho Financial Group, gave the following comments.
“I view the use of Tableau in the Global Transaction Banking Dept. as a good example of a tool’s advantages fitting well with the needs of the bank’s business arm. In our department, we provide support for data-related problem-solving and develop frameworks to support the implementation of business policy at Mizuho. Through initiatives like this, we hope to provide the support that the business arm needs to utilize the tools best suited to its objectives.”
The plan for 2021 and beyond is to enable more overseas offices to use Tableau and add sales support functionality. “Our goal is to promote global cooperation,” says Muramatsu. “Ultimately, we would like to create a shared platform that can be used to view the same data all over the world.”