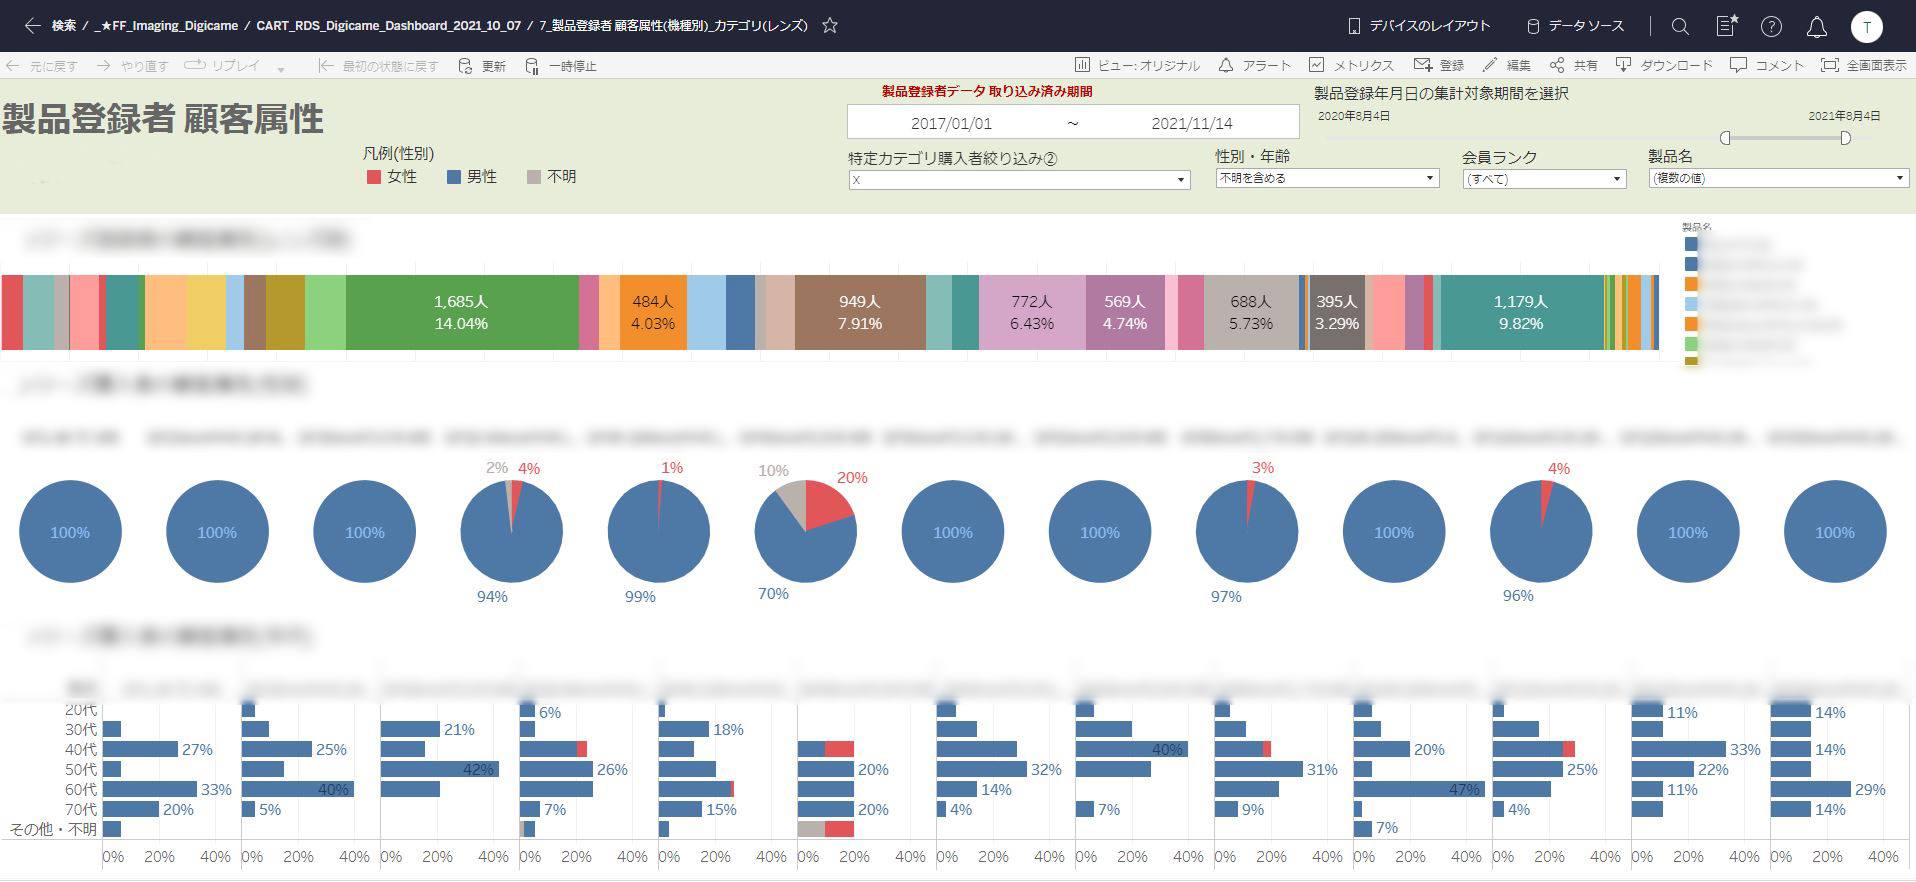
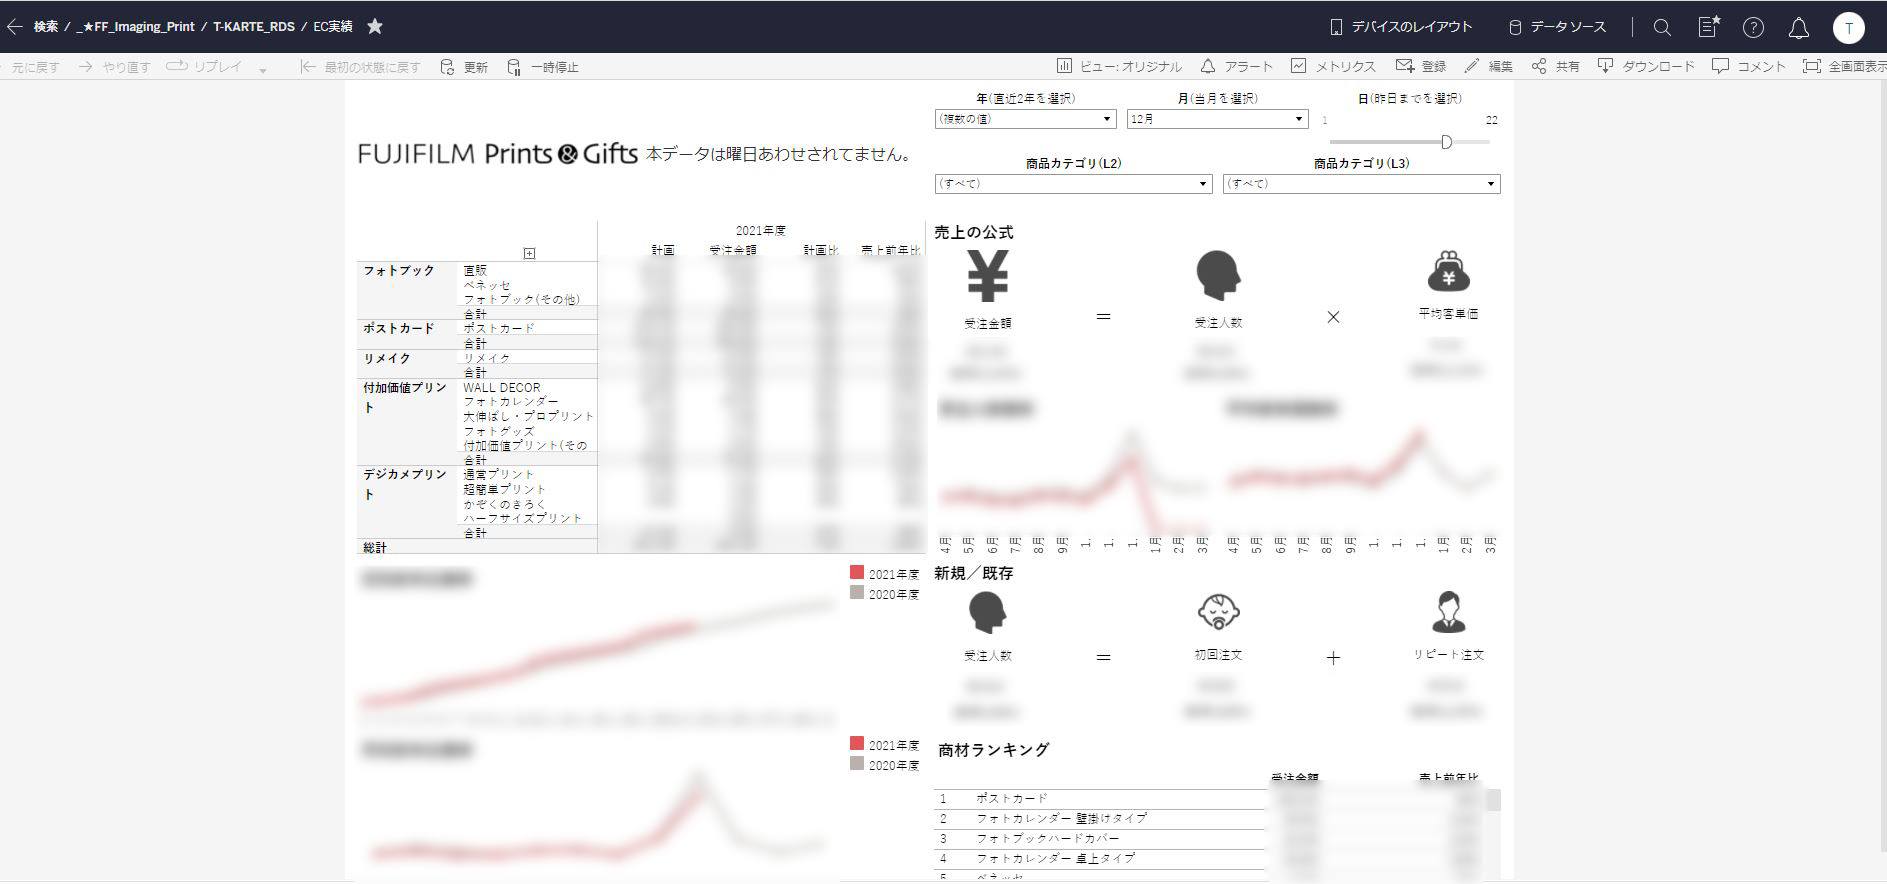
Tableau Used to Manage FUJIFILM Print & Gifts
High-precision Policy Development
Speedy Meetings and Decision-making
Background to Implementation
Establishment of Cross-product data infrastructure grabs attention
In the transition from film to digital media, the way we take photos and enjoy them has changed dramatically. However, there still remain many who want photos printed on paper or a paper album they can use to reflect on their memories with enjoyment. To serve these needs, FUJIFILM Corporation (hereinafter FUJIFILM) introduced FUJIFILM Prints & Gifts, which enables users to easily place orders for various print services with their smartphones.
“We already had a service in place that enabled users to easily order prints online, since this was set up in 1998,” says Masanori Todo of FUJIFILM Imaging Systems Co., Ltd, which is involved in the planning and operation of this service. At FUJIFILM Imaging Systems Co., Ltd, Todo is a manager in the No. 2 Special Sales Department of the Regional Volume Sales and Special Sales Division at Consumer Sales HQ. He explains that they rebranded the existing service in July 2018, and that this service is a more convenient version of the previous one. “We also provide a membership-based shopping service for consumers called FUJIFILM Mall, and members of that service can make use of FUJIFILM Prints & Gifts.”
In marketing for e-commerce sites like this, using data to monitor user trends is essential. Although they had long collected and used various data for that purpose, they “just couldn’t seem to find a use that met their needs,” reflects Yusuke Sato, who is also a manager in the No. 2 Special Sales Department alongside Todo.
“This service is a sort of portal site, and different staff are responsible for different products. As a result, staff would have different perspectives on how to use tools and data, which tended to introduce noise into the process. With this sort of dynamic, it wasn’t possible to put together precise policies that take a broader perspective on the service as a whole. We felt that we needed a data infrastructure that cut across all products.”
Tableau Implementation and Operation
Centralizing Data in Cloud Storage and Analyzing with Tableau
They chose Tableau as the tool to build that data infrastructure.
”I previously worked at FUJIFILM head offices in their Digital Marketing Strategy (“DM-Sen”) department, and that’s where I was when we began using Tableau in 2016,” says Todo. The reason they adopted Tableau was that the manager of the Fujifilm Way Office, which promotes DX across FUJIFILM as a whole, had recommended “using Tableau to utilize data in marketing for consumer-oriented services.” “We had been using pivot tables in Excel to conduct data analysis, but this didn’t enable us to visualize the data to our satisfaction. So we took up the manager’s suggestion and decided to use Tableau.”
A variety of data is used in the management of FUJIFILM Prints & Gifts, including incoming order data, sales data, customer information, and Google Analytics data. This data is first consolidated on the cloud for storage, and then it is made accessible to Tableau users via Tableau Bridge. Moreover, the cloud storage is also linked up with the Salesforce Marketing Cloud, so this consolidated data is also used on the marketing cloud and to provide data feedback for MA measures. Naturally, this type of data can also be analyzed using Tableau.
Why Tableau?
Easy Visualization and Not Dependent on Individuals’ Skillsets
Todo explained why they decided to use Tableau as follows.
“We decided to use Tableau because it can both analyze and visualize data. Through an intuitive drag-and-drop interface, you can immediately view the data you want from any angle. It is also easy to combine multiple types of data for visualization without any errors. Excel always requires some manual labor, and you need to verify whether tables created by combining multiple types of data are actually correct or not. With Tableau, none of that work is necessary.”
In addition to this, “crucially, Tableau is not dependent on any individual staff member’s skillset,” says Sato. “Many marketing and creative staff lack Excel skills, and it’s not uncommon for them to misinterpret the data, either. However, if you prepare a dashboard in Tableau, anyone can analyze the data from the same perspective. The marketing staff responsible for each type of product can take it upon themselves to conduct a cross-sectional analysis that includes other products.”
You can easily drag and drop to see the data you want to see. In Excel, you need to list up massive volumes of data before you can create any graphs. With Tableau, however, you can immediately visualize the data without doing any such work.

Benefits of Tableau Implementation
More Precise Policies and Faster Decision-making
Implementing Tableau has the following benefits:
Speeding Up Data Utilization
In the past, they would export various data in CSV format and import that into Excel for aggregation. But this work was time-consuming, and aggregation was performed once per month, explains Todo. With Tableau, however, aggregation is instantaneous and is now performed on a daily basis.
High-precision Policy Development
“In the past, decisions were made based on different data for each product. That made it difficult to draw on experience with other products, so we had trouble improving the precision of our measures and policies,” said Sato. Since they started using Tableau, all marketing staff have been able to use data from the same perspective, and he said this makes it easier to create policies that draw on past experiences. “Also, when we are looking at the effectiveness of a campaign, there is now a consistency to how we look at the data. This makes it easier to evaluate over a longer span of six months to a year. We have now created many policies that are based on data.” As marketing staff get access to more data and are able to utilize it more quickly, this has ripple effects on adjacent departments such as those handling digital advertising data, as those departments have more material to study and are able to work more swiftly.
Speedy Meetings and Decision-making
There have also been major changes to how policy planning and evaluation meetings are conducted. Although we previously held discussions at meetings based on paper materials, it is now standard to use Tableau screens and wrap meetings up in a short amount of time. “Increasingly, meetings can be completed just by sitting next to someone and glancing over Tableau. We don’t even need to reserve a conference room. Even when working remotely, all we have to do is share a Tableau screen and decisions can be made without issue,” says Sato.
We currently create and use multiple dashboards based on the objectives, but going forward we hope to integrate these into one dashboard that can be used to monitor circumstances in real time.”

Future Developments
Utilizing Web Ad Data and Linking Up with the Marketing Cloud
“Going forward, we will import web ad data in order to analyze it on Tableau,” says Sato. He explained that this is because the more data there is, the wider the range of policies that can be formulated, and this will further improve the precision of those policies. “FUJIFILM Business Expert Corporation, our in-house advertising agency, has already been using Salesforce Datorama. We are currently preparing to link up our systems.”
Meanwhile, Todo explains, they are also looking at using the results of Tableau analysis on the Marketing Cloud. “We currently export the results of segment analysis conducted in Tableau as CSV files and import those into the Marketing Cloud, but we would like to automate this process.”