Data Stories Helping to Shape Washington’s Future
Part think tank and part advocacy group, the Washington Business Alliance believes the state can be a powerhouse of economic growth without abandoning its inclusive spirit and high quality of life.
“Washington has all these amazing assets, and yet too often our priorities get compromised by our splintered political landscape,” says Hans Stroo, the Business Alliance's communications & public affairs manager. “To change the fractious conversation, we have to have a Mr. Spock personality—use the facts to divorce the analysis of issues from emotion.”
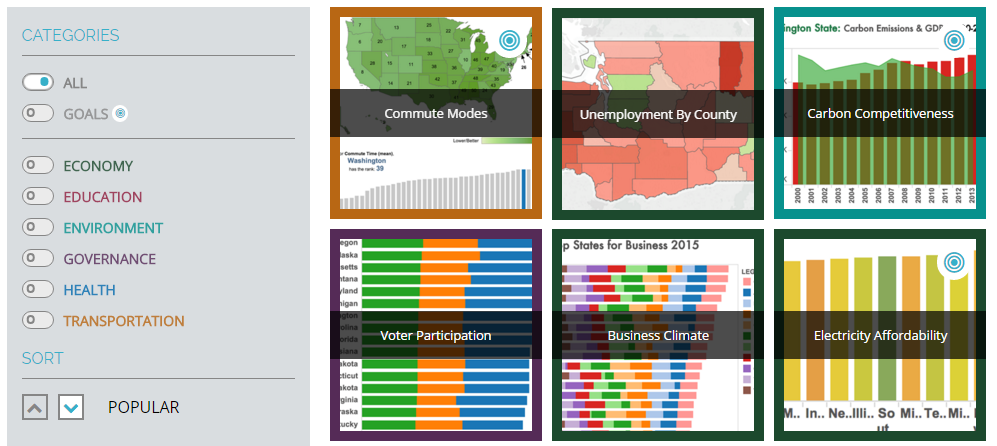
In 2014, the Business Alliance released its first PLAN Washington, a set of policy recommendations based on both measurable business goals and quality-of-life indicators. The report included data storytelling, which, over time, grew to be one of the most popular elements of the initial report. As the Business Alliance prepared the second edition for 2016, the team wanted to tell a fuller story with data.
The team wanted to create interactive visualizations that empower anyone to explore the issues they care about the most. But the team also wanted some expert help thinking through ways to polish up the vizzes and make them truly memorable.
Enter Sandlin Seguin, an e-learning specialist and Tableau Service Corps volunteer. Over several months, Sandlin worked with Hans and his team to explore best practices and develop a variety of storytelling tools.
“We talked about a more viable way of presenting the information—highlighting certain results, changing chart types—and putting Washington in a regional and national context,” says Sandlin.
“Now they can hone in on where we are at now as a state, talk about the things we might want to push ahead most, and focus on what are the biggest struggles to get there,” says Sandlin.
Having the help of an expert who understood the Business Alliance's long-term goals proved very useful, says Hans.
“Just having Sandlin with us for our first meeting helped us clarify our needs and set a roadmap was really valuable,” says Hans. “And she took every question as a teachable moment to help us think through what we were trying to say with the data.”
The Business Alliance released the updated PLAN at the beginning of 2016, and according to Hans, the initial response has been encouraging.
“Several officials in Olympia have contacted us after reading the report and were very interested in discussing ways to apply the research to policymaking during the upcoming legislative sessions,” says Hans.
Tableau Service Corps volunteers provide expert help to any non-profit with their organization’s data challenges. Learn more about the Service Corps or request volunteer support today.