Let's start with the basics. Data analytics is the process of collecting, analyzing, and interpreting large datasets to find patterns, trends, and correlations. It's like detective work, but instead of solving crimes, you're investigating business mysteries—such as customer churn rates, marketing campaign performance, or even bottlenecks in production processes.
But while the volume of data has never been greater, turning it into actionable insights is easier said than done. A global survey found that nearly half (41%) of business leaders don't understand their data because it's too complex or hard to access. And yet, to keep up with today’s rapid growth, they need to analyze more data and require better solutions to do it.
Table of Contents
What are the benefits of data analytics?
As we explore data analytics, it becomes clear that its importance goes beyond numbers and stats. The true value of data analytics lies in its ability to uncover valuable insights organizations can use to drive their business goals.
Let's discuss some of the benefits data analytics brings to the table.
Better decision-making
Picture making decisions based on real data and facts—this is the essence of data-driven decision-making (DDDM). It's about making smart decisions that align with your goals, giving every team member the power to make better decisions daily. Achieving this requires nurturing skills in data proficiency, analytics agility, and fostering a data-centric community. Although it can be challenging to transform an organization into a data-driven one, blending data and analytics into decision-making processes can have a big impact.

Improve operational efficiency
Data analysis reveals bottlenecks and inefficiencies in your operations. This boosts efficiency and simplifies workflows while lowering operational costs and minimizing wasted resources. It's the recipe for enhancing your overall operations without sacrificing quality.
Enhance forecasting and planning
Data analysis provides predictive insights by enabling you to delve into historical trends and patterns. With this information, you can anticipate market shifts and emerging opportunities. It can also help you project sales and forecast customer demands. This foresight guides your decisions and helps you prevent potential disruptions.

Drive innovation
Data analytics plays a key role in driving innovation. Data, in particular, provides the foundation for game-changing innovations such as AI and impacts AI outputs. Overall, data analytics helps identify gaps in the market, determine customer needs, and reveal undiscovered opportunities. A data-driven approach encourages the exploration of new ideas and the creation of new products, services, and business models—ultimately driving growth and progress.
Boost security and minimize risks
When it comes to managing risks, data analysis is a reliable and valuable tool to have on your side. You can spot potential threats and craft strategies to mitigate them by examining past data and patterns. Insights gained through data analysis empower you to tackle uncertainties strategically, minimizing disruptions to your business.
Gain a competitive advantage
Combining the power of data analytics with market trend awareness, superior customer experiences, efficient operations, and informed decision-making creates an unbeatable competitive advantage. It extends to recognizing areas for improvement, tracking sales trends, and identifying market gaps fueled by insights from within your organization and the broader industry.
What tools and technology support data analytics?
Behind the curtain of data analytics are various tools and technologies that transform raw data into meaningful insights. But first, we have to understand data terminology.
Data visualization, cloud computing, natural language processing (NLP), machine learning (ML), and artificial intelligence (AI) all provide the infrastructure, tools, and frameworks needed for all analytics. Let’s dig into each one a bit deeper.
Data visualization
Data visualization is a visual display of information that communicates data in ways that are easy for anyone to understand. Imagine taking a pile of complex data and transforming it into easily digestible visuals. That's data visualization—presenting information in charts, graphs, and interactive dashboards helps users comprehend patterns and trends. This simplifies complex concepts, opens up data exploration, and makes it easier to share insights.

Cloud computing
Cloud computing is the delivery of different services through the internet, or the “cloud,” including data storage, servers, databases, networking, and software. It offers scalability, flexibility, and accessibility for data analytics. Organizations can store and process massive amounts of data without the hassle of managing their own infrastructure.
Natural Language Processing
Natural Language Processing (NLP) enables computers to understand and interpret human language. It helps with text analysis, sentiment analysis, and speech summarization. NLP is beneficial when analyzing unstructured text data, such as customer reviews, surveys, or social media conversations.
Machine Learning
Machine learning (ML) is a branch of artificial intelligence (AI) and computer science that uses data algorithms to imitate how humans learn, gradually improving accuracy. Picture a system that learns from data and constantly improves performance over time—that's the magic of machine learning. ML can help predict future trends and outcomes and identify outliers in data, like errors or rare events. Additionally, it can teach pattern recognition to computers, such as identifying objects in images or comprehending speech.
Artificial intelligence
Artificial intelligence goes beyond traditional ML techniques, incorporating advanced algorithms and cognitive abilities to simulate human intelligence. It enables systems to reason, learn, and adapt quickly, opening up exciting business possibilities. A few of its most popular applications are automated decision-making, personalized experiences, and adaptive systems.
What are the different types of data analytics?
Now that we've uncovered what data analytics is, why it should matter to you, and the related technologies, let's review the various types of data analytics and their use cases.
Descriptive analytics
Organizations often use descriptive analytics to gain insights into past events by summarizing historical data and answering the question, "What happened?" This type of analytics helps identify trends and changes over time and highlights an organization's strengths and weaknesses. It can also help with complex comparisons and provide a foundation for further analysis.
Potential use cases:
Healthcare
- Patient demographics analysis
- Hospital resource allocation
- Disease prevalence analysis
Human Resources
- Employee turnover rate analysis
- Workforce demographics analysis
- Recruitment channel effectiveness
Sales and Marketing
- Sales performance analysis
- Marketing campaign performance analysis (likes, follows, shares, etc.)
- Customer behavior analysis
Supply Management
- Supplier performance analysis
- Inventory turnover analysis
- Shipping and delivery timeline monitoring
Descriptive analytics has many uses, including improving customer service, analyzing survey results, demand trends, financial statements, market research, social media engagement, and website traffic.
Example: Have you ever wondered how streaming services like Netflix and Spotify suggest and rank what their customers should watch or listen to? These data-driven companies collect and analyze customer data to understand their behavior and what content they’re consuming. This information is then used to influence various business decisions. For instance, Spotify creates playlists like "Top 50" based on the most played tracks in a specific region. Similarly, Netflix analyzes users' streaming habits to curate its "Trending Now" list of popular shows and movies. It also analyzes customer behavior to identify new business opportunities, build marketing campaigns, and more.
Technology: Some technologies often used for descriptive analytics include Tableau, Google Analytics, Microsoft Excel, Microsoft Power BI, Looker, and Qlikview.
Diagnostic Analytics
Diagnostic analytics is a type of data analysis that helps identify and respond to anomalies in your data to answer, "Why did it happen?" It works hand in hand with other types of analysis and typically occurs after conducting descriptive analysis. Its main aim is to determine the cause of certain events or trends.
Potential use cases:
Finance
- Fraud detection
- Anomaly detection
- Risk analysis
Transportation and Logistics
- Accident analysis
- Delay analysis
- Maintenance analysis
Sales and Marketing
- Conversion rate analysis
- Customer churn analysis
- Sales team performance analysis
Human Resources
- Employee engagement analysis
- Employee survey analysis
- Workplace safety incident analysis
Example: Imagine a clothing retailer noticed a sudden surge in sales for a particular dress. The company analyzed website traffic, customer reviews, social media engagement, and more using diagnostic analytics. Ultimately, the retailer discovered that a social media influencer featured the dress on their Instagram page and tagged the retailer, increasing sales.
Technology: Technologies commonly used for diagnostic analytics include Tableau, Microsoft Power BI, QlikView, and Looker.
Predictive Analytics
Predictive analytics can help answer the question, "What is likely to happen?" It uses historical data and statistical models to predict future risks, opportunities, and outcomes. By providing forward-looking insights, predictive analytics can help you make data-informed strategies and impactful business decisions for the near or distant future.
Potential use cases:
Customer Experience
- Personalized recommendations
- Customer segmentation and targeting
- Customer feedback analysis
Manufacturing and Maintenance
- Predictive equipment maintenance
- Demand forecasting
- Remaining useful life prediction of assets
Healthcare
- Early disease prediction
- Patient load and bed utilization forecasting
- Anticipating staff and resource needs
Energy and Sustainability:
- Demand forecasting
- Price optimization
- Grid optimization
Example: Let's revisit the Spotify example. This streaming service places emphasis on enhancing the user's listening experience. Predictive analytics power features such as the Discover Weekly Playlist and Made For You section. These features analyze customer data to identify a user's preferred genre, artist, and other factors to suggest songs and curate playlists they may enjoy.
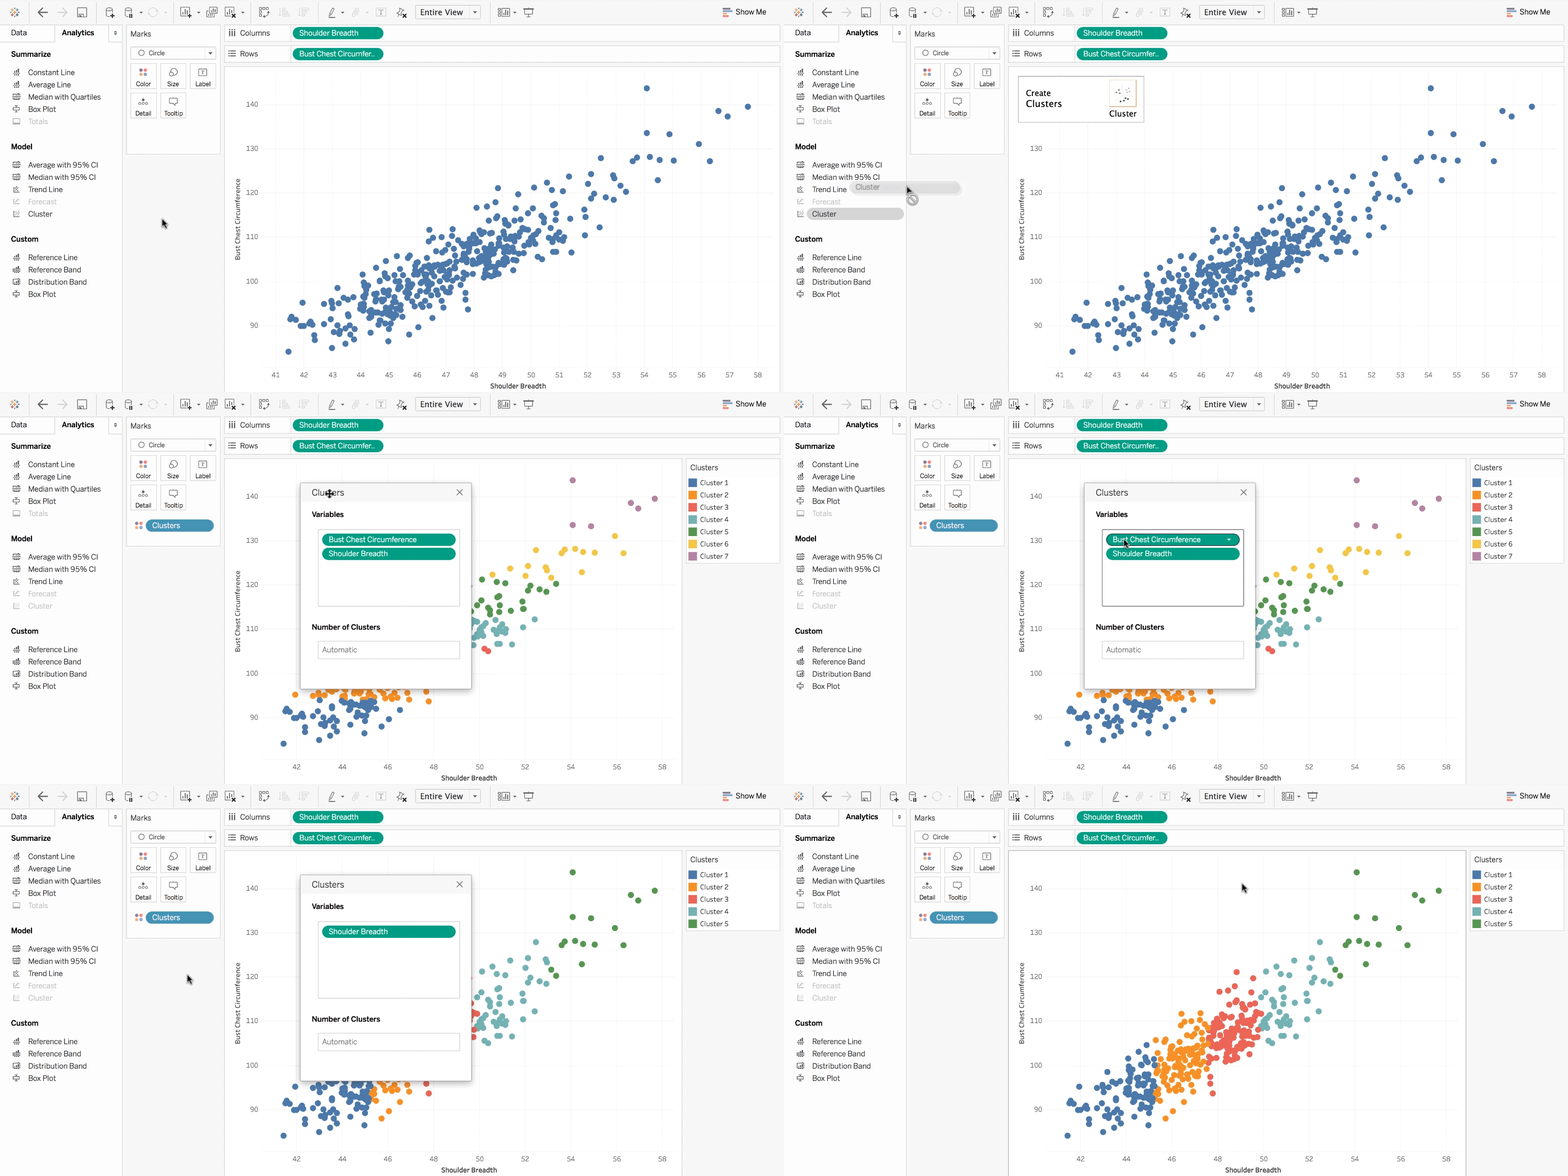
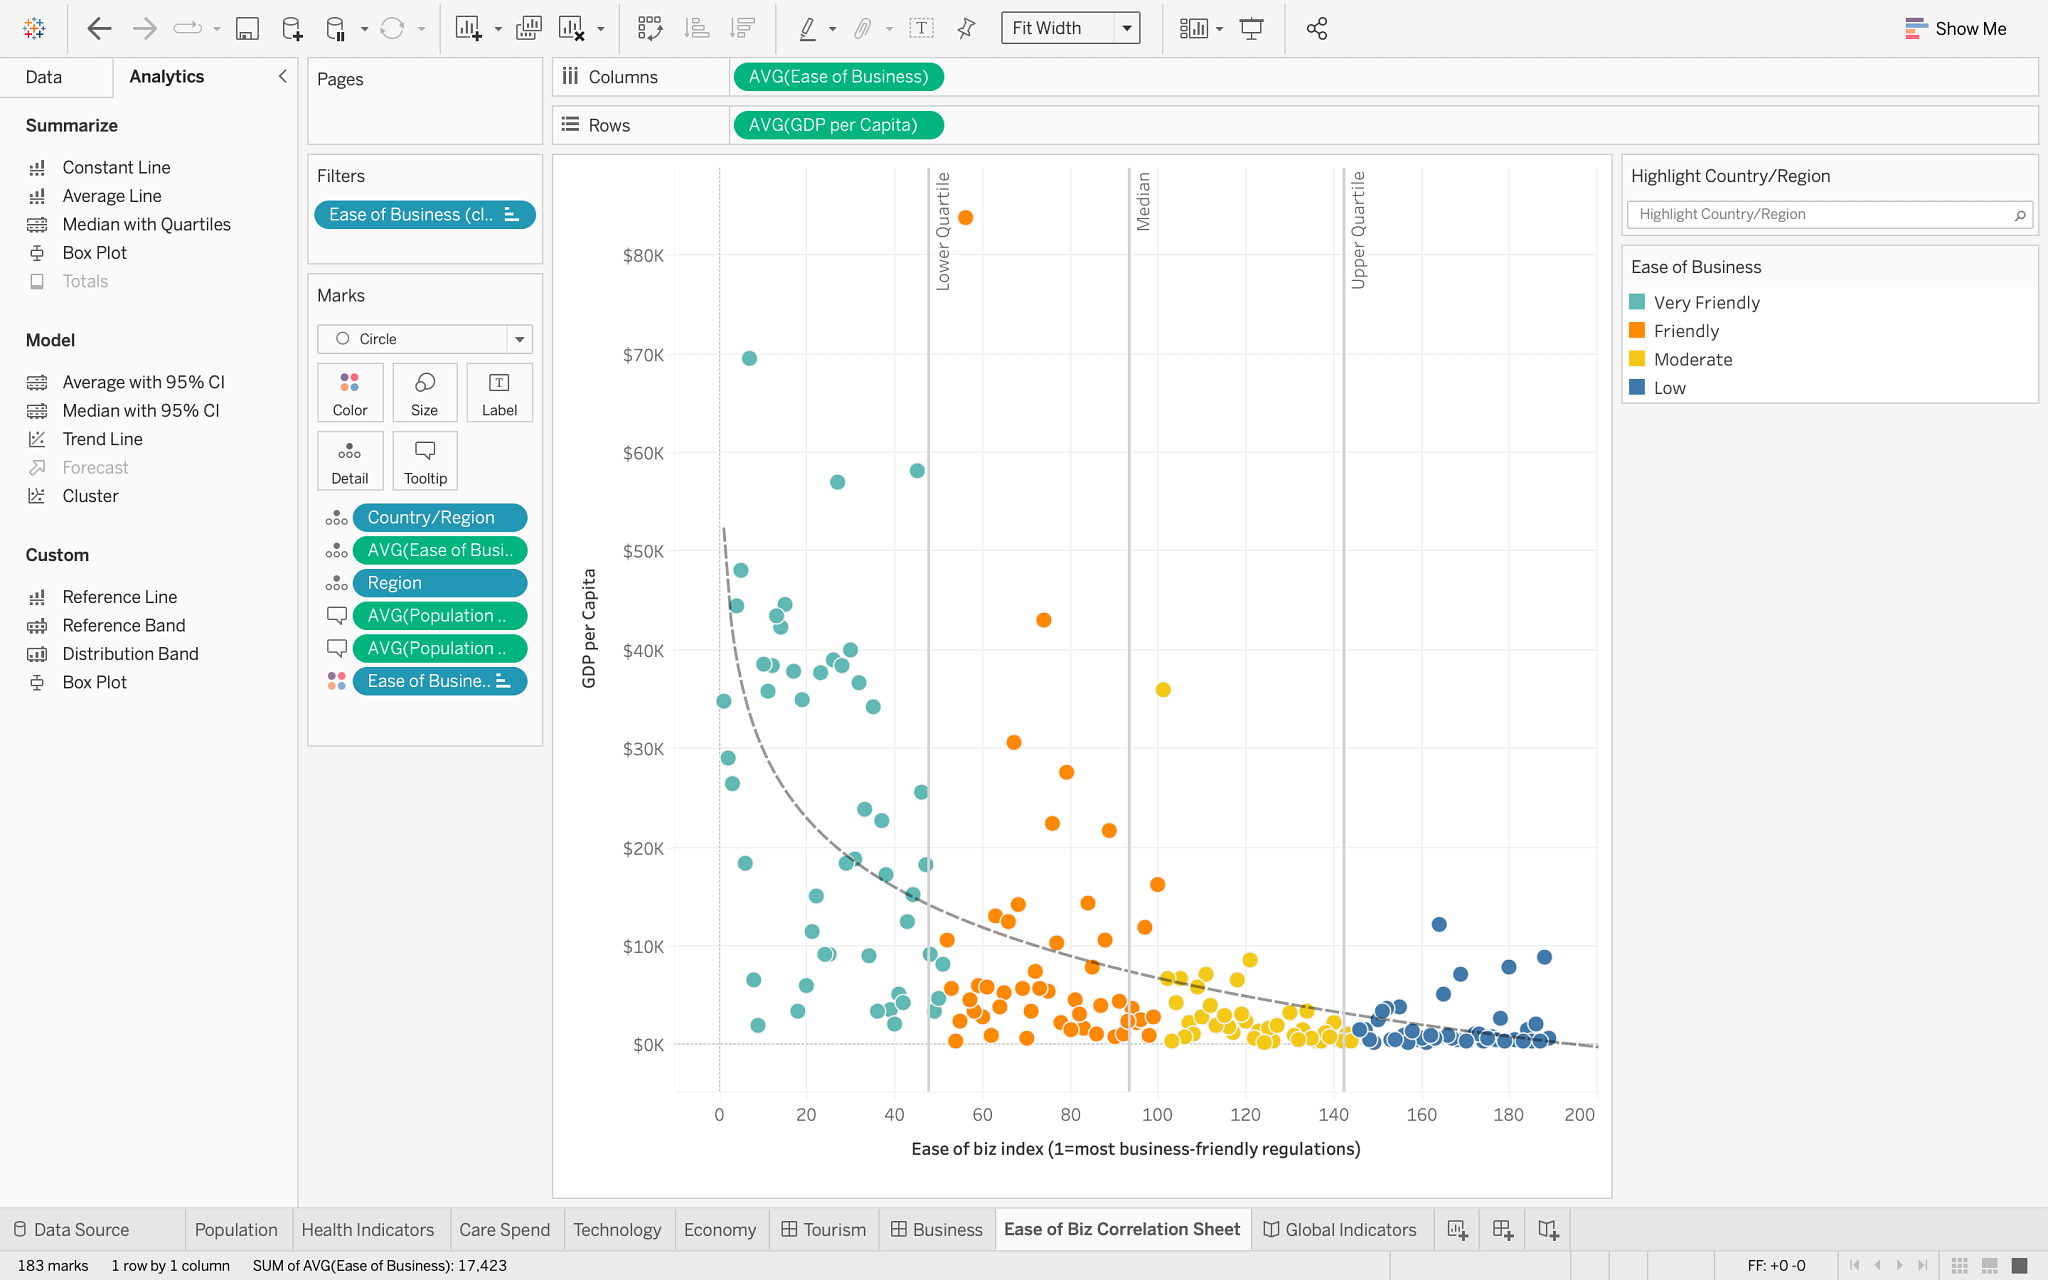
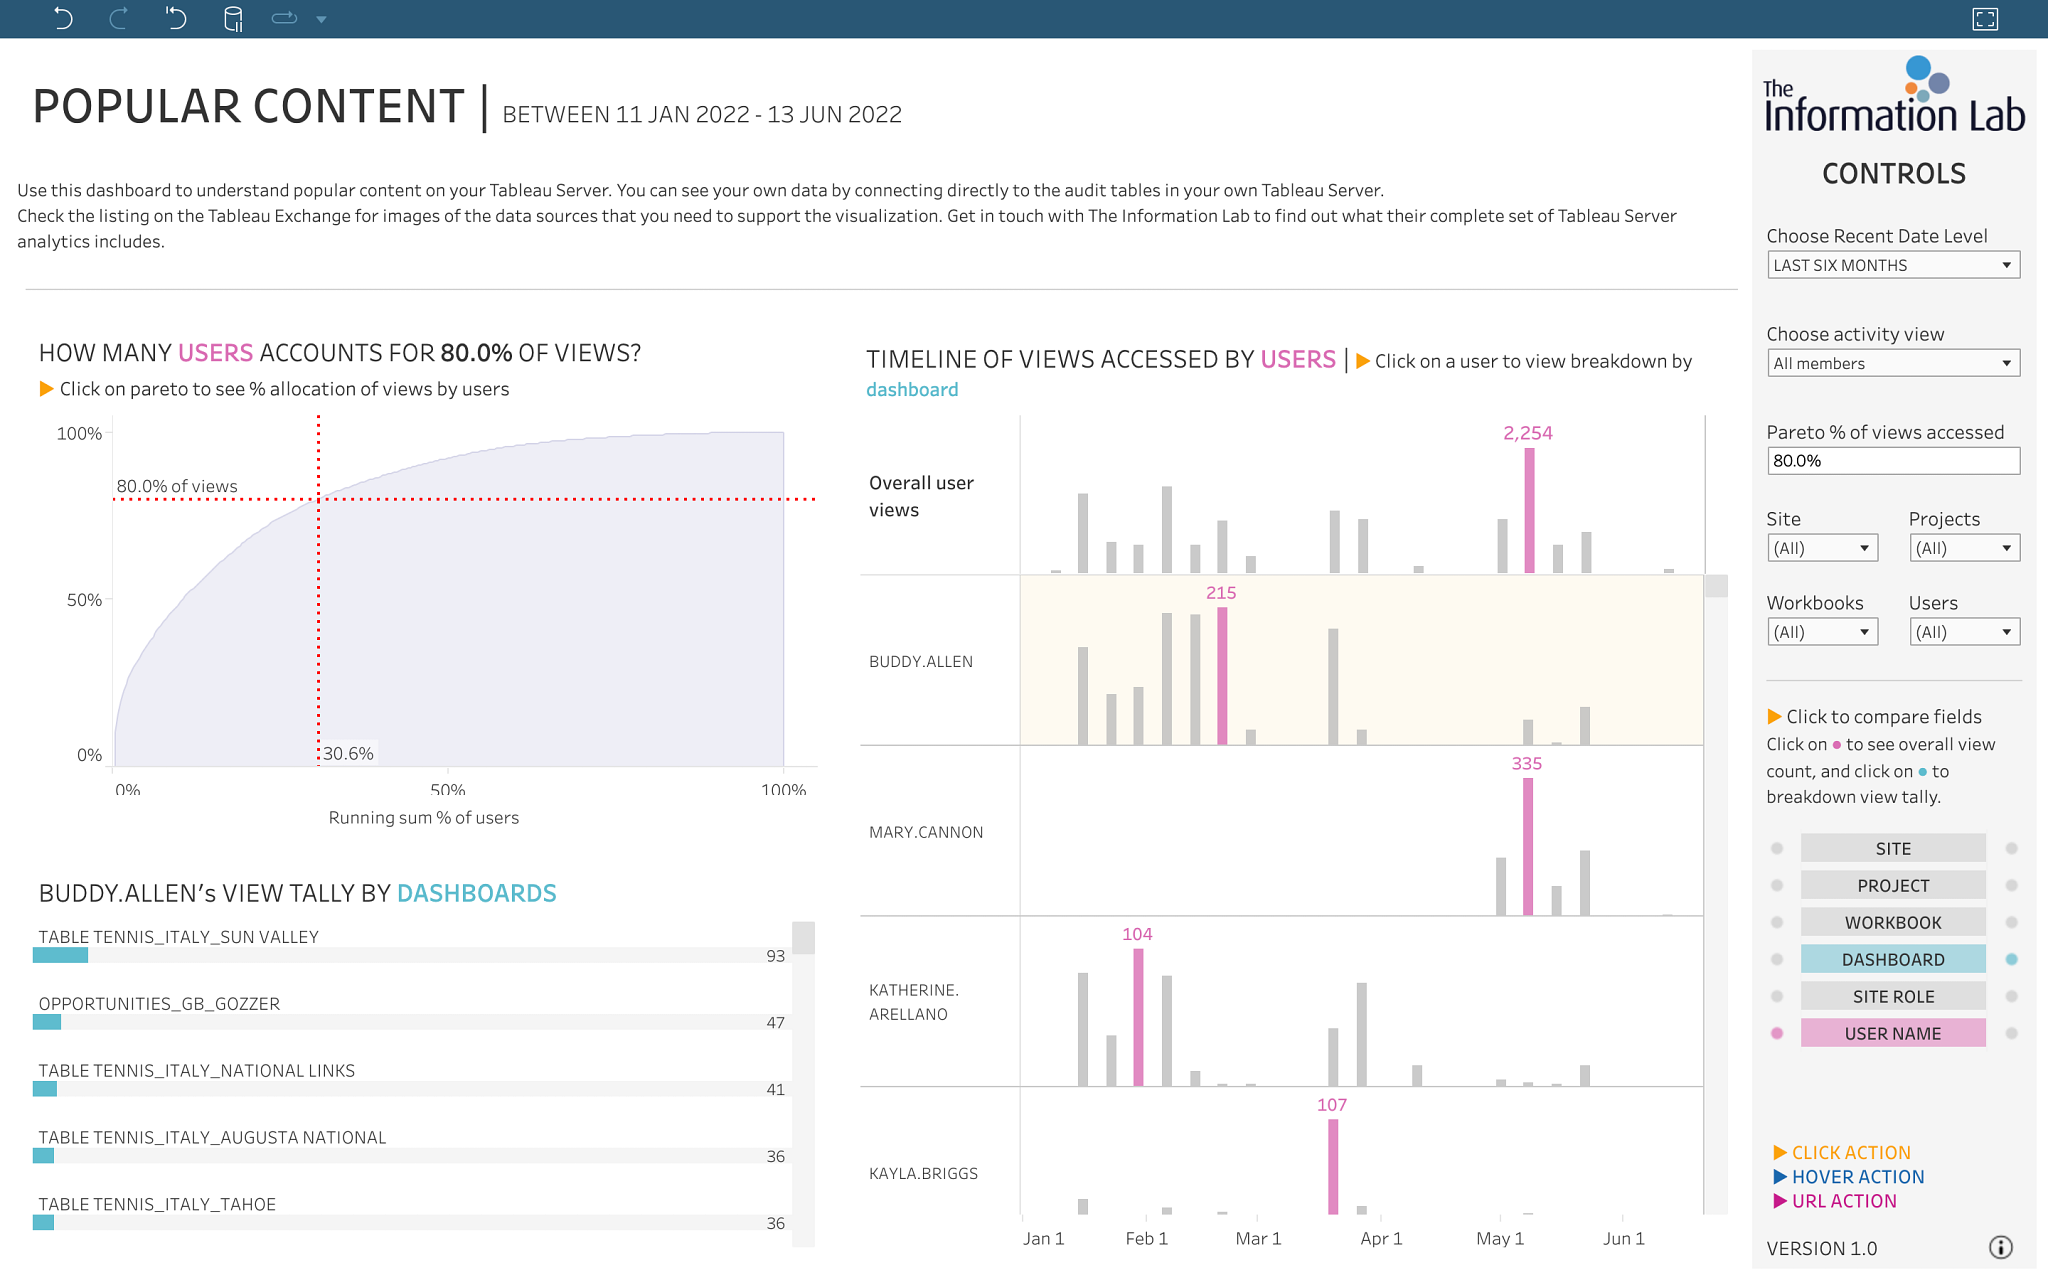
Technology: Some popular technologies used for conducting predictive analytics include Python, R, SAS, SPSS, Tableau (pictured below), Microsoft Excel, and Apache Hadoop.
Prescriptive Analytics
Prescriptive analytics is the most advanced form of data analytics and addresses the question, "What should we do?" It's a valuable tool for data-driven decision-making, predicting future outcomes, and recommending actions for the best possible result. Prescriptive analytics can help organizations in determining the best course of action to meet business goals such as profitability, scalability, and customer satisfaction.
Potential use cases:
Finance and Operations:
- Workflow optimization
- Fraud and anomaly detection (action-based)
- Cash flow management
Retail and Sales
- Inventory replenishment strategies
- Pricing optimization
- Sales territory optimization
Healthcare
- Treatment recommendations
- Healthcare resource optimization
- Patient care plan optimization
Telecommunications
- Network optimization
- Service quality improvement plans
- Dynamic pricing strategies
Example: Suppose there's a suspicious activity in a customer's financial account. An algorithm that uses prescriptive analytics detects this. For instance, if a customer typically spends $5,000 monthly but suddenly charges over $15,000 on their credit card, the algorithm analyzes their transactional data. It alerts the bank and recommends a course of action. This could include freezing or canceling the card to prevent further suspicious transactions.
Technology: Some commonly used technologies for prescriptive analytics are IBM Decision Optimization, FICO Xpress Optimization, SAS Optimization, Gurobi, and DataRobot.
What are some best practices for data analytics?
Following data analytics best practices delivers accurate and meaningful insights from your data. A structured process ensures that the data captured and analyzed is high quality and well understood across any department. Here are some best practices to follow for data analysis.
Set clear objectives and define your metrics
To achieve success, it's important to have clear goals and metrics to measure progress. For instance, if you work in sales and marketing, you may monitor the customer acquisition cost (CAC), whereas a customer support representative may prioritize tracking the customer churn rate. By determining the appropriate metrics, you can focus on what matters most—your team and your customers.
Choose the right tools and technologies
Select analytics tools that align with your needs and leverage cutting-edge technologies. For example, utilizing AI and data visualization tools helps enhance your analysis capabilities, uncover deeper insights, and effectively communicate your findings.
Enlist data quality and governance
Implementing data governance ensures proper management and control of your organization’s data assets. It involves setting up rules, policies, and procedures to ensure data quality, compliance, access, and accountability. Organizations can then confidently use their data while maintaining its integrity and security.
Safeguard your data’s privacy
It's all about maintaining customer trust. Your organization should always adhere to relevant laws and industry standards when handling data. Implementing security measures, such as access controls and encryption, is best to protect data from unauthorized access or breaches. Appropriate data security protocols, like the General Data Protection Regulated (GDPR) and the California Consumer Privacy Act (CCPA), should also be followed for compliance and data protection.
Continuously learn and adapt
Staying updated on new techniques and strategies is a continuous learning and adaptation cycle. Over time, the rise of new technology will change how you collect, analyze, and gain insights from data, leading to better processes and outcomes.
What is the future of data analytics?
Data-driven organizations are three times as likely to see big improvements in decision-making. They're also realizing that data is less valuable if it's only available to a select few. By investing in training and promoting data literacy, business leaders are committed to closing the skills gap and ensuring everyone can access data insights. This is key in creating a future where data literacy is widespread, so you don’t have to be a data analyst or scientist to use data effectively.
The latest technological advancements help individuals without data expertise easily analyze and comprehend their data. Generative AI has revolutionized how users of all skill levels engage with data. It's what powers solutions such as Tableau AI, which simplifies the process of gaining insights and interacting with data, allowing users to discover new information and generate actionable insights quickly. With this technology, users can now receive answers to questions they may not have considered before, all in a matter of seconds.
AI and ML also bring new possibilities to data analytics. With the help of AI-powered analytics, organizations can revolutionize their approach to predictive maintenance. Rather than relying on scheduled checks, they can gain a more comprehensive understanding of individual machines and entire networks of assets through data-based insights. Organizations can then use these insights to make maintenance recommendations.
The rise of low-code and no-code analytics tools also signals a shift towards a data-driven culture within organizations. These tools will enable more businesses to harness the benefits of data analytics without the need for extensive coding expertise, improving access to insights.
There's a lot of ground to cover when it comes to data. Continue your learning by checking out this helpful glossary of data-related terms to understand the power of data and analytics better.
Data analytics FAQs
What are some advanced data analytics techniques?
Advanced techniques include machine learning, predictive modeling, and statistical analysis. These methods go beyond simple reporting to forecast future trends and uncover complex patterns in large datasets.
How is big data used in data analytics?
Big data refers to massive and complex datasets that can't be handled by traditional software. Data analytics uses specialized tools and techniques to process this data to uncover hidden patterns, trends, and correlations, which helps businesses gain deeper insights and a competitive edge.
How is AI changing the field of data analytics?
AI is transforming data analytics by automating time-consuming tasks like data cleaning and preparation. It also enhances predictive models and makes insights more accessible to non-experts through natural language queries and automated insights.
What are the biggest challenges in data analytics?
One of the main challenges is data quality, as inaccurate, incomplete, or inconsistent data can lead to flawed insights. Other common hurdles include a shortage of skilled personnel, the difficulty of integrating data from multiple sources, and data privacy and security concerns.
What programming languages are commonly used in data analytics?
The most common programming languages are Python and R, as they offer a vast number of libraries for data manipulation, analysis, and visualization. SQL is also essential for querying and managing data in databases.
What is the difference between a data analyst and a data scientist?
A data analyst typically works with structured data to create reports and dashboards that explain past business performance. A data scientist works with larger, more complex datasets to build predictive models and use machine learning to forecast future trends.