
The Data Scientist’s Performance Checklist
Ready to take your models to production or simply curious about what using Analytics Extensions would entail? Learn the checklist a Professional Services Engagement Manager uses to ensure dashboards utilizing these features maintain security and performance as they scale.

How can we use Analytics Extensions?
Analytics Extensions serve as a bridge between our data and Tableau, enabling us to perform complex calculations in Tableau using our preferred language, call models from our favorite data science platforms to enable self-service analytics, and bring in real-time data sources that would otherwise be tricky to connect to.
We can communicate with Analytics Extensions from Tableau through table calculations called Script calculations and Model calculations or through Table Extensions.
Script calculations
Script calculations enable us to run ad-hoc scripts using popular languages like R or Python. We can write these calculations in Tableau as if we were creating a new calculated field.
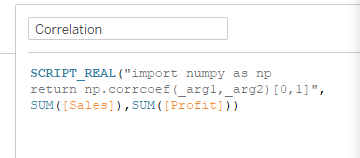
We can calculate something as simple as a correlation coefficient, as we see here, or write something far more complex. As demonstrated above, we can import necessary libraries, like we would in our favorite IDE.
The expression is passed directly to a running analytics extension service instance.
When using Python expressions, we’ll use _argn to reference parameters (_arg1, _arg2, etc.) as seen in the example above.
When using R expressions, we’ll use .argn to reference parameters (.arg1, .arg2, etc.).
Our script calculations begin with a script function. There are four types of script functions, and these differ only by the values they return (e.g., a SCRIPT_BOOL function returns a Boolean value).
SCRIPT_BOOL
SCRIPT_INT
SCRIPT_REAL
SCRIPT_STR
To determine which type of script function we need, we’ll look at our model and consider the output we expect. In the example above, our model output is a real number, so we use SCRIPT_REAL.
Model calculations
If we use Python (TabPy) for our analysis, we can use model calculations to directly query external analytics models, rather than writing lengthy calculations into a script function. Once we have deployed a model in our external analytics service and ensured the external analytics service allows for direct queries of that model, our Creator only needs the name of the model and the model inputs to create a calculated field for the model in Tableau.
The model calculation in Tableau has three parts:
- the model (We’ll ensure the name matches exactly).
- the model inputs
- the fields in our Tableau data source that match the model (Tableau will pass these values back to the model).
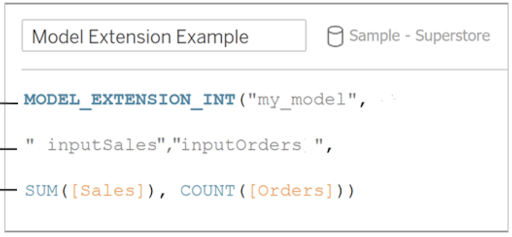
As with script calculations, our model calculations will start with a model_extension function. As with
script functions, there are four model function types, and they differ only by the values they return.
(e.g., A MODEL_EXTENSION_BOOL function returns a Boolean value).
MODEL_EXTENSION_BOOL
MODEL_EXTENSION_INT
MODEL_EXTENSION_REAL
MODEL_EXTENSION_STR
As with script functions, we can determine which type of function we need by considering the output we
expect from our model. In the example above, our model output is an integer, so we use
MODEL_EXTENSION_INT.
Table Extensions
Table Extensions enable us to use a custom code editor much like our favorite IDEs, enabling us to call APIs to connect to data sources that are otherwise tricky to connect to. With Table Extensions, we can bring full tables of data into Tableau, make transformations if needed, and see our data appear in the Data Pane with dimensions and measures like any other data source. Data from Table Extensions can be joined with other data sources in Tableau, providing us the flexibility to access the data we need.
Connecting to Table Extensions
We connect to Table Extensions from a published workbook.
From any worksheet, we’ll navigate to the bottom-left corner of the screen to open our Data Source. Under Connections, we’ll choose New Table Extension and drag this into the data model to reveal the Table Extension code editor. There is a small arrow next to the bottom-left corner of the code editor to enable us to expand or collapse the code editor as we work.
What if we do not have an existing data source?
If we are starting from scratch and do not have an existing data source, we can use any data to start. Sample - Superstore works well. After connecting to Sample - Superstore and opening the data source, we can click on the right side of the Orders object to remove this from the data model, giving us a clear space to drag in our new Table Extension.
From here, we’ll enter our code into the code editor and click the Apply button. We can choose for our data to update immediately (i.e., Update Now) or to Update Automatically.
Once we apply our changes, we can see updates in real time. Because Table Extensions trigger upon loading a dashboard, we’ll see fresh data each time the dashboard loads or the data source is refreshed.
Tableau Server or Tableau Cloud
We’ll first ensure Analytics Extensions are enabled on our site on Tableau Server or Tableau Cloud by navigating to All sites > Settings > Extensions, and checking the Enable Analytics Extension selection under Analytics Extensions.
We can then configure a connection for our site by navigating to Settings > Extensions and checking the Enable Analytics Extension for site selection under Analytics Extensions. Here, we’ll enter our connection information and, in most cases, choose to require SSL.
Tableau Desktop
In Tableau Desktop, we can connect to Analytics Extensions from the Help Menu by navigating to Settings > Performance, then selecting Manage Analytics Extensions Connection and selecting the connection type (e.g., TabPy, Einstein Discovery, RServe, Analytics Extensions API) that we’d like to work with.
How do we use each connection type?
- TabPy enables us to integrate Python into Tableau calculations
- The Einstein Discovery connection enables us to augment our analyses with predictions from Einstein Discovery
- The RServe connection enables us to integrate R into Tableau calculations using an open-source R server
- The Analytics Extensions API enables us to extend Tableau calculations to dynamically include external analytics tools and platforms
Provision two separate servers
It is strongly recommended to provision two separate servers to host Tableau and the analytics extension to enhance security and optimize performance.
Security
The server running the external service for Analytics Extensions should be configured with a valid TLS/SSL certificate from a trusted third party certificate authority (CA). Tableau Cloud will only establish a connection with external servers that are configured with a certificate that is trusted by an established third party CA (This can not be a self-signed certificate or a certificate from a private PKI).
Maintaining separate servers prevents the risk of remote code execution to the Tableau Server environment (i.e., The analytics extension can not execute code on the open internet and can not download anything; it can only receive and send requests to the machine that is running Tableau Server or Tableau Cloud). When using TabPy, it is recommended to use the latest supported version of Python.
Performance
Provisioning and maintaining these two separate servers ensures that the analytics extension is not competing for resources with Tableau Server.
Multiple connections
As of Tableau Server version 2021.2, Tableau supports multiple connections per server and multiple connections per site. This enables organizations the flexibility to have different Analytics Extensions (e.g., R, TabPy, MATLAB) among teams or roles.
Common use cases
Script calculation in a “What-if?” calculator
We can use a script calculation together with parameters to enable self-service analytics. We accomplish this by creating a script calculation for our model in Tableau, then replacing a field for one of our model inputs with a parameter for our Business User to adjust.
When our Business User changes the parameter in our "What-If?" calculator, this triggers the Analytics Extension to score all the records. The script calculation passes data to the analytics server, uses this in our code or function in our analytics extension, and returns the results in real time.
Using these parameters, a business user who doesn’t have a statistical background can use our parameters to leverage these real-time predictive models to explore what-if scenarios and quickly gain insights.
What if script changes are locked down?
In organizations with strict governance procedures, it may not be possible to make script changes, and using script calculations might not be permitted. If this is the case, the output from equivalent models created in script calculations or in model calculations will be the same, and using model calculations is recommended.
Can I use Analytics Extensions with Tableau Prep?
Tableau Prep supports script and model calculations. We can upload python or R scripts to be processed as part of a part of Prep Flow on Tableau Server. As of this writing, Tableau Cloud does not yet support Prep Flows containing Analytics Extensions.
Table Extension connections
Table extensions can serve as a multi-purpose connector, and we can join this data to previously established data sources in Tableau. For example, we could connect to our YouTube API to analyze customer engagement and sentiment in Tableau, or we could connect to an open-source Weather API using Table Extensions and join this to an existing supply chain data source in Tableau to provide additional insight for our forecasts.
Table Extension transformations
Table Extensions also enable us to send our data out to other tools to make transformations to our data, then bring this newly transformed data back into Tableau. For example, we could write a python script to query a customer locations object in SQL server, create a table, pass this data to a LLM to be scored, and then bring those suggestions back into Tableau.
When to use Dynamic Parameters in Table Extensions
We may have seen customers submit requests to the Tableau Community or even made requests ourselves. A customer recently asked,
“Can a table extension reference a parameter? It would be very useful if a table extension could reference a parameter, just as custom SQL can. Is that possible? How do you access it? (using Python for example)”
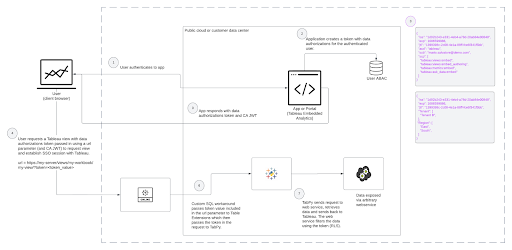
As of Version 2024.1, Dynamic Extensions in Tableau provides this functionality for embedded scenarios. By defining a custom parameter with a name-value pair using JavaScript that matches a parameter defined in a Tableau Workbook, we can change these values programmatically, passing dynamic values specific to each user at runtime. This enables the right people to see the right data at the right time.
Dynamic Parameters in Table Extensions - Architecture
What’s happening behind the scenes when we use dynamic parameters in Table Extensions for a Tableau visualization or a Pulse metric?
- The user authenticates into the application where Tableau content (e.g., a view) is embedded
- The application understands who the user is and what they should see
- sends information to the service by using a URL parameter on the view
- When the user clicks on the view, the application constructs the URL with the parameter
- sends the parameter to the web service
- TabPy proxies those requests
- The web service filters the data using the parameter
- sends a response to the Tableau view, (i.e., sends URL with security information/token)
The application with the Tableau content shows data in the view if the response is valid
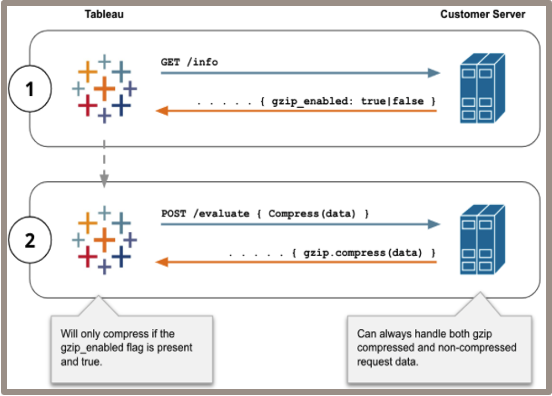
How do we scale?
When working with TabPy, we can compress requests to avoid payload restraints by ensuring the gzip_enabled flag is set to TRUE. This is particularly useful when working with larger data sets.
How can we ensure model performance?
- Write optimized code.
- Start with the model. Remember Tableau isn’t running the model. It’s just calling the model that runs elsewhere (Performance recordings consistently show approx. 95% of dashboard load time is attributed to running the model & sending it back).
- Troubleshooting? Verify and validate improvements with a performance recording.
- Ensure adequate hardware.
- TabPy can run on something as small and simple as a laptop, although the machine would need to be on, and this would not be recommended in production. Although no official hardware recommendations are published at the time of this writing, running stress tests is recommended to ensure hardware supports production models.
- Ensure adequate hardware to support models being run.
- Consider containers for their efficiency, consistency, and isolation benefits or utilize managed services for autoscaling functionality.
How do we optimize the performance of these models in the dashboard?
If after we’ve optimized our model and ensured we have sufficient hardware, the dashboard is slow, it can be helpful to think about how Tableau “thinks.”
What’s happening behind the scenes?
When using Analytics Extensions (e.g., TabPy, R, MatLab, Einstein), we see calls are made to the analytics service once for each row. Depending on our business question, it might be possible for that field to be calculated once for the entire column.
What’s the fix?
As with any table calculation, Tableau evaluates based on the level of detail of the view, and, Tableau makes one call to the analytics extension per partition (i.e., scope). This means that for each dimension the calculation is partitioning on, one call will be made for every member of that dimension in the view.
Partition appropriately. Set dimension(s) as Specific Dimensions.
If we don’t need that many calculations, we can set specific dimensions to calculate the entire column in one call.
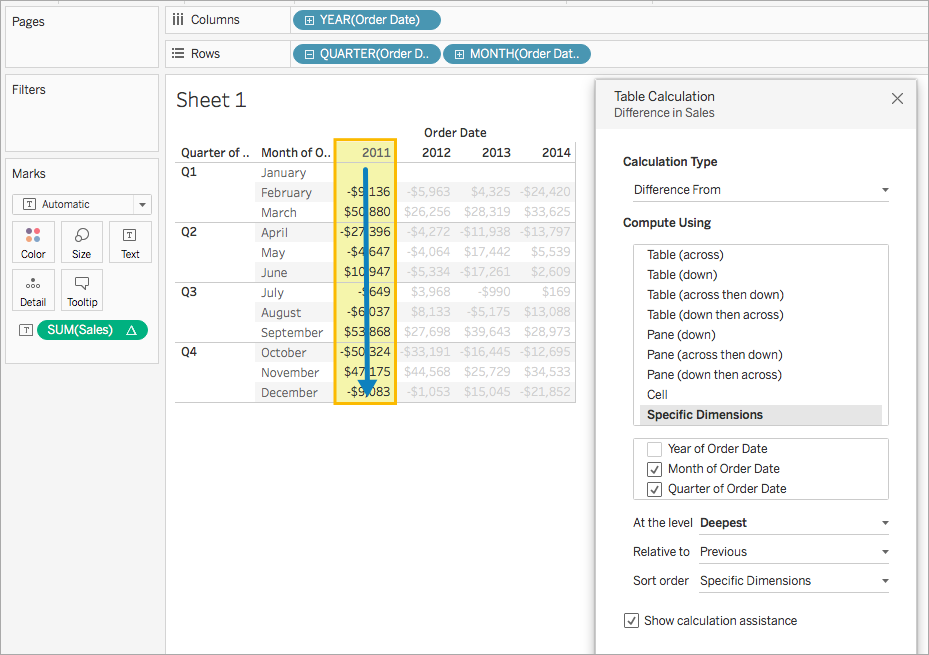
image from: https://tabscifi.golovatyi.info/useful-resources/
What if Tableau is slow while I’m making these updates?
If there are many marks in the view, we can select Pause Auto Updates while selecting dimensions to prevent unnecessary calls.
When to send multiple calls to the analytics service
In the example below, each point in the scatter plot is a customer, and we’re taking the opportunity to run our Python script in multiple contexts, one for each segment-category combination. Without any adjustments, Tableau would make calls to TabPy for each point in the view (e.g., if we sent 18 rows to TabPy, we’d get 18 rows back. If we sent 87 rows to TabPy, we’d get 87 rows back, and so on).
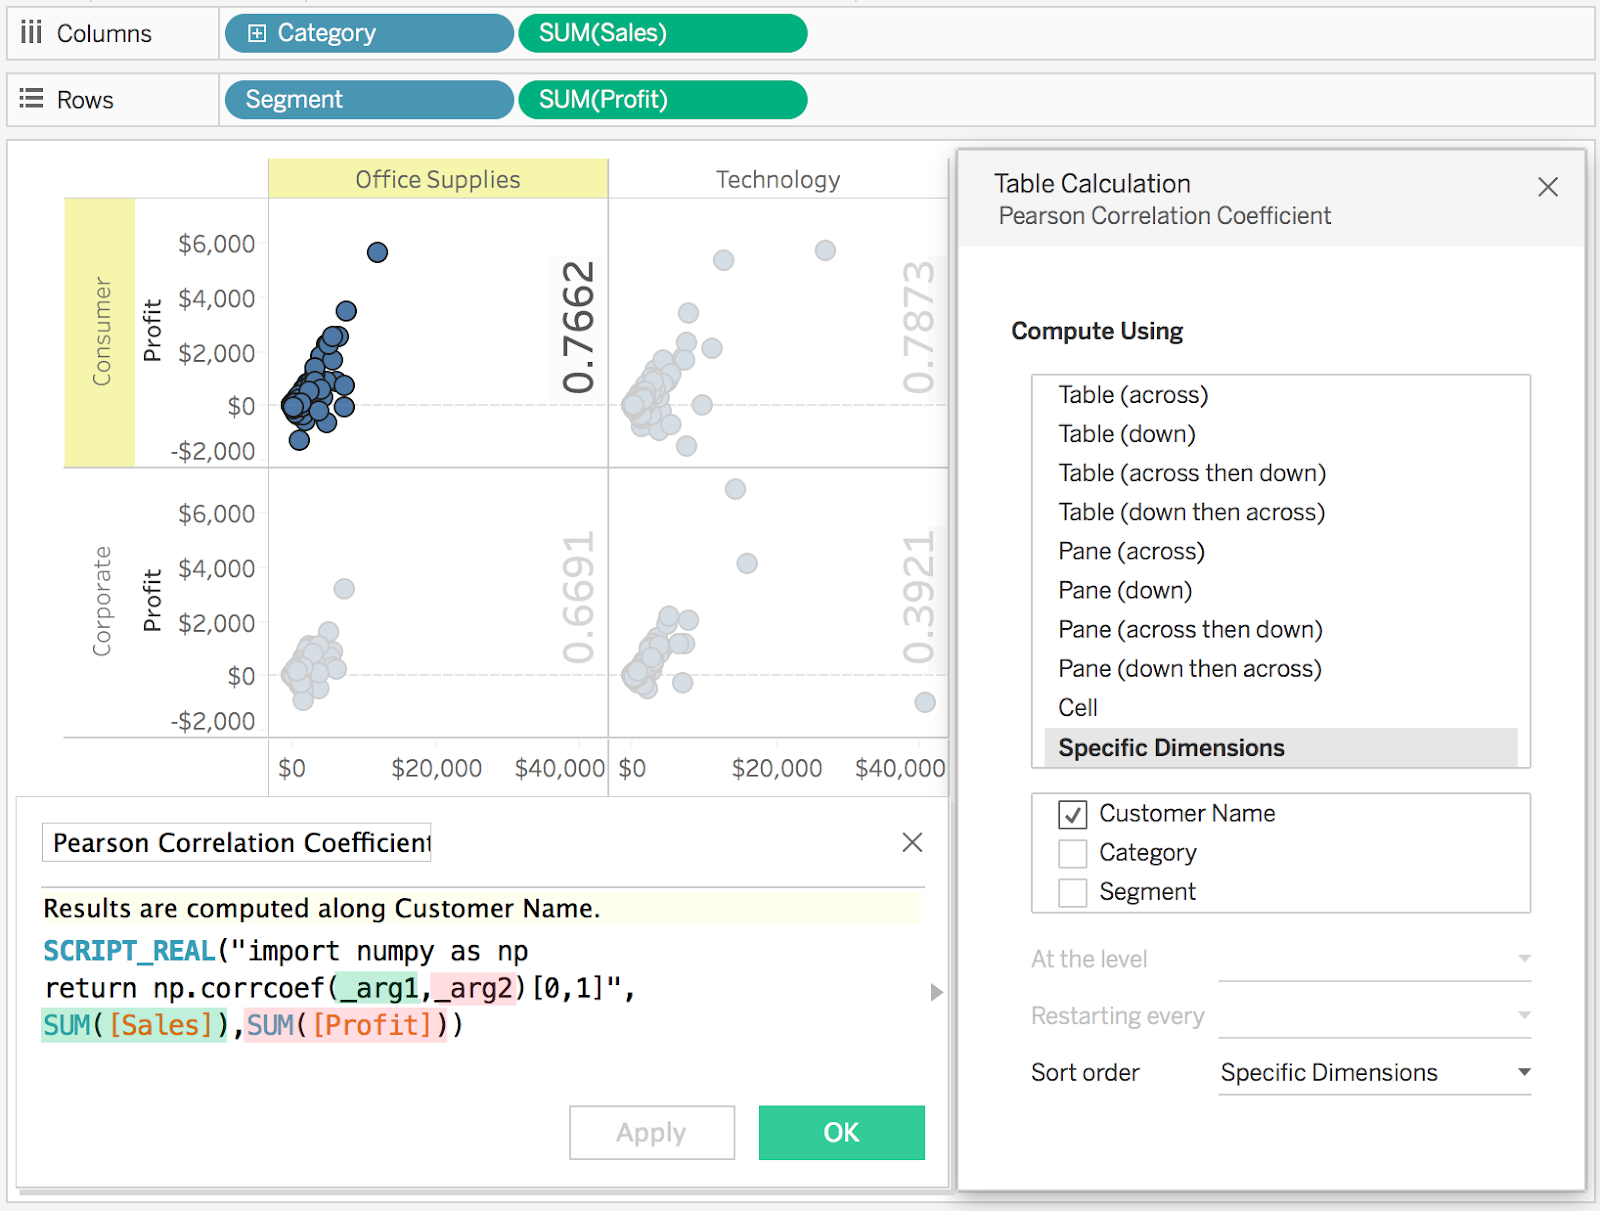
image from: https://tabscifi.golovatyi.info/useful-resources/
Here, we’ve set specific dimensions so that Tableau is now making one call to TabPy for each pane in the view (i.e., each segment-category combination), giving us the information we need while optimizing performance.
Additional Links
Last updated: October 17, 2025