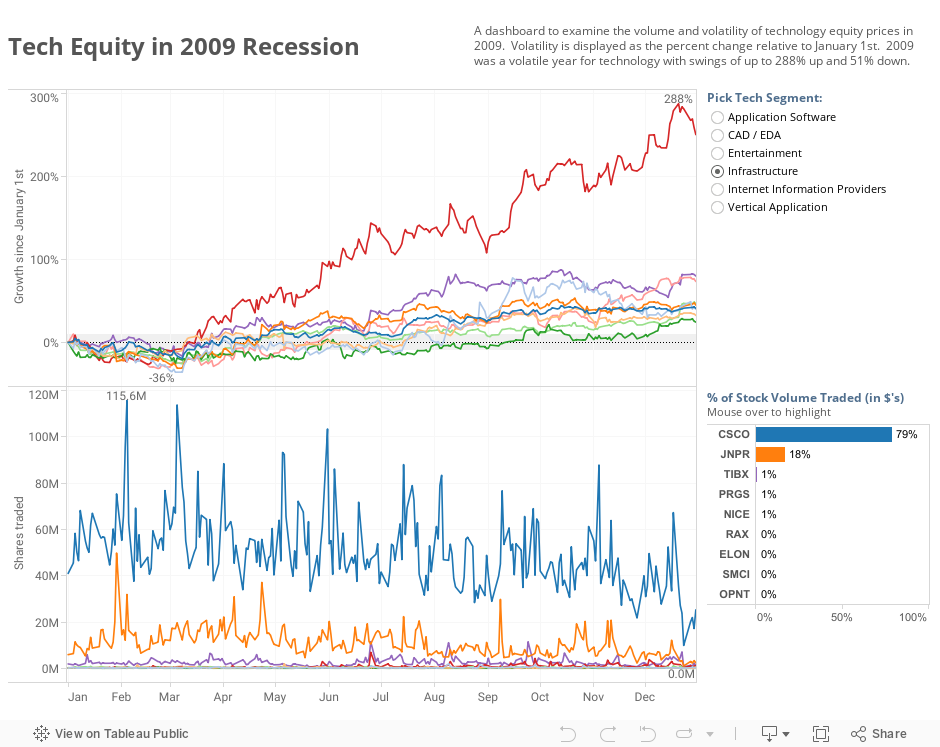
Explore the effects of the 2009 recession on the tech sector
This dashboard shows both the trading volume and volatility of technology equities during 2009, a year in which a severe recession transformed the business landscape. The top chart shows the rise and fall of percentage growth from January through December. Choose a segment to see details. The lower chart displays to number of shares traded to provide a measure of volatility.