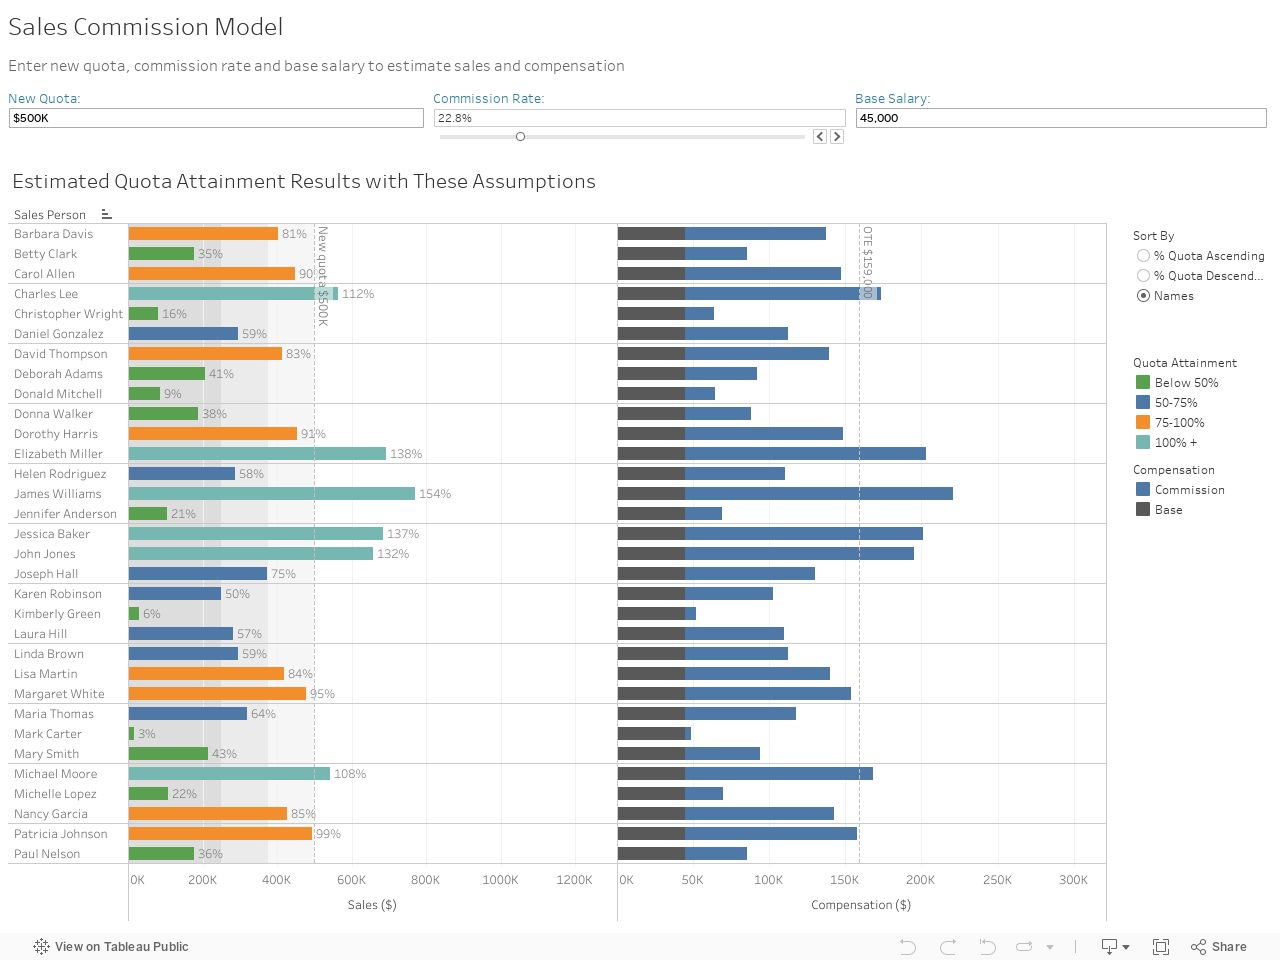
Motivate sales teams by modeling commission rates
Managing a sales team is a lot easier when you have the right insights at your fingertips. Modeling results is simple with Tableau. Using this visualization, you can quickly explore the relationships between compensation type, commission, and quota attainment for a specific group of salespeople, and see the impact on the company as a whole. You can manipulate these variables live to see how results might have panned out differently.
Create and share on Tableau Public
Join the newsletter and find daily inspiration with the Viz of the Day. Yours could be featured next!
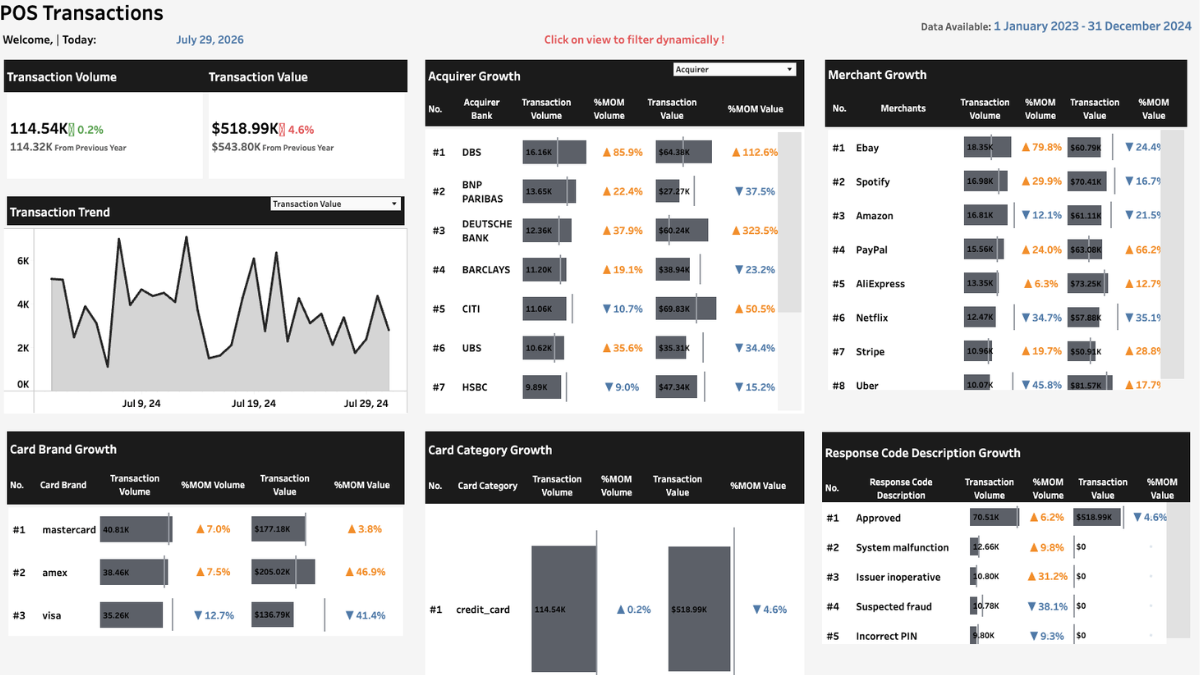
Transaction Insights Dashboard
This #VizOfTheDay by Anibaba Ayodeji delivers a point-of-sale transaction summary through volume distributions, peak hour timelines, and category insights to help finance teams evaluate terminal efficiency and monitor commercial revenue trends. Explore the viz.
Interact with the viz