Motivate sales teams by modelling commission rates
Managing a sales team is a lot easier when you have the right insights at your fingertips. Modelling results is simple with Tableau. Using this visualisation, you can quickly explore the relationships between compensation type, commission and quota attainment for a specific group of salespeople, and see the impact on the company as a whole. You can manipulate these variables live to see how results might have panned out differently.
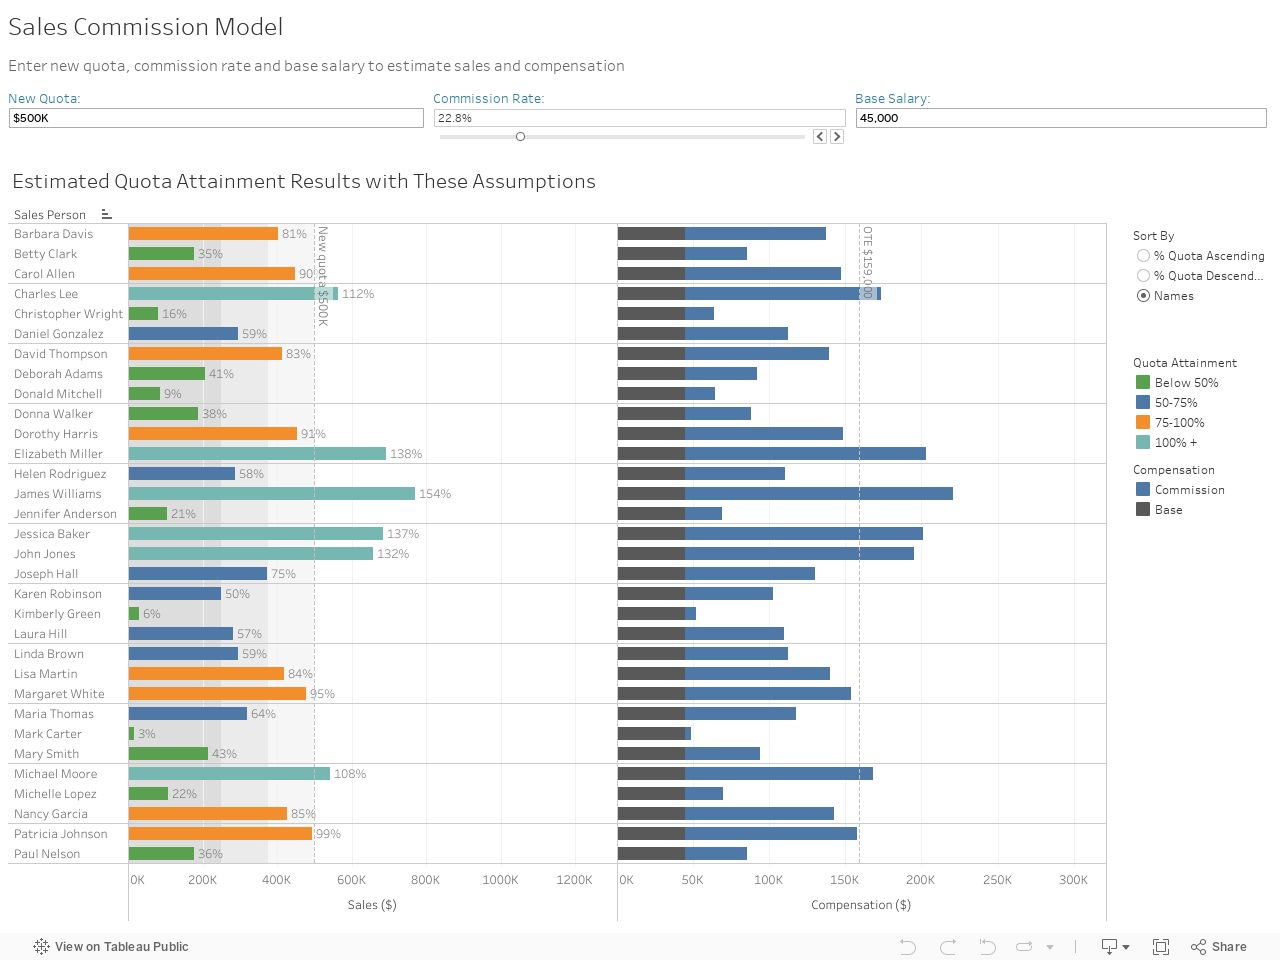
Tableau your mind. Daily.
Get the Viz of the Day delivered right to your inbox from Tableau Public, the world’s largest repository of data stories.
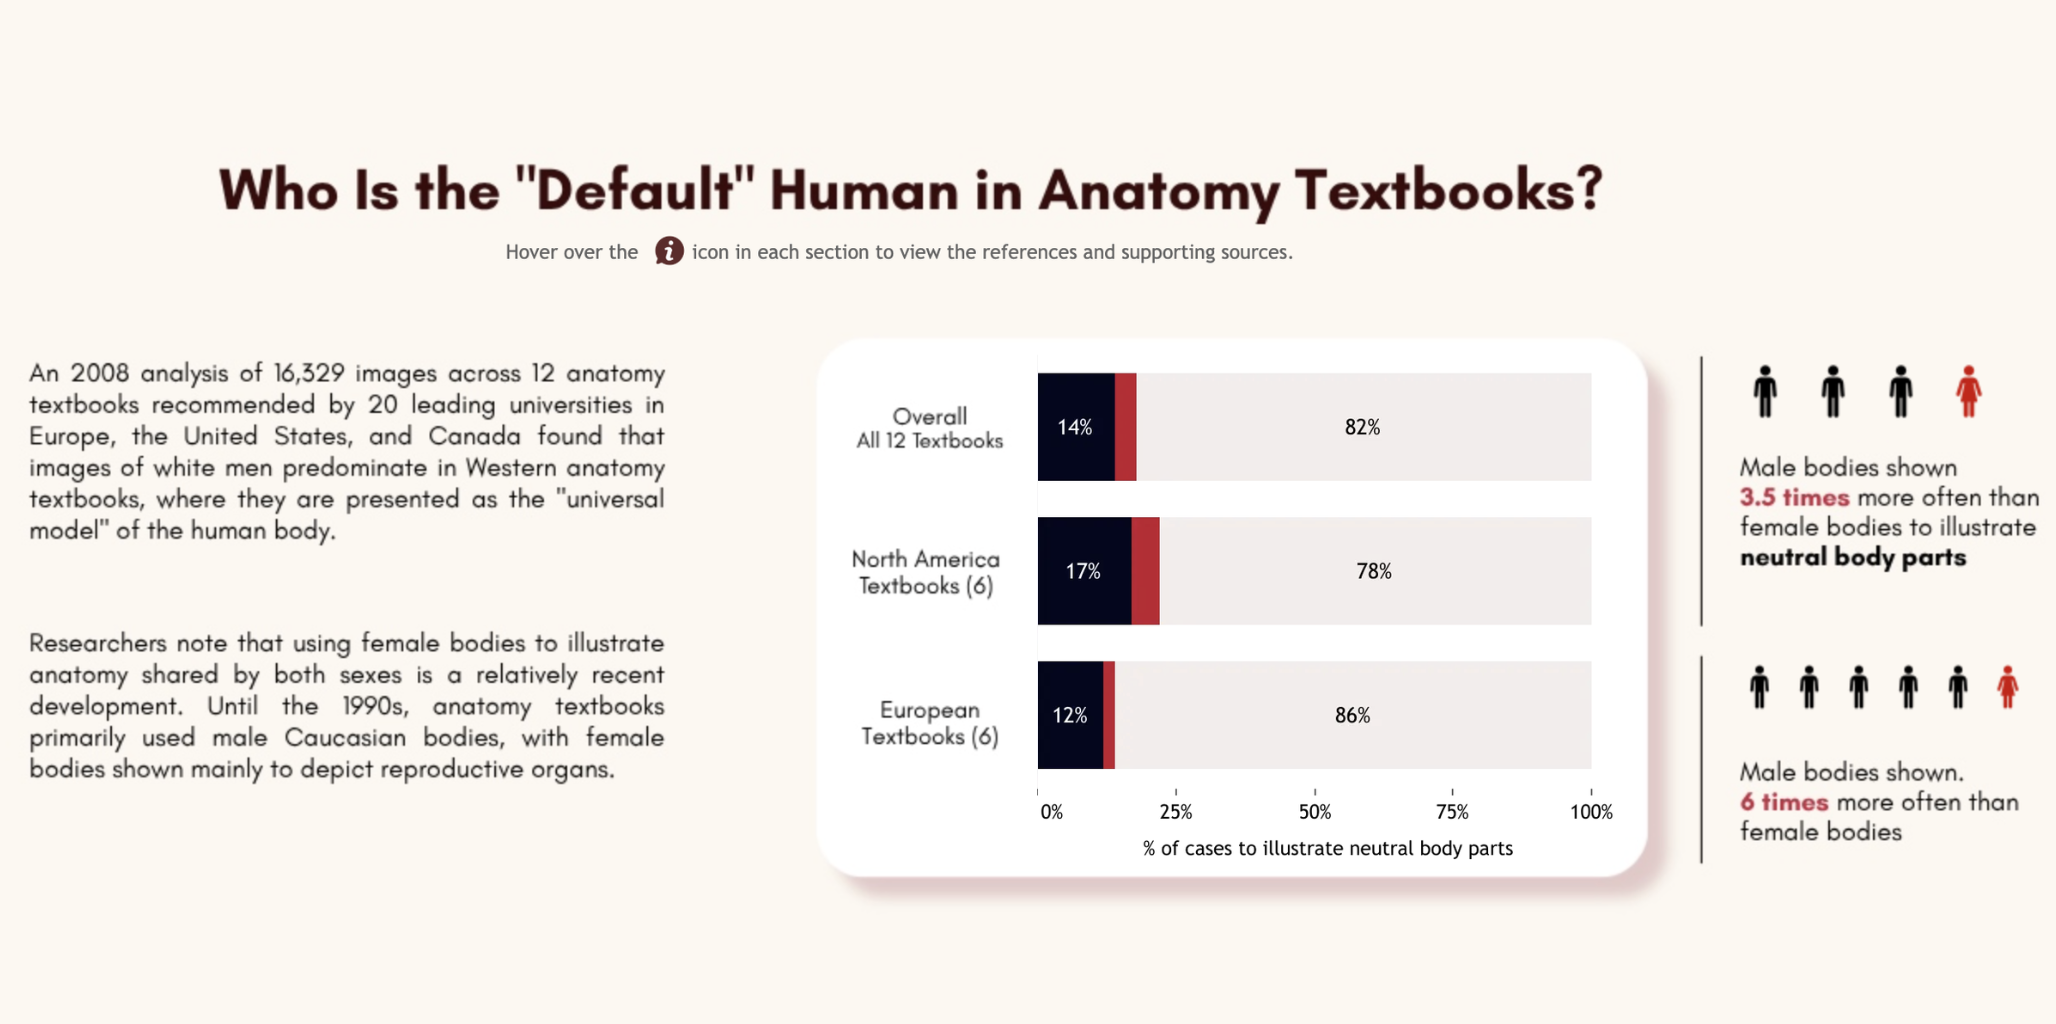
Why Medical Data Fails Women?
Today's #VizOfTheDay by Anindita Mitra highlights the historical and ongoing gender gap in medical research and clinical trials. The dashboard measures disparities across medical education and clinical trial representation to show how systemic data gaps negatively impact women's healthcare outcomes. Explore the viz.
Inspired by Heather Cox.