
How can AI help you accelerate your data culture—and stay more connected across lines of business?
Artificial intelligence (AI) can transform how we work. In this age of agentic AI—where applications augment humans on jobs to be done—humans can collaborate with agents to unearth data-driven insights and make more informed decisions, faster.
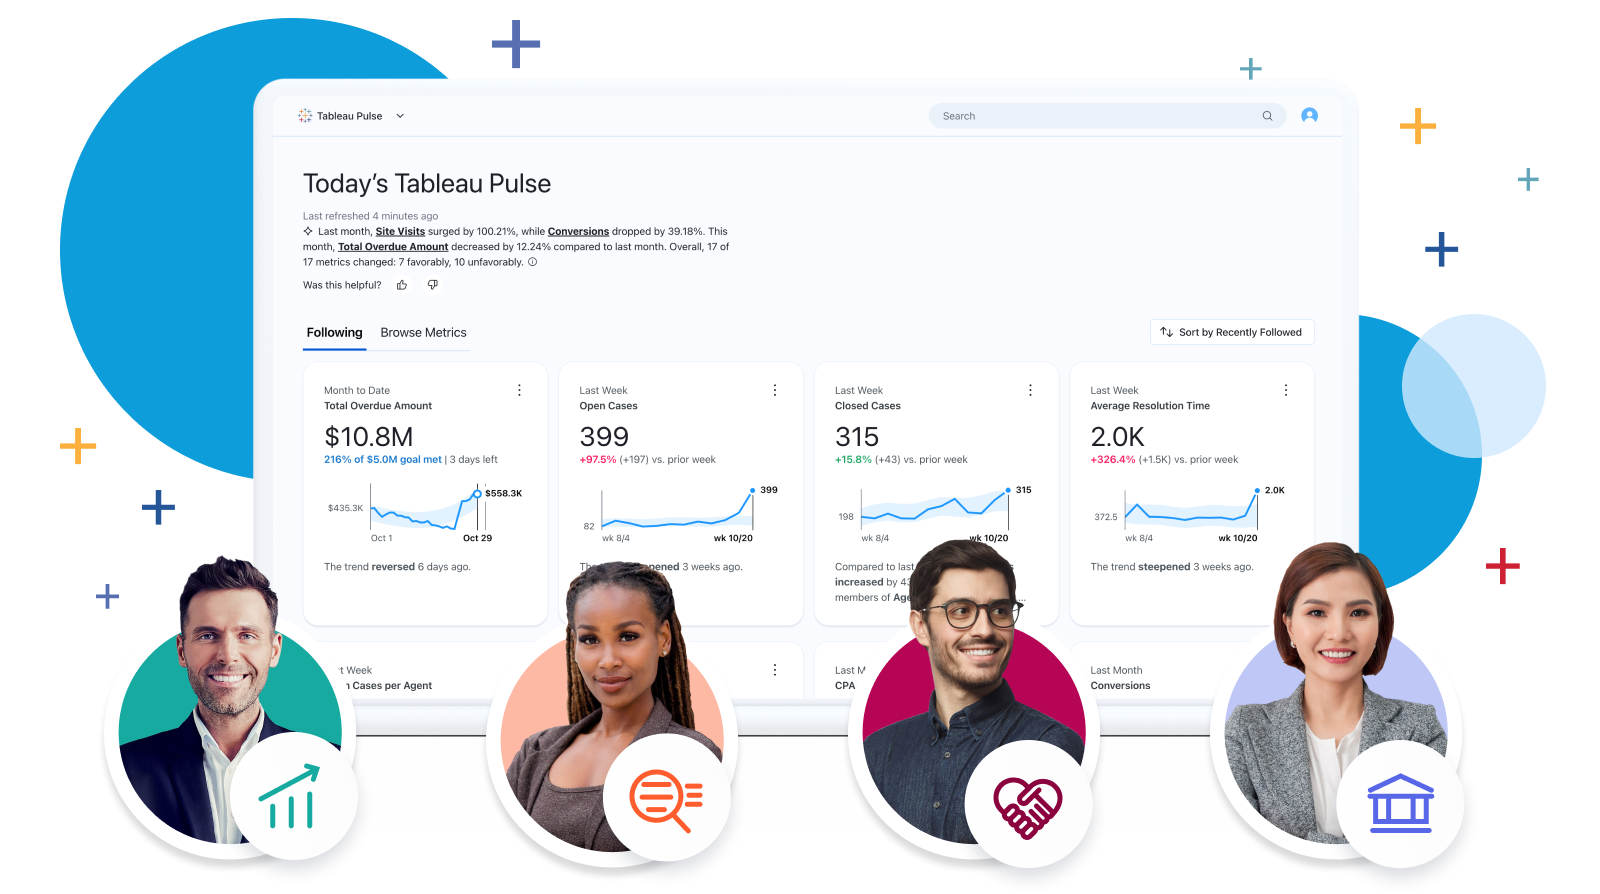
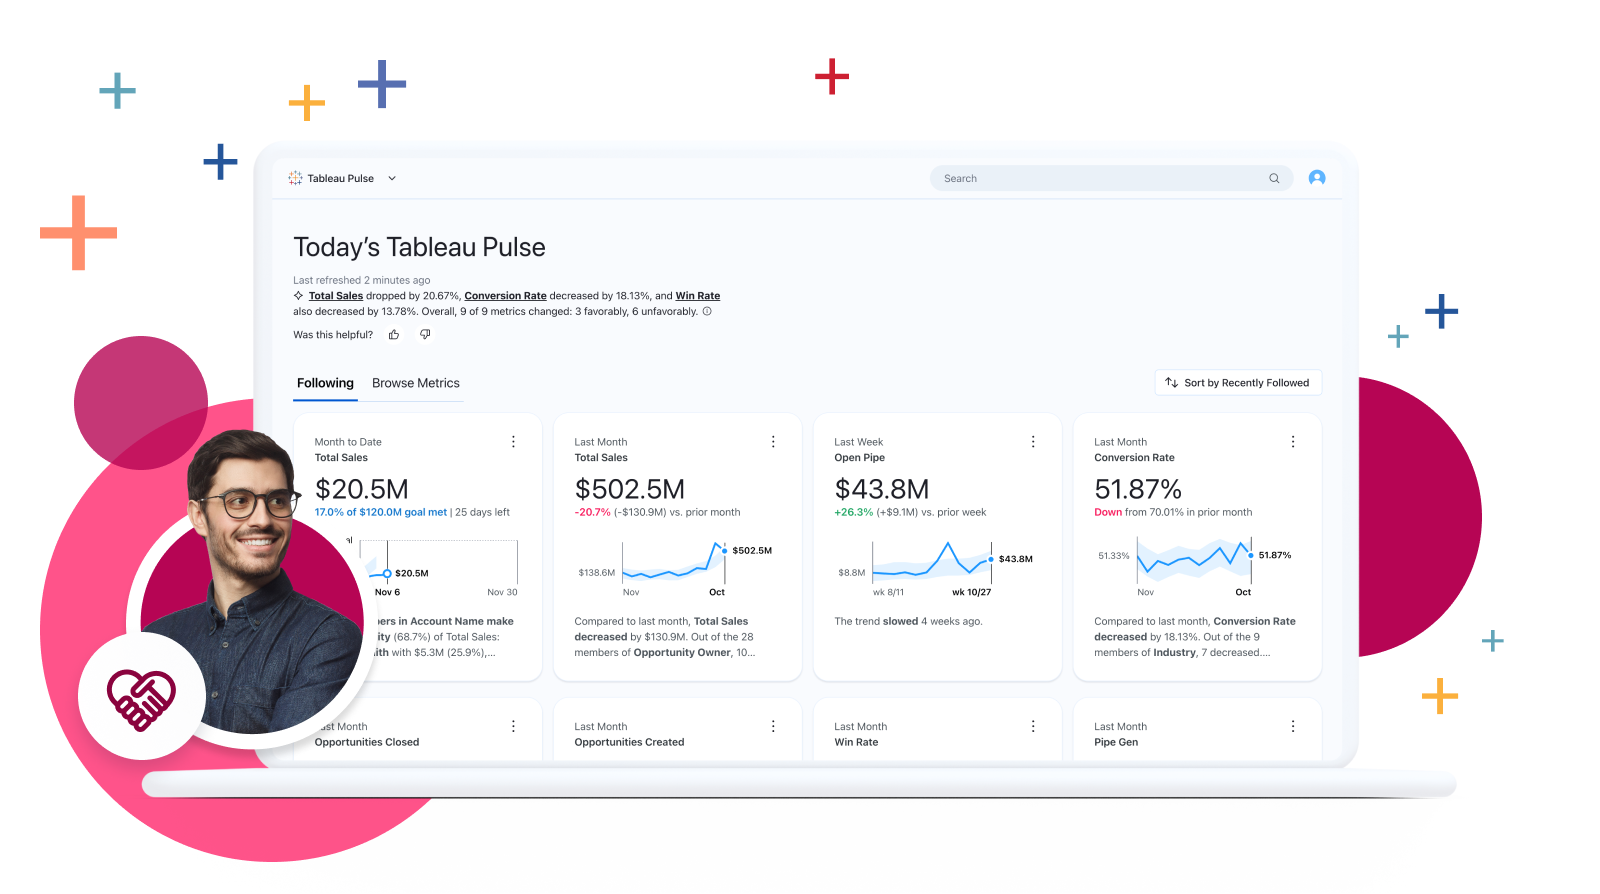
Meet Tableau Pulse, a reimagined data experience built on the Tableau platform, that makes data more accessible to everyone by providing metrics-based insights. Tableau Pulse applies the power of generative AI in Tableau to help you and your organization stay proactively updated on key metrics, and explore deeper to understand trends—regardless of your expertise with data and analytics.
Tableau Pulse brings teams together with the same trusted metrics and KPIs used across an organization. Now, everyone from the CEO to CRO and everyone in their organizations can quickly understand what’s happening in the business, engage with insights, and dive deeper into their data. All of this is delivered directly in your flow of work to quickly scale insights across an enterprise.
Let’s explore how you can use Tableau Pulse for Sales, Marketing, Service, and Finance.

Tableau Pulse brings teams together on shared, trusted metrics and KPIs across the organization.
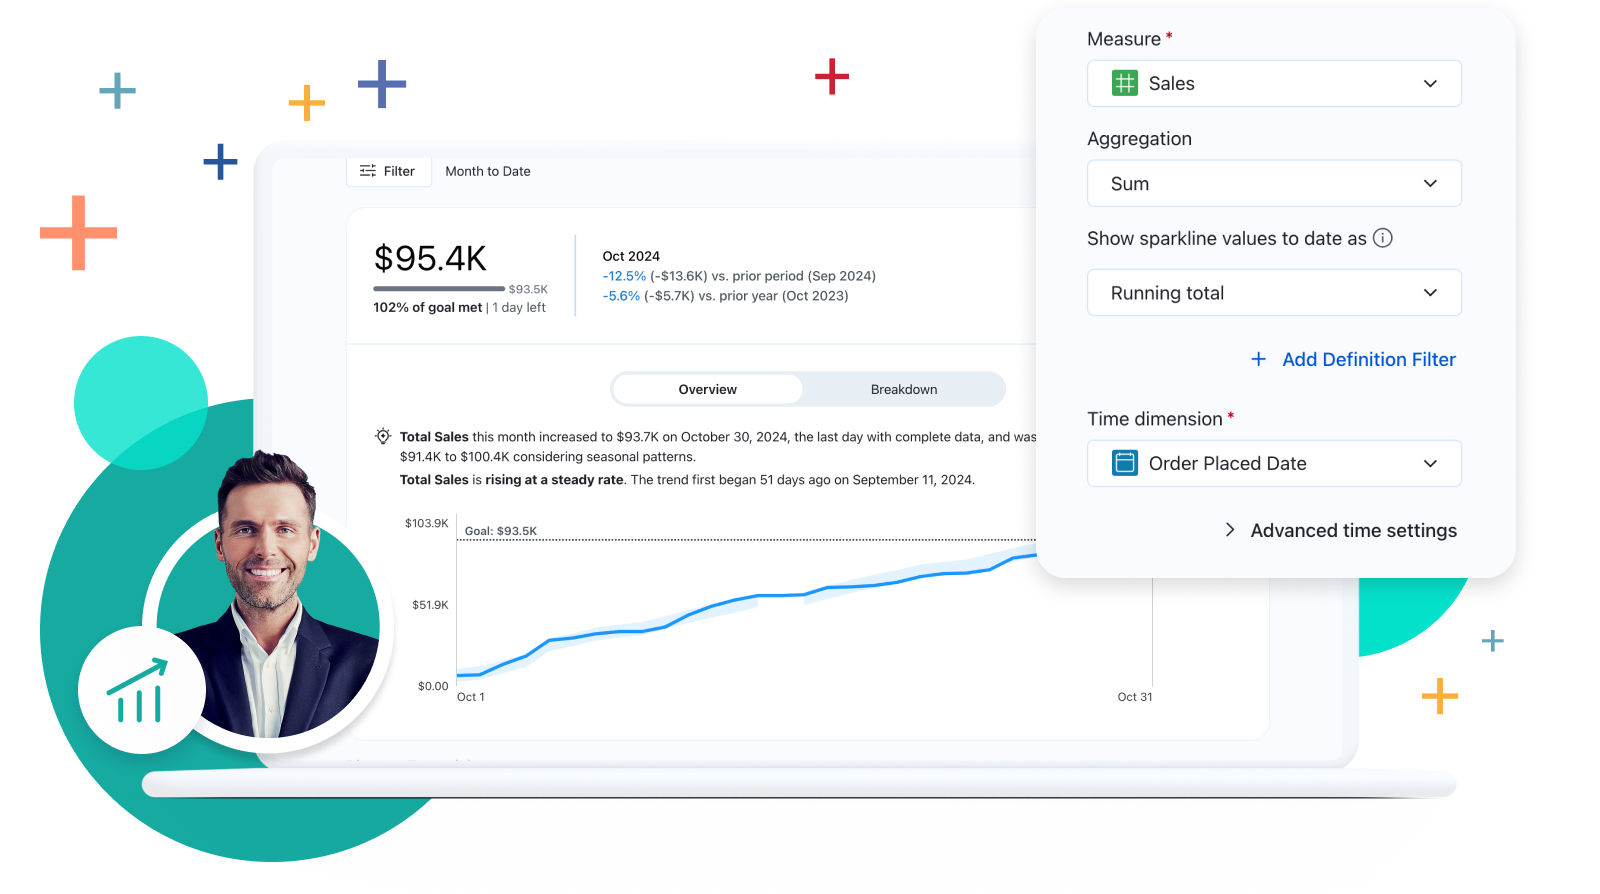
Everyone—from the CEO to the CRO—can see the same metrics and insights to drive the business forward together. With the power and flexibility of the Tableau Pulse Metrics Layer, Tableau administrators define a single metric definition that can be used as a single source of truth to generate business metrics across the business.
Scale data-driven insights with Tableau Pulse
Everyone in your organization—across Sales, Marketing, Service, and Finance—can quickly understand and engage with data-driven insights without building a dashboard or learning a new tool. Tableau Pulse will:
- Deliver proactive insights on how your metrics are trending
- Answer your questions to dig deeper
- Provide natural language insights—enhanced with generative AI
- Deliver insights in the flow of work via Slack, email, Tableau Mobile, and Microsoft Teams
Sales
How Sales Leaders increase win rates, total sales, and more with Tableau Pulse.
Chief Revenue Officers (CROs) need to grow revenue and boost sales efficiency, tracking crucial top-line business metrics like Total Sales, Open Pipeline, and Customer Attrition. But only 35% of sales professionals completely trust the accuracy of their data.
With low trust in the data, it’s critical for an entire organization to align on trusted metrics that are consistently defined from the same underlying data. This is possible with a robust, well-governed Metrics Layer built in Tableau Pulse. Executives and teams—across departments—can access key metrics with Pulse in the Tableau Mobile app to set goals, monitor progress, and get personalized updates.

Only 35% of sales professionals completely trust the accuracy of their data.
How it works
Win Rate Metric
How Tableau Pulse can help sales leaders.
- Quickly scan all your metrics on the Tableau Pulse home page. In this example, we see that total sales have dropped, but win rate has remained constant.
- Select the icon next to your metric (here, Win Rate) to get more context, such as a description or data source.
- Filter by account type—partner accounts are the main driver of Win Rate—and prompt Pulse to further analyze by different dimensions, such as Opportunity, Account, or Industry.
- Pulse identifies key trend drivers by analyzing your data and using AI to suggest questions. Ask your own questions in natural language, too.
- Share those insights directly from your phone and start taking coordinated action across teams.
Marketing
How Marketing Leaders grow campaign ROI, pipeline, and engagement with Tableau Pulse.
Chief Marketing Officers (CMOs) want to analyze how marketing contributes to lead quality, pipeline generation, and campaign success to react to shifting trends and stay ahead of competitors. Handling volumes of fragmented data for personalized marketing is challenging and there's a significant opportunity to improve how effectively data is being used. AI-powered insights into campaign and advertising performance, customer engagement, and more can give marketing teams a much-needed edge.
Marketing and Sales teams can filter, follow, share, and subscribe to the same metrics—working together to drive business growth, improve customer relationships, scale successful campaigns, and grow quality leads.
32% of marketers are completely satisfied with how they use customer data to create relevant experiences.
How it works
Media Spend Metric
How Tableau Pulse can help marketing leaders.
- Access the generative AI-powered Insights Summary on your Pulse home page to get an up-to-date snapshot, in natural language, of your business to help you drive awareness, engagement, and growth.
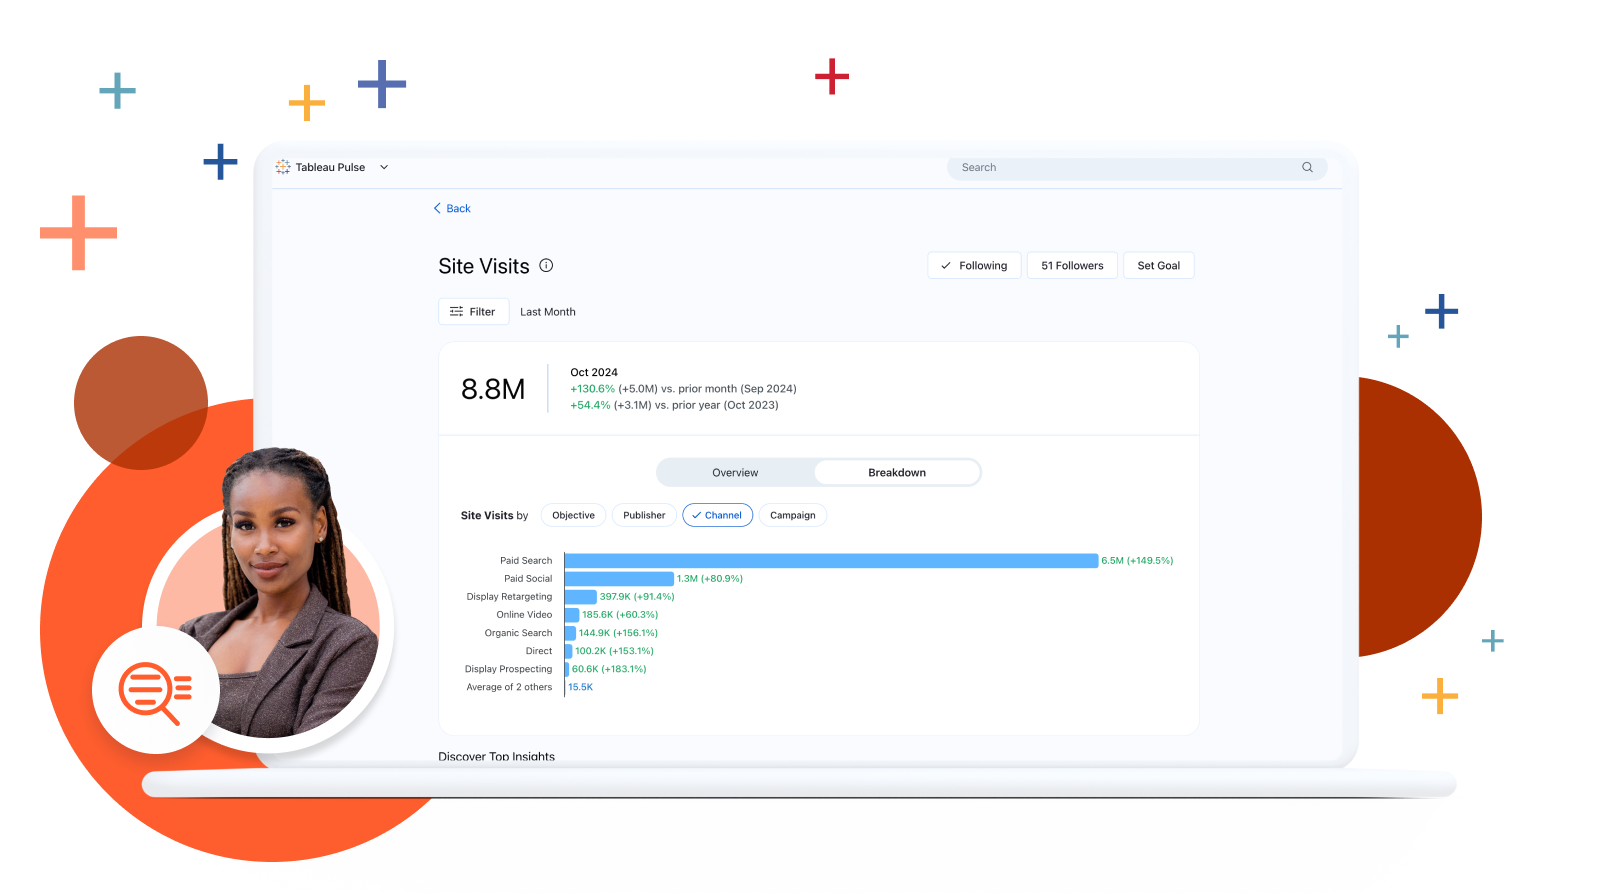
- Check Media Spend and see there was a spike in spending last month.
- Tableau Pulse flags that spike as an outlier, using AI to automatically analyze your data and recommend questions to help you quickly identify key drivers. Select a question prompt to learn more.
- You can select one of the suggested questions so that Pulse shows you a breakdown for the spike in Media Spend, showing paid search as the top contributor.
- Filter to track performance against your monthly goals.
Service
How Service Leaders improve CSAT scores, efficiency, and more with Tableau Pulse.
Chief Operating Officers (COOs) and Chief Information Officers (CIOs)) are responsible for ensuring efficient operations and reliable technology, supporting both internal employees and external customers. Support and service teams manage service availability, case volume, and customer satisfaction (CSAT) scores to monitor service performance, detect trends, and understand drivers to maximize customer retention, loyalty, and lifetime value.
As the demand for effective support grows, so does the adoption of AI to support new tools. In fact, 63% of service professionals say generative AI will help them serve customers faster. Tableau Pulse empowers COOs, CIOs, and service teams to understand how key metrics are trending in order to effectively monitor workloads, and optimize resources to improve efficiency, enhance reliability, and deliver a better service experience—driving both employee productivity and customer satisfaction.

63% of service professionals say generative AI will help them serve customers faster.
How it works
Average Time to Close Metric
How Tableau Pulse can help service leaders.
- Pulse flags a notable increase in your Average Time to Close for internal support cases
- Dive deeper to investigate which Categories, Sub-Categories, and Intake Channels have a higher Average Time to Close.
- With the AI functionality in Tableau Pulse, you can type your own questions in natural language to learn more about which Category Time to Close increased the most.
- Tableau Pulse delivers more context about these categories, showing which cases increased the most, causing your Average Time to Close to rise.
- Share the Pulse metric from Tableau Mobile to discuss next steps with your team.
Finance
How Finance can boost cash flow, profitability, and stability with Tableau Pulse.
The Chief Financial Officer (CFO) and finance departments are deeply involved in making spending decisions and managing the company's bottom line. To successfully partner with all departments to monitor operating expenses and forecast, all lines of business need to use the same trusted data.
CFOs need to evaluate their investments in AI products to ensure they deliver a good return on investment (ROI) and drive revenue for all business units. Trust is fundamental. Thus, AI needs to be trustworthy, efficient, and productive across all departments to help boost profit margins. Tableau Pulse builds consistent metrics for your entire business atop a secure, consolidated data layer.

65% of global C-suite executives believe that trust in AI is essential for driving revenue.
How it works
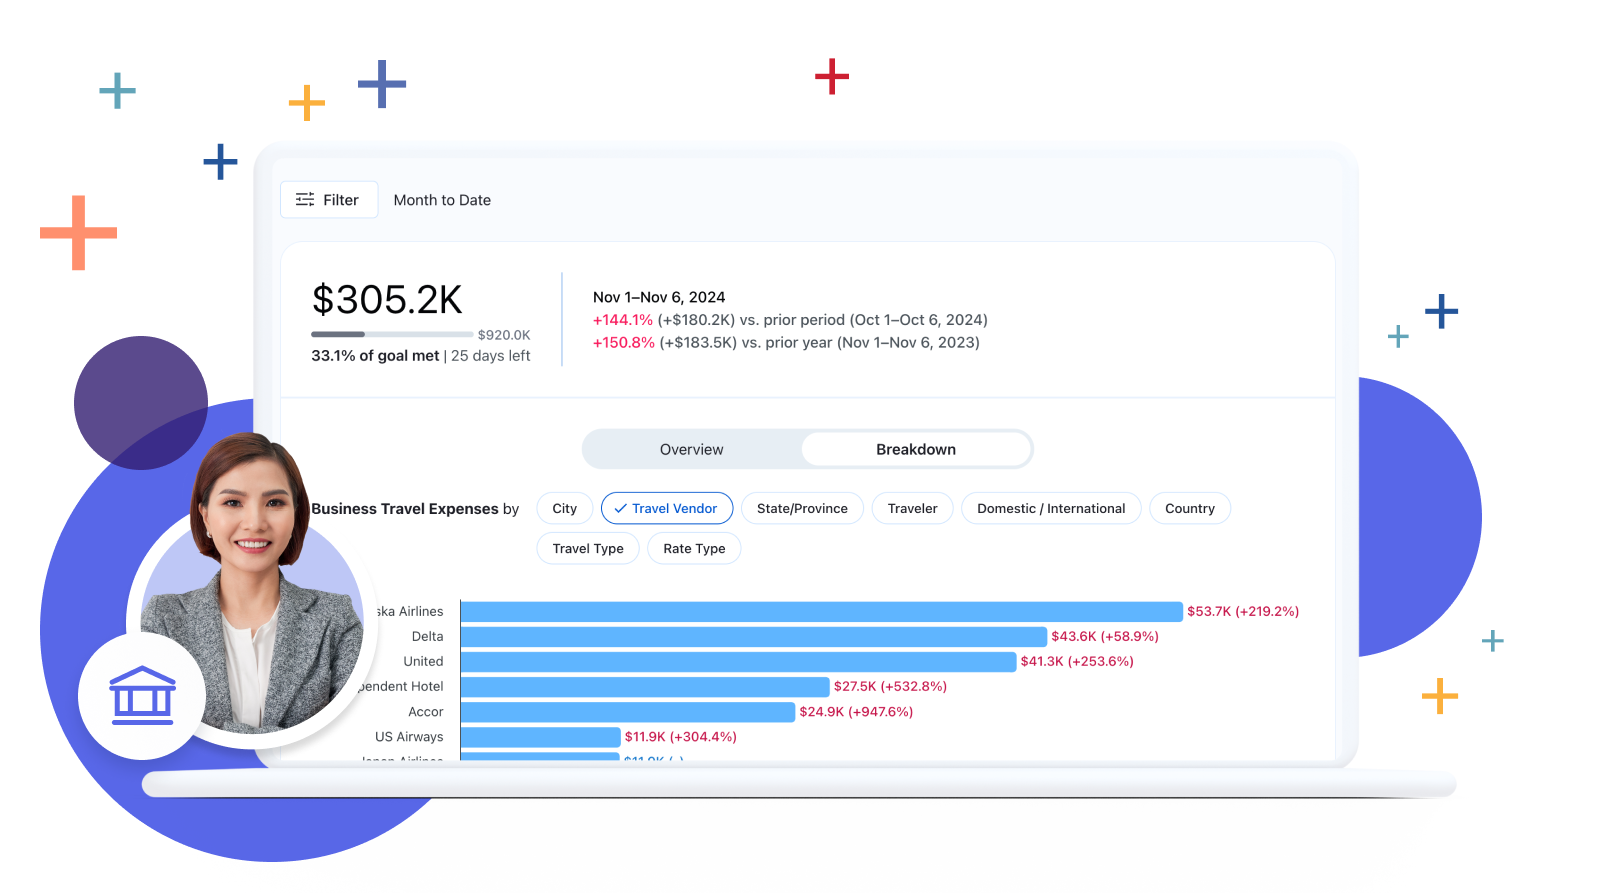
Business Travel Expenses Metric
How Tableau Pulse can help service leaders.
- While scrolling your metrics, you notice that Business Travel Expenses have gone up. You’ve nearly hit your goal even though it’s only the start of the month, so you’ll need to closely monitor this metric.
- Dive deeper with Pulse by selecting the metric to filter through different dimensions or quickly ask questions in natural language.
- Understand the main driver for the cost increase.
- Share it in Slack to immediately flag to relevant teammates by sharing in Slack.
Get started with AI-powered analytics
All lines of business can make the most of their data by uncovering insights powered by trusted AI with Tableau Pulse. It’s impossible to ignore this opportunity to bring teams together around shared metrics, build effective strategies, and take meaningful action to deliver data-driven success.