
University of Melbourne Prepares Students for Today's Data-Driven Workplace with Tableau
University leads the way in skilling students for today's most in-demand jobs.
Meets student demand for visual analytics skills across all disciplines with 1,000% increase in course enrollment in 4 years.
Students get hands-on experience to accelerate skill development.

Students invest significant time and money into their education, and they expect to see a return on that investment in the form of a meaningful career. That’s why helping students develop in-demand skills is a priority for institutions like the University of Melbourne.
Rated Australia’s number one university by the Times Higher Education, the University of Melbourne also ranks 8th globally for graduate employability in the QS World University Rankings (QS Graduate Employability 2022). It retains these rankings, in part, through its innovative curriculum which now includes information visualization. The popular course has been designed in response to demand for data skills from companies and the workforce and is taught with the help of Tableau.
Data skills increasingly critical and demanded by students across all disciplines
Dr. Davood Shojaei, senior lecturer within the Department of Infrastructure Engineering at the University of Melbourne, teaches the university's Information Visualisation course. He shared that the course initially focused on spatial information visualization before being expanded to appeal to more students.
The market needs more people with digital skills, and especially skills to process and visualize large data sets that exist today. That’s why we broadened our offering to teach these skills to students across disciplines.
The university specifically wanted to equip students to identify patterns and insights within data and thereby find answers to issues or challenges. Tableau is taught for this purpose and provides students with an easy way to get started with visual analytics.
“There are a lot of software tools you can use to create visualizations, but many require some level of programming. Tableau, in comparison, can be used by students without any knowledge or experience in programming,” said Shojaei.
The university’s information visualization course is now highly sought after, attracting students from a diverse range of fields, including Geomatics, Computer Science, and Engineering.
Hands-on learning equips students for data-driven future
The University of Melbourne has taken advantage of free licenses and resources from Tableau to help students develop their visual analytics skills. These resources are available as part of Tableau Academic Programs which enable students and teachers around the world with critical data skills.
As part of the university’s information visualization course, students are asked to review videos and other online resources to familiarize themselves with Tableau. They then attend two Tableau-focused sessions. The first session offers an introduction on how to use Tableau, taking students through steps like connecting to data and creating visualizations. The second session focuses on more advanced activities, like creating interactive dashboards and extracting insights.
Following these sessions, students are given an assignment so they can get hands-on and practice the techniques learned. The assignment involves extracting information from a public data set to visually analyze it to support a data story.
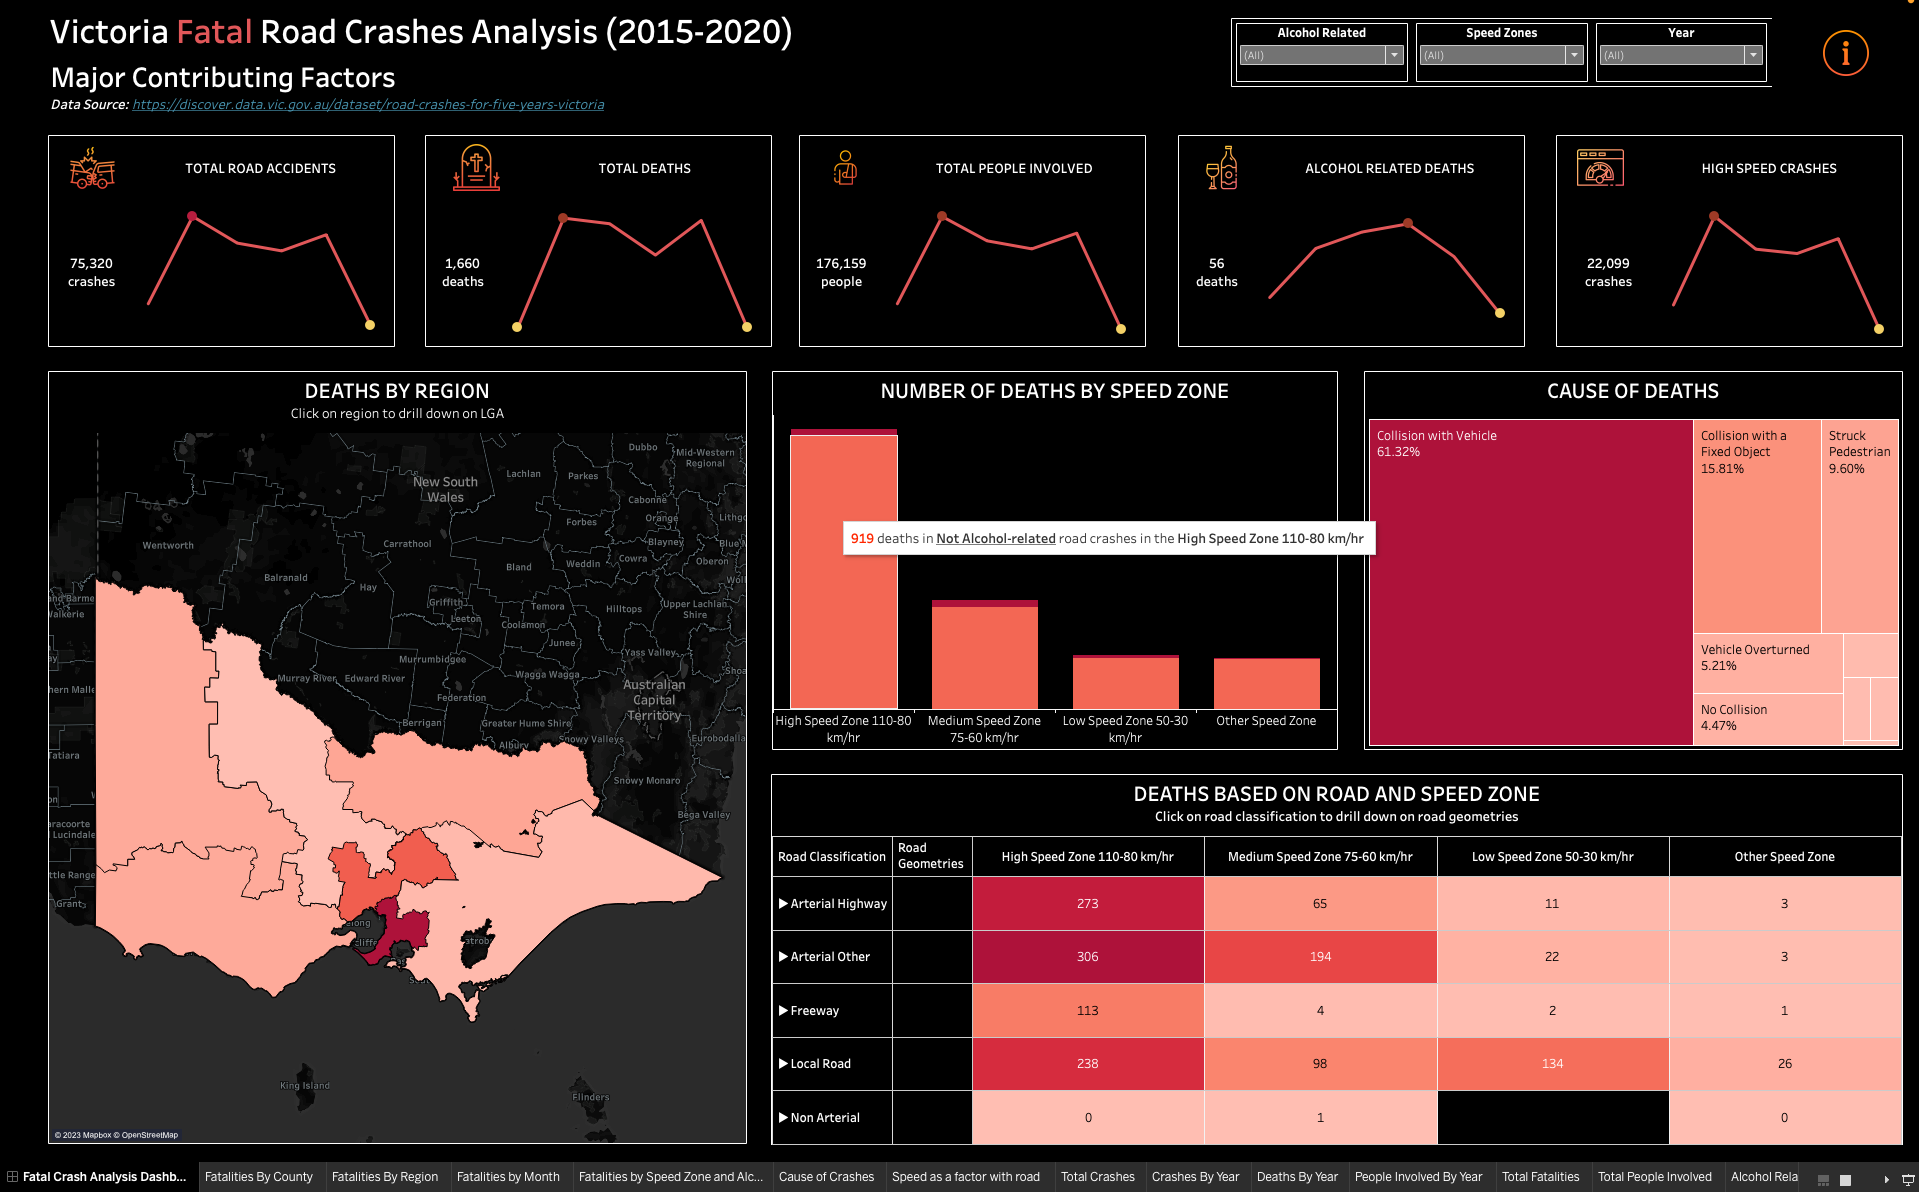
For example, one assignment involved using public data from VicRoads to visualize crash data and highlight various causes and vulnerabilities.
“We can teach students the fundamentals of information visualization, but they really need to apply the techniques themselves to showcase their understanding and knowledge. Tableau provides a powerful tool for them to do this,” said Shojaei.
Enrollment in information visualization course increases by more than 1,000%
The University of Melbourne’s information visualization course continues to grow in popularity and impact with enrollment increasing by more than 1,000 percent in four years. While some of this growth is attributed to the expansion of course content, it also reflects an increased demand for data skills.
“We’re not just teaching students how to create graphs or charts, but teaching them skills they can apply in their daily lives,” said Shojaei. “At least one student has also shared that including Tableau on their resume has helped them find employment.”
Asked to share his advice for others wanting to teach information visualization, Shojaei recommended using Tableau.
“Tableau is easy to use and easy to teach, especially with the support provided by the company. Exposure to these types of tools is also beneficial for students and their future careers,” said Shojaei.
Shojaei himself plans to leverage Tableau’s ease of use to make the university’s information visualization course even more applicable to students outside areas like engineering and computer science. This could include spending more time teaching Tableau as opposed to other tools requiring programming skills.
I want to make the course even more beneficial for students and therefore make them more employable because that’s my aim in teaching this subject.