
Scott Teal
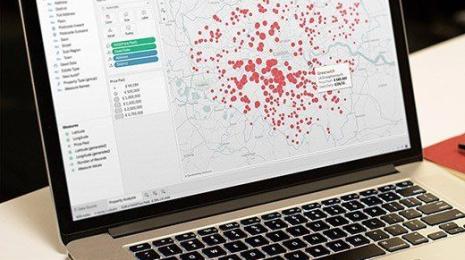 Tableau Community
7 data competitions for data scientists and analysts
 April 12, 2019
Try your hand at these data visualization competitions to test your skills—from data science to data viz, and everything in between.
April 12, 2019
Try your hand at these data visualization competitions to test your skills—from data science to data viz, and everything in between. Visualizations
Iron Viz at #TC18 took us all over the globe with weather data
October 26, 2018
The Iron Viz competition at TC18 featured IBM weather data to tell compelling stories through beautiful dashboard designs. Congratulations to winner Timothy Vermeiren from Belgium!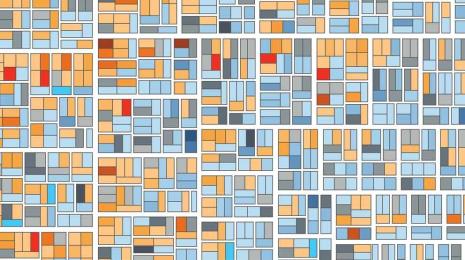 Visualizations
France and Croatia: What data tells us about the 2018 World Cup Final matchup
July 14, 2018
Here is a roundup of World Cup vizzes from Tableau Public, with some key metrics for the 2018 World Cup final matchup.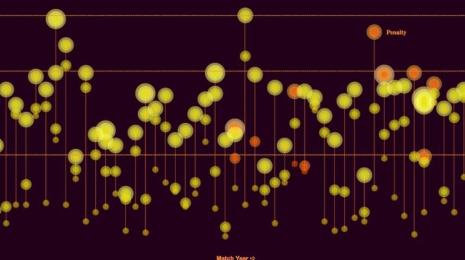 Visualizations
4 ways the Tableau Community visualizes World Cup data
June 29, 2018
Calling all World Cup fans! Here are a few visualizations that demonstrate just how rich the World Cup is with data.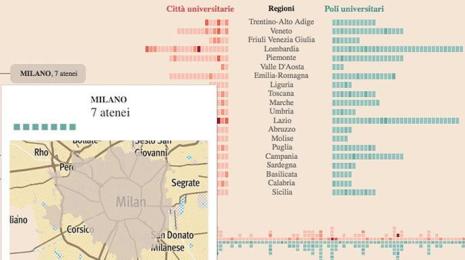 Visualizations
Roundup of examples of Viz in Tooltip from the Tableau Community
January 25, 2018
Curious about Tableau 10.5's Viz in Tooltip feature? Discover the beautiful vizzes, tips, and tricks the Tableau community has already created using Viz in Tooltip.