Transforming Healthcare Data into Insight with Tableau Visual Analytics
Replaced manual reporting efforts
Real-time insight into acute hospital services
Uncover hospital patterns and trends
According to Tom Dewar, Head of Information at St. George’s Healthcare NHS Trust in London, Tableau is helping the hospital convert information into insight and improve patient outcomes. “Tableau cements anecdotally-held truths and busts myths,” he says. Immensely popular across the hospital—based on its ease of use and ability to instantly answer questions—the Tableau visual analytics solution is helping St. George’s to deliver outstanding patient care and meet the challenges of cost reduction, resource allocation, and compliance regulations.

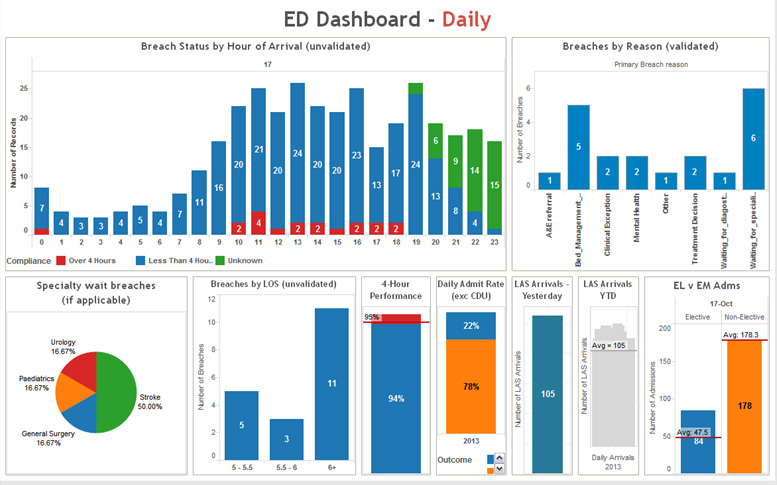
Staffers can view dashboards for at-a-glance understanding of patient flow within the Emergency Department
Optimizing clinical outcomes
With more than 6,000 staff caring for patients around the clock, St. George’s Healthcare NHS Trust is the largest healthcare provider in southwest London. Data from the hospital’s electronic health records and other applications creates an unprecedented opportunity for the Trust to accelerate decision making, optimize clinical outcomes, and improve operational performance.
However, reliance on manual reporting systems—such as spreadsheets, slide decks, and pivot tables—made preparing reports time-consuming. Information was often out of date—up to three months old—by the time it reached the clinical directors and other decision makers. A lack of reporting consistency between departments also prevented teams being compared against one another.
Tom Dewar, Head of Information at St. George’s Healthcare NHS Trust, experienced the problem first-hand. “We were gluing together siloed information with our bare hands,” he says. “We compile scorecards on issues such as number of patients in Accident and Emergency, waiting times, and patient readmissions. So much time was spent gathering the data, it was often too old to be acted upon. We needed to be more proactive.”
By capturing rich, timely insight into the hospital’s current behavior, the team is able to advance care coordination, improve care quality and increase healthcare efficiency.
Tableau beats QlikView on almost every count
Dewar and his team quickly shrank a shortlist of potential analytics solutions, which included Tableau, QlikTech’s QlikView, SAP Business Objects, and Microsoft, down to two possible suitors: Tableau and QlikView.
“Tableau edged QlikView on almost every score,” he says. “The ease of use, total cost of ownership, and top right position in the Gartner Magic Quadrant all favored Tableau.”
Owing to the insatiable demand among users for the best-in-class platform for visual analytics, an initial deployment of Tableau Desktop licenses quickly blossomed into almost 100 Tableau Server users.
“Tableau Professional Services did a great job in helping us with the planning and installation. Their knowledge, experience and commitment—coupled with the general ease of use of Tableau—meant we were live in days,” says Dewar.
What difference is Tableau making? For the first time, St. George’s has accurate, near real-time insight into acute hospital services, plus a wide variety of specialist hospital-based and community services. For example, the quarterly scorecard-based reporting has moved to an almost continuous process, with key clinical divisions like Medicine, Surgery, and Women & Children now having information on their services never more than one day old.
“By capturing rich, timely insight into the hospital’s current behaviour, the team is able to advance care coordination, improve care quality and increase healthcare efficiency,” says Dewar.
Accelerating data-driven healthcare decision making
Dewar cites an example of this in action. “Our chief executive was recently talking to hospital commissioners about the pressure of coping with increased volumes of patients during the winter months. Using Tableau, it took me just 30 minutes to create a visual interpretation of why we are so busy.
This included an ‘Arrivals’ dashboard displaying patient arrival metrics by date, by specialty and other criteria. When he asked what was behind the demand, it took me only five minutes more to create a visual showing stroke activity to be one of the primary causes," says Dewar. "Being able to quickly uncover important patterns and trends like these are essential to data-driven decision making. In the past, I would have struggled to get an answer back the same day,” he says.
The aim is to eventually move towards self-service analytics for key areas of the hospital, with Dewar’s team concentrating on in-depth analytical work and statistical analysis. “Tableau is so easy to use, we want consultants, divisional heads, managers, and other staff to answer questions themselves like, ‘how many heart patients did we see last year?’, or ‘how many patents are delivered to Accident and Emergency by ambulance, versus walk-in cases?’ By answering questions like these more quickly, St. George’s will be able to increase patient flow, improve outcomes, and ensure every touch-point with the patient and their family is executed flawlessly.
“Everyone who sees Tableau instantly falls in love with it,” he adds. “It allows them to gain insight into their business like they’ve never had before. Our over-riding aim is to deliver outstanding patient care against a backdrop of unrelenting pressure to reduce costs, maximize resource allocation, and meet compliance considerations. Tableau will take St. George’s a long way towards achieving those goals.”