Welcome to Tableau Cloud
Learn how to build, interact and share workbooks on the web in a few easy steps
Four quick steps to get started
If you're looking to get acquainted with your Tableau Cloud site, you've come to the right place. This guide introduces you to Tableau Cloud, how to build views and dashboards, and how to share your insights with your team. We'll even point you in the right direction of additional resources to help you start strong.

Navigate your site
Take a Quick Tour. Learn how to navigate your new site and see how content is organized in Tableau Cloud.
More resources
- Online Help: Navigating Tableau Cloud
Author on the web
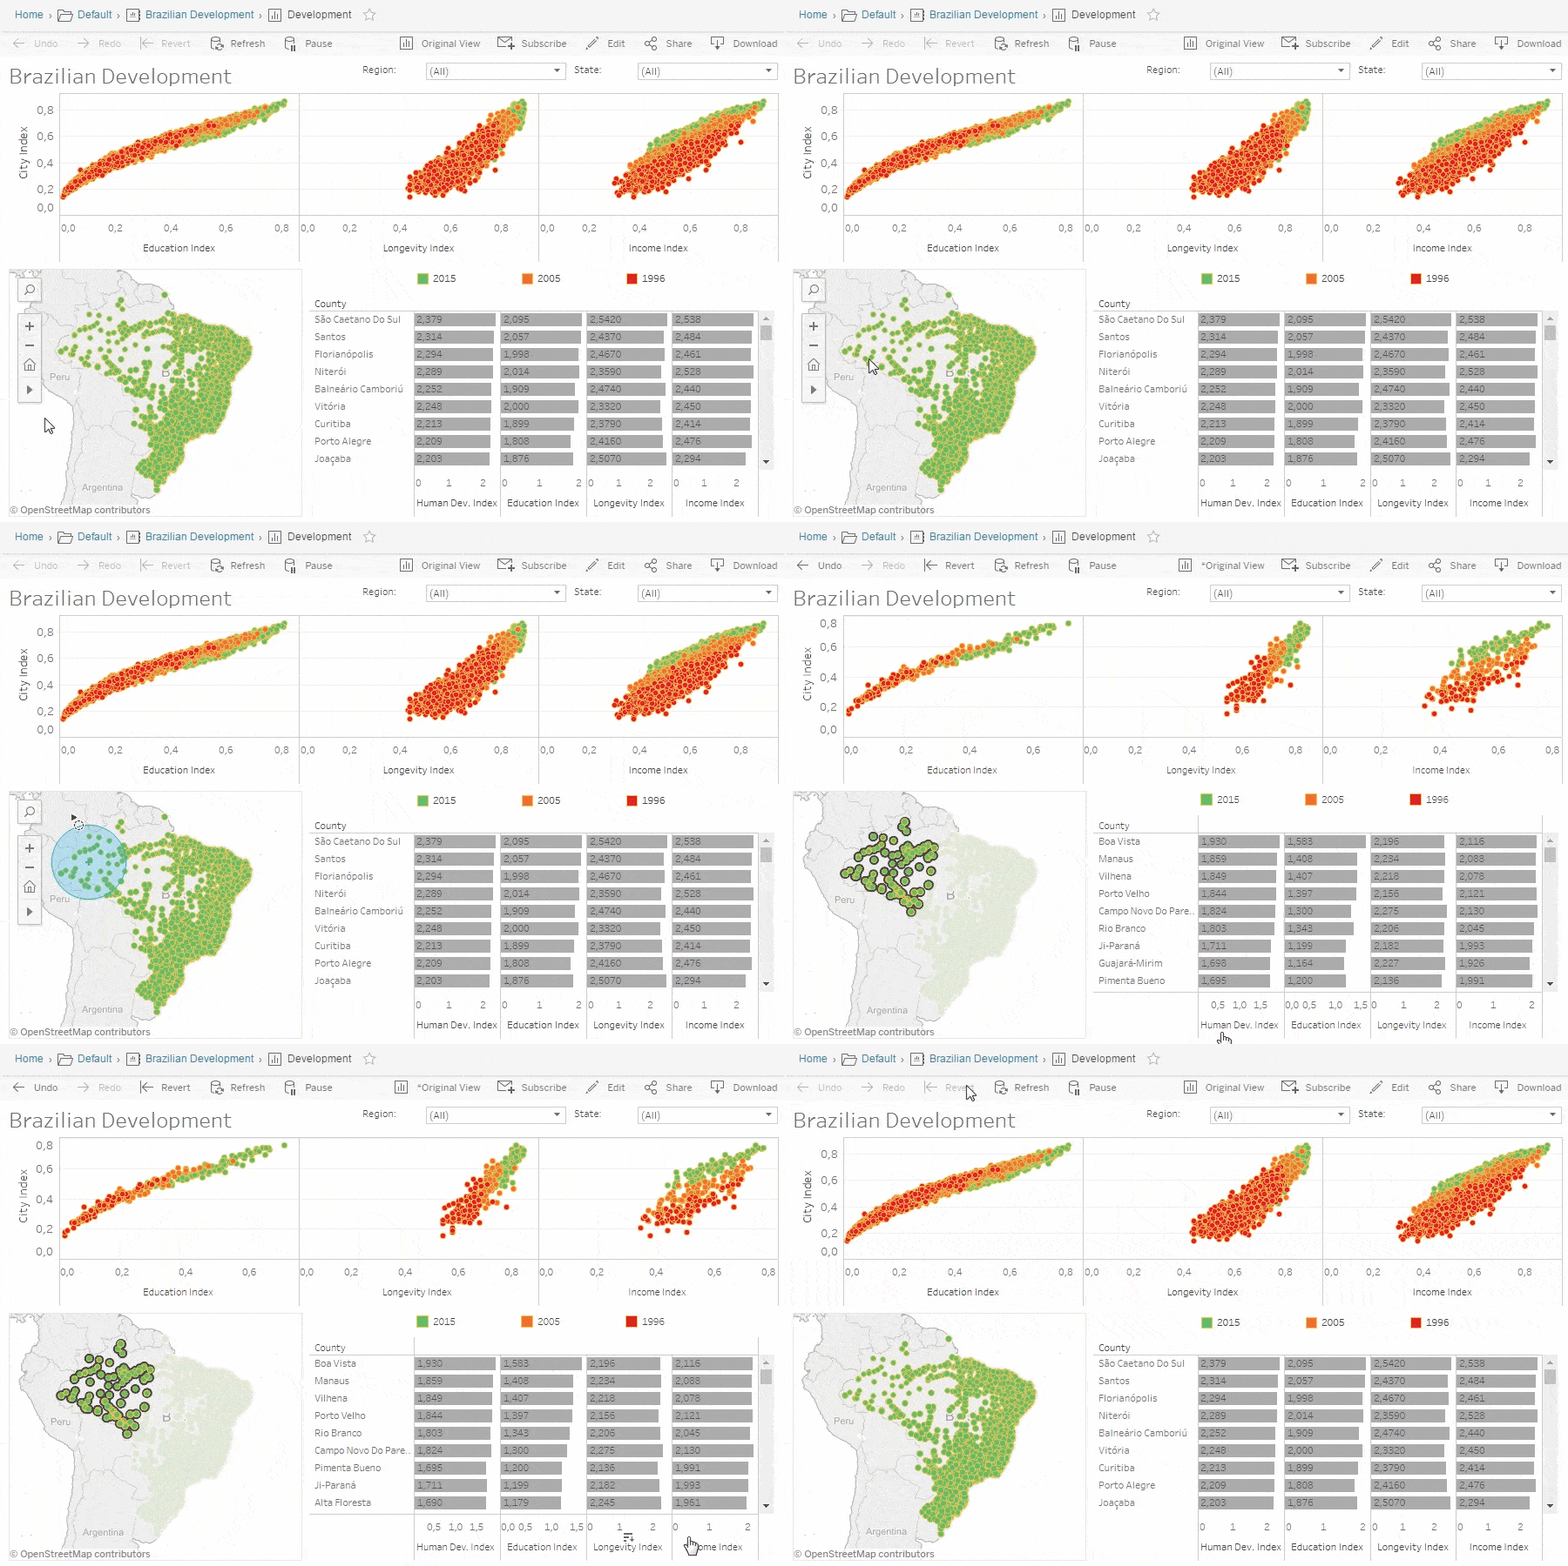
Edit and create dashboards in your browser. Edit and create dashboards in your browser. Learn how to create new workbooks or edit existing ones directly on the web.
More resources
- Online Help: Getting Started with Web Authoring on the Web
- Online Help: Tour the Web Authoring Workspace
View and interact with dashboards
Interact with published dashboards. Learn how to get the most from published content with custom views, tagging and favorites.
More resources
- Online Help: Interacting with Content on the Web
- Online Help: Search for Content
- Online Help: Tag Content
- Online Help: Mark Your Favorites
- Online Help: Custom Views
Share views

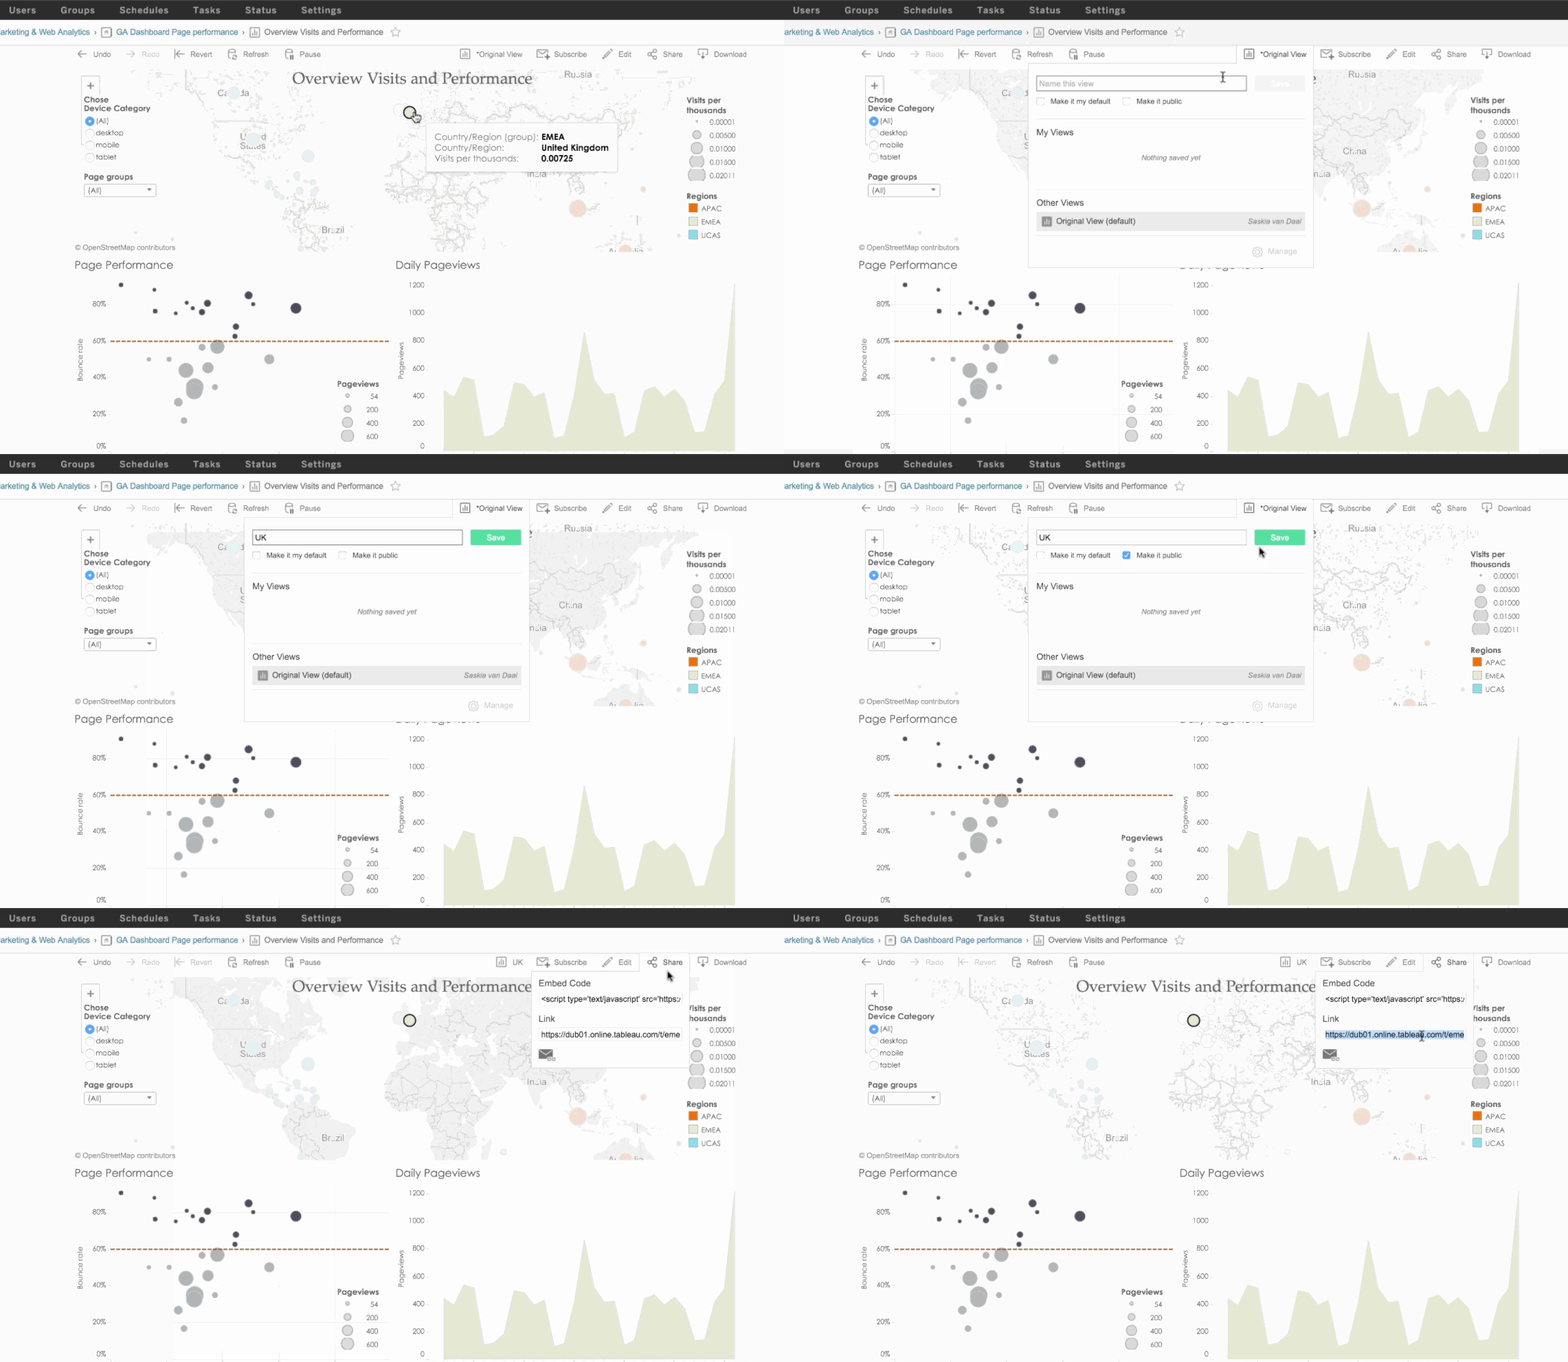
Collaborating with data in Tableau Cloud is easy. Collaborating with data in Tableau Cloud is easy. Share dashboard views directly via URL or email, embed in web pages, or even subscribe to automatic updates. See how to share in seconds.
More resources
- Online Help: Sharing Views
- Online Help: Subscribing to Views
- Online Help: Receive Data-Driven Alerts
Try out what you've learned.
Ready to dive
deeper?
Tableau Mobile App
Access your analytics on the go with Tableau Mobile apps for iPhone or Android.
Tableau Cloud Community
Connect with other Tableau Cloud users to learn, ask questions, and level up your data game.
Tableau Cloud Tips
Master the details with the ongoing blog series by Tableau Cloud experts.