When using data, most people agree that your insights and analysis are only as good as the data you are using. Essentially, garbage data in is garbage analysis out. Data cleaning, also referred to as data cleansing and data scrubbing, is one of the most important steps for your organization if you want to create a culture around quality data decision-making.
In this article we'll cover:
What is data cleaning?
Data cleaning is the process of fixing or removing incorrect, corrupted, incorrectly formatted, duplicate, or incomplete data within a dataset. When combining multiple data sources, there are many opportunities for data to be duplicated or mislabeled. If data is incorrect, outcomes and algorithms are unreliable, even though they may look correct. There is no one absolute way to prescribe the exact steps in the data cleaning process because the processes will vary from dataset to dataset. But it is crucial to establish a template for your data cleaning process so you know you are doing it the right way every time.
What is the difference between data cleaning and data transformation?
Data cleaning is the process that removes data that does not belong in your dataset. Data transformation is the process of converting data from one format or structure into another. Transformation processes can also be referred to as data wrangling, or data munging, transforming and mapping data from one "raw" data form into another format for warehousing and analyzing. This article focuses on the processes of cleaning that data.
How to clean data

While the techniques used for data cleaning may vary according to the types of data your company stores, you can follow these basic steps to map out a framework for your organization.
Step 1: Remove duplicate or irrelevant observations
Remove unwanted observations from your dataset, including duplicate observations or irrelevant observations. Duplicate observations will happen most often during data collection. When you combine data sets from multiple places, scrape data, or receive data from clients or multiple departments, there are opportunities to create duplicate data. De-duplication is one of the largest areas to be considered in this process. Irrelevant observations are when you notice observations that do not fit into the specific problem you are trying to analyze. For example, if you want to analyze data regarding millennial customers, but your dataset includes older generations, you might remove those irrelevant observations. This can make analysis more efficient and minimize distraction from your primary target—as well as creating a more manageable and more performant dataset.
Step 2: Fix structural errors
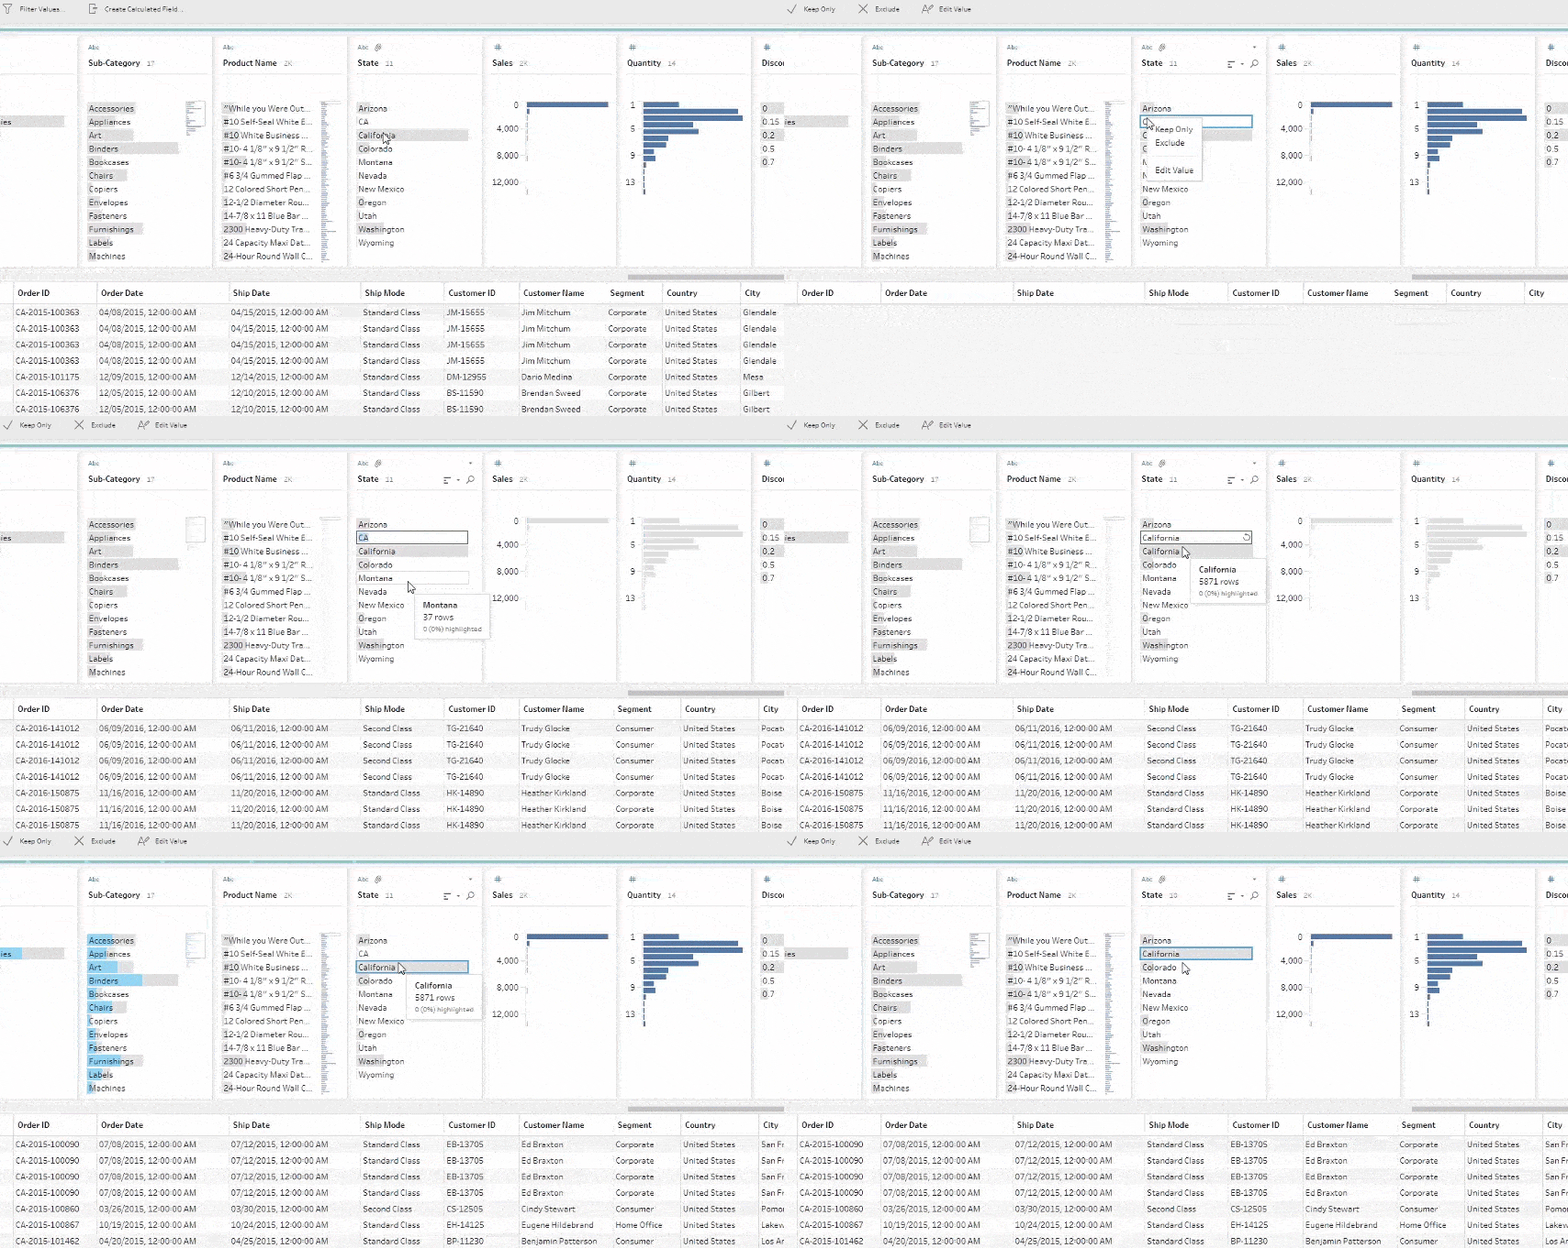
Structural errors are when you measure or transfer data and notice strange naming conventions, typos, or incorrect capitalization. These inconsistencies can cause mislabeled categories or classes. For example, you may find “N/A” and “Not Applicable” both appear, but they should be analyzed as the same category.
Step 3: Filter unwanted outliers
Often, there will be one-off observations where, at a glance, they do not appear to fit within the data you are analyzing. If you have a legitimate reason to remove an outlier, like improper data-entry, doing so will help the performance of the data you are working with. However, sometimes it is the appearance of an outlier that will prove a theory you are working on. Remember: just because an outlier exists, doesn’t mean it is incorrect. This step is needed to determine the validity of that number. If an outlier proves to be irrelevant for analysis or is a mistake, consider removing it.
Step 4: Handle missing data
You can’t ignore missing data because many algorithms will not accept missing values. There are a couple of ways to deal with missing data. Neither is optimal, but both can be considered.
- As a first option, you can drop observations that have missing values, but doing this will drop or lose information, so be mindful of this before you remove it.
- As a second option, you can input missing values based on other observations; again, there is an opportunity to lose integrity of the data because you may be operating from assumptions and not actual observations.
- As a third option, you might alter the way the data is used to effectively navigate null values.
Step 5: Validate and QA
At the end of the data cleaning process, you should be able to answer these questions as a part of basic validation:
- Does the data make sense?
- Does the data follow the appropriate rules for its field?
- Does it prove or disprove your working theory, or bring any insight to light?
- Can you find trends in the data to help you form your next theory?
- If not, is that because of a data quality issue?
False conclusions because of incorrect or “dirty” data can inform poor business strategy and decision-making. False conclusions can lead to an embarrassing moment in a reporting meeting when you realize your data doesn’t stand up to scrutiny. Before you get there, it is important to create a culture of quality data in your organization. To do this, you should document the tools you might use to create this culture and what data quality means to you.
Components of quality data
Determining the quality of data requires an examination of its characteristics, then weighing those characteristics according to what is most important to your organization and the application(s) for which they will be used.
5 characteristics of quality data
- Validity. The degree to which your data conforms to defined business rules or constraints.
- Accuracy. Ensure your data is close to the true values.
- Completeness. The degree to which all required data is known.
- Consistency. Ensure your data is consistent within the same dataset and/or across multiple data sets.
- Uniformity. The degree to which the data is specified using the same unit of measure.
Advantages and benefits of data cleaning
Having clean data will ultimately increase overall productivity and allow for the highest quality information in your decision-making. Benefits include:
- Removal of errors when multiple sources of data are at play.
- Fewer errors make for happier clients and less-frustrated employees.
- Ability to map the different functions and what your data is intended to do.
- Monitoring errors and better reporting to see where errors are coming from, making it easier to fix incorrect or corrupt data for future applications.
- Using tools for data cleaning will make for more efficient business practices and quicker decision-making.
Data cleaning tools and software for efficiency

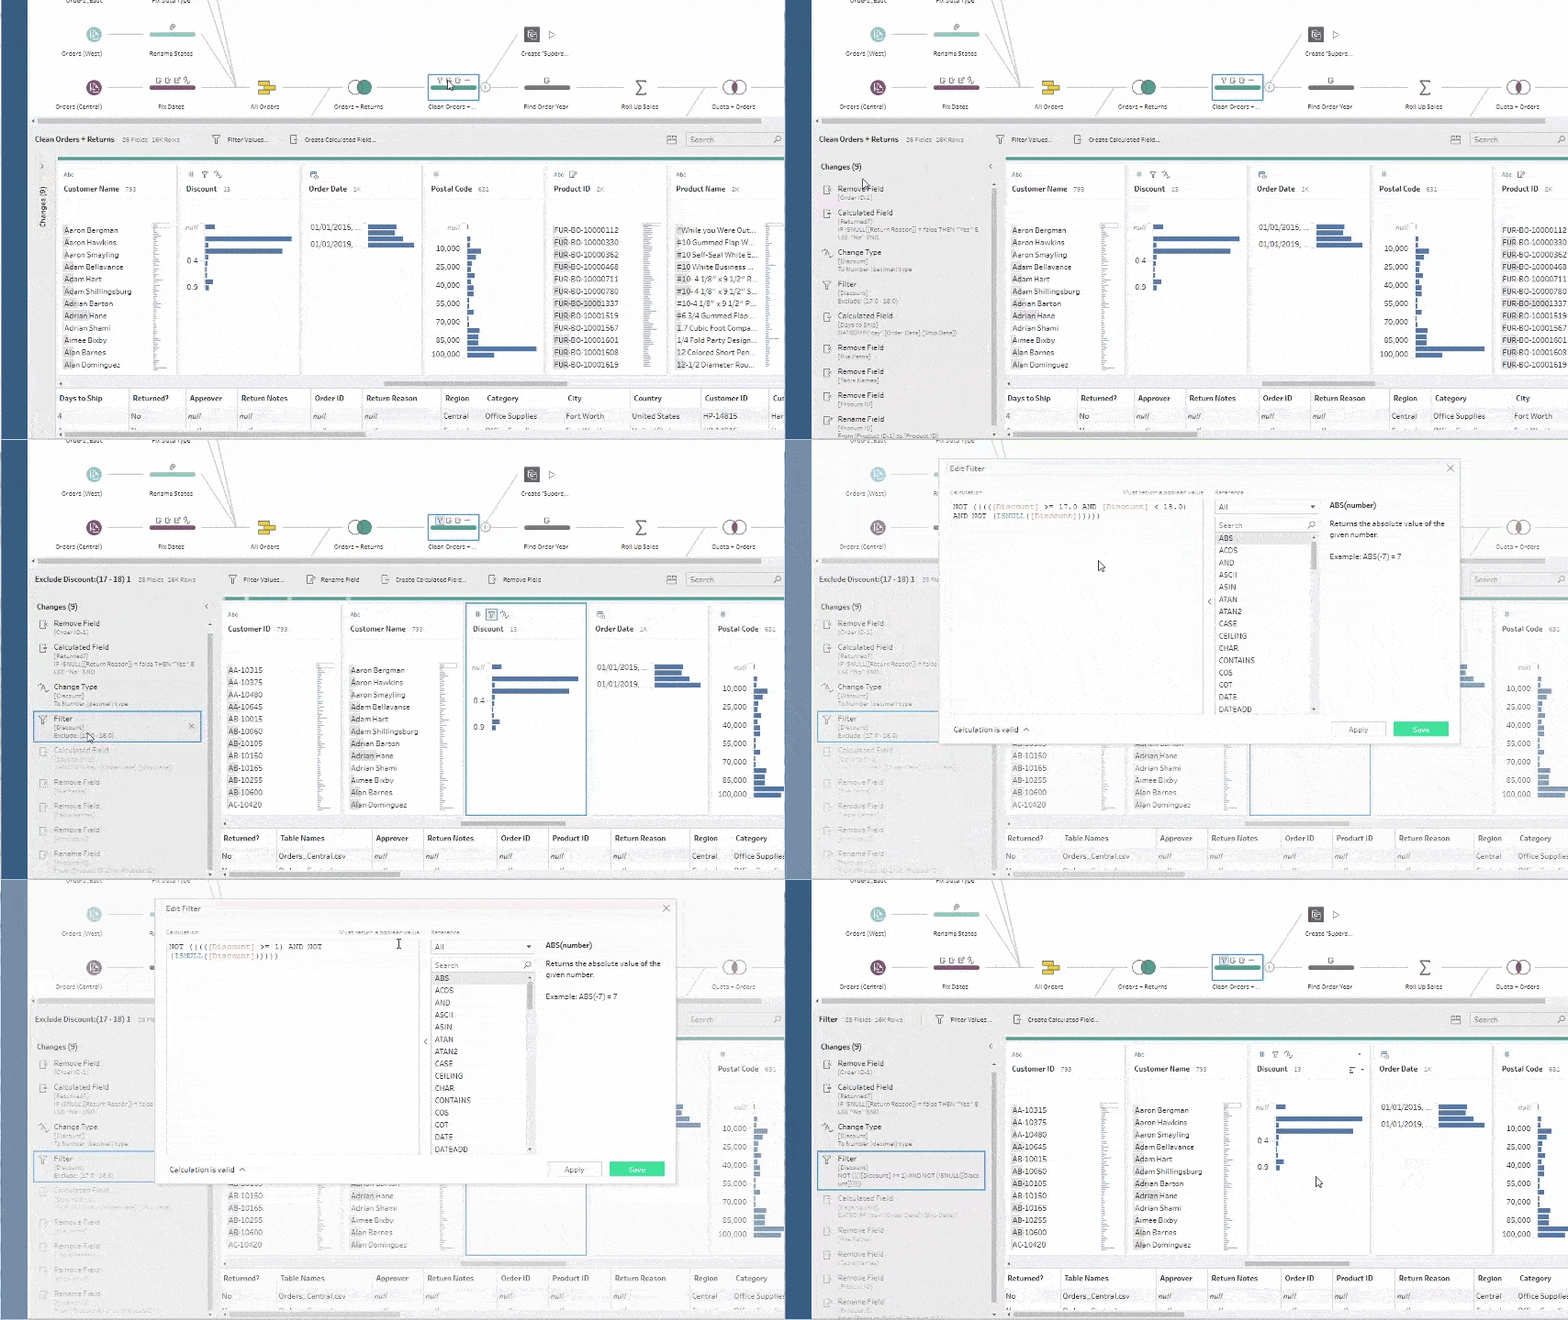
Software like Tableau Prep can help you drive a quality data culture by providing visual and direct ways to combine and clean your data. Tableau Prep has two products: Tableau Prep Builder for building your data flows and Tableau Prep Conductor for scheduling, monitoring, and managing flows across your organization. Using a data scrubbing tool can save a database administrator a significant amount of time by helping analysts or administrators start their analyses faster and have more confidence in the data. Understanding data quality and the tools you need to create, manage, and transform data is an important step toward making efficient and effective business decisions. This crucial process will further develop a data culture in your organization. To see how Tableau Prep can impact your organization, read about how marketing agency Tinuiti centralized 100-plus data sources in Tableau Prep and scaled their marketing analytics for 500 clients.
