SPORTS + DATA

Explore the data that powers your favorite sport

Data impacts everything—and athletics are no exception. When the power of visual analytics meets the sports data revolution, you see and understand what’s really going on in the games you love. Feed your fandom with Tableau, the most powerful and flexible analytics platform for your data.

Reflecting on the World Cup with data

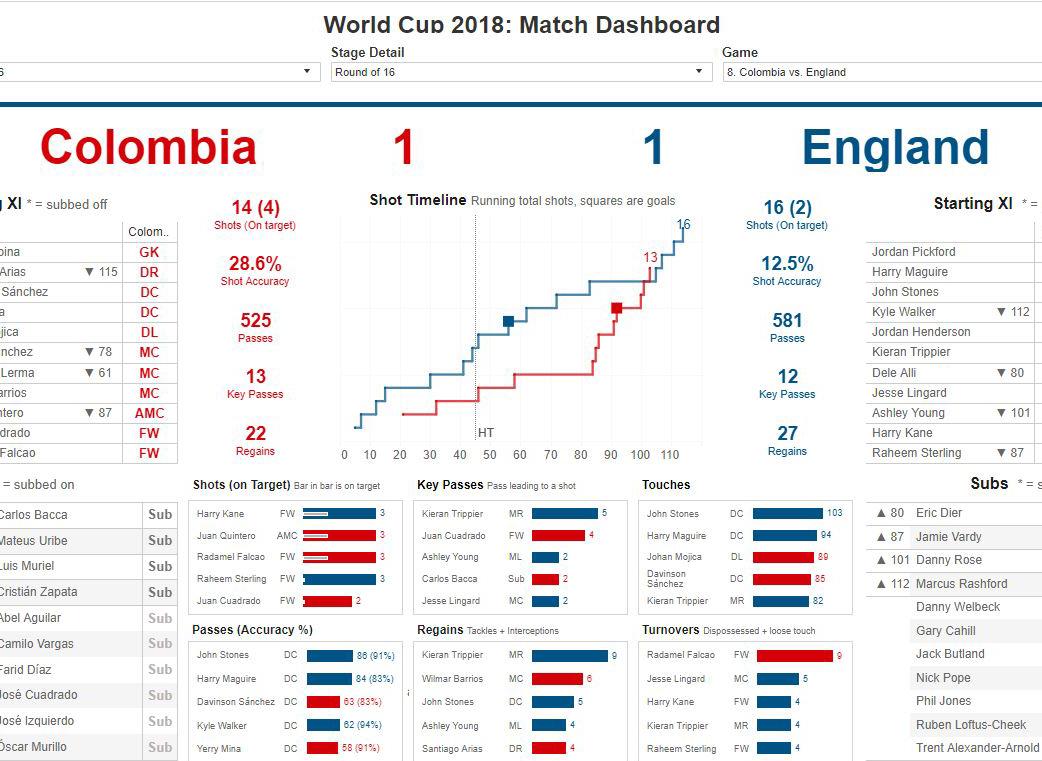
With the 2018 World Cup coming to a close, two sports enthusiasts reflect on all of the thrilling moments from the tournament. What better way to do that than with data?

Join us as we relive the action of the World Cup.

Register now

Kick it off with your favorite sport

Visualization

FIFA World Cup Player Ratings

Tableau can help you gain insight into your favorite teams and players in the 2018 FIFA World Cup. This data visualization is a combination of teams and players in the tournament, combined with player ratings from FIFA 18. Find out how players at each position stack up to the competition.

Visualization

World No. 1's at Wimbledon

Wimbledon is the oldest, and one of the most prestigious tennis tournaments in the world. Tableau can help you visualize all of that history to tell a story and uncover insights. See how the world's best tennis players fare at Wimbledon.

See how Tableau is your ultimate teammate in our Summer of Sports webinar series.