
Insights on sight
People comprehend data better through pictures than by reading numbers in rows and columns. By visualizing data, you are able to more effectively ask and answer important questions such as “Where are sales growing,” “What is driving growth” and “What are the characteristics of my customers using different services?” Combine visual analysis with the power of data science, and transform your data from an underutilized asset to a competitive advantage.
Data visualization in practice

Why visualization?
Data visualization tools allow anyone to organize and present information intuitively.
Watch this video to find out how Tableau users are finding their data science processes simplified, enlivened, and energized.
Watch NowVisualize company growth
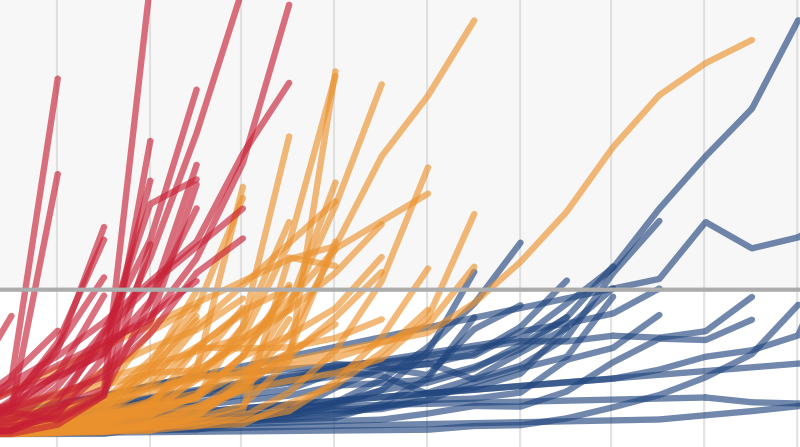
Tale of 100 Entrepreneurs
This analysis shows the revenue of the top 100 publicly-traded technology companies from the common baseline of their first year of operations. Despite popular opinion, not all tech companies are rocket ships.
See how visual elements like color, shape and position enliven the story your data tells.
View the VizData science whitepaper

Make Everyone in Your Organization A Data Scientist
Data visualization tools put incredible data analysis capabilities into the hands of people throughout an organization, no matter the amount of data stored.
Learn how to make everyone in your organization a data scientist, with little to no training—just the tools.
Read NowVisualize nature
Track natural storms by power and path
With the climate change and increasingly-destructive storms, insurers, policymakers, and citizens are looking for more storm-related insights. This dashboard provides a quick view of several key metrics associated with storm tracking. Storms during the year of Hurricane Katrina were powerful and had long-ranging travel paths. Katrina itself was not the most powerful storm, but it did follow a path that gave it huge opportunity to cause its significant damage.
View the VizA well-crafted, thoughtful visualization makes the light bulb go off. You just don't get that with a spreadsheet.
Learn more about data visualization with Tableau

Enhance Your Analysis
Data visualization is prompting a cultural shift toward more analytical, data-driven organizations by empowering users to explore their data.
Watch this video to see how easy it is to drag and drop your data into beautiful visualizations with Tableau.
Watch Now