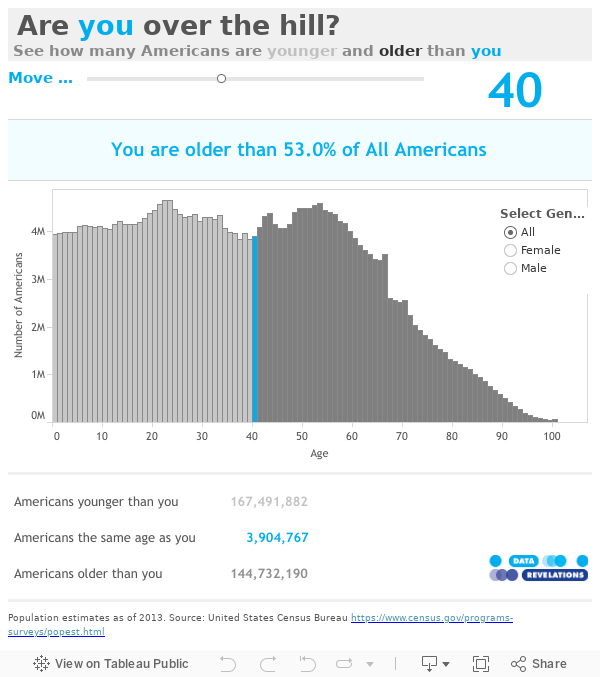
Are you over the hill?
This viz by Steve Wexler is the perfect example of making analytics simple, but not simplistic. Explore to see how your demographics compare with American ages and genders.
Create and share on Tableau Public
Join the newsletter and find daily inspiration with the Viz of the Day. Yours could be featured next!

Season Recap #SportsVizSunday
A viz puck-et! Explore this #VizOfTheDay by Jules Claeys to see how an ice hockey team has progressed compared to last season. This #SportsVizSunday viz showcases detailed team-level and individual players stats.
Interact with the viz