
Welcome to Tableau Cloud
You'll find all the resources you need to get started as an administrator
Join a live 1-hour session for new Tableau Cloud admins
Learn the ins and outs of being a Tableau Cloud admin with our Success Connector sessions
What's Tableau Cloud?
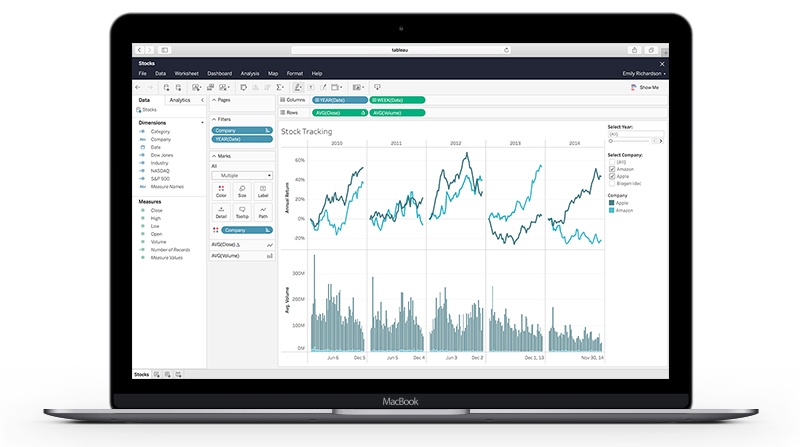
Tableau Cloud is a powerful way for your organisation to build, share and collaborate around data analysis. Members of your Tableau Cloud site will be able to ask and answer everything from the simplest to the most complex questions of their data more intuitively than ever before.
As an administrator of your Tableau Cloud site, you’ll be able to add users, create an organisational structure and establish permissions across the site, as well as many other important duties. Let’s begin!
See Tableau Cloud in actionStep 1: Plan your site
Data is the lifeblood of your business and your Tableau Cloud site. Before you start adding data to Tableau, it’s useful to understand what kinds of data you’d like to connect and where it lives.

Talk data to me
When starting this analysis, it’s best to think about where your data lives (in the cloud, on-premises, etc.) and who will use it (sales, finance, HR) and why. When you or other Tableau Creators want to share data connections you’ve defined, you can publish data sources directly to Tableau Cloud. When you publish a data source to your site, other users can connect to it and build new workbooks to answer their own questions. When the data in the Tableau data source updates, all workbooks that connect to it pick up the changes.
Share that data: Published data sources are particularly important to Explorers, who will rely on published data sources to build new workbooks in Tableau Cloud. Make sure they have lots of data to explore!
To extract or not to extract
Extract is a word you’re going to see a lot in Tableau. Extracts are one of the most powerful tools in Tableau’s arsenal. Extracts are snapshots of your data optimised for aggregation and loaded into system memory to quickly recall for visualisation. Extracts tend to be faster than live connections, especially in more complex visualisations with large data sets, filters, calculations, etc. Our Hyper data engine powers your Tableau extracts, making them extra fast. However, because an extract is a snapshot of the data, you will need to refresh the extract in order to receive updates from the original data source. Live connections, on the other hand, offer the convenience of rapid updates, with any changes in the data source reflected in your Tableau Cloud views. But live connections also rely on the database for all queries. And unlike extracts, databases aren’t always optimised for fast performance. With live connections, your data queries are only as fast as the database itself. Your Tableau Cloud site can use both live and extracted data. Both have their place in most sites. Learn more about supported live data connections, data extracts and how to keep your data fresh.
Step 2: Plug in your data
It’s time to pull data into your site. Data to a Tableau site is like fuel to a car. It makes it go – it makes it run. Without data, your site won’t be able to take your business to the next level. Before your team can create new workbooks and build additional views on the web, you need to connect to your data. Tableau supports connecting to data sources published through Tableau Desktop or connecting to data directly through Tableau Cloud.
Add new workbooks to your Tableau site
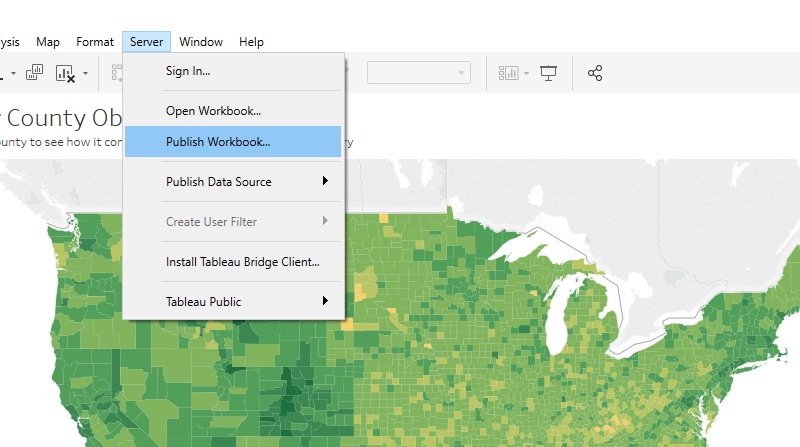
One of the fastest ways to get data into your Tableau Cloud site is to have Creators on your team publish workbooks through Tableau Desktop. Once a workbook has been created in Tableau Desktop, select Server in the top nav. Choose Publish workbook from the drop-down menu. Select which project you’d like to publish your workbook to and your team will be off and running.
Cloud data connections
If you maintain SQL-based data in the cloud, you can use live connections to that data. When you use a live connection, you can require users to provide credentials for accessing the data when they open views that connect to it.
Tableau Accelerators
Tableau accelerators are designed to help you hit the ground running with actionable data in minutes. In just a few clicks, you’ll be able to connect to common enterprise applications like Salesforce and ServiceNow and create beautiful, data-rich dashboards seamlessly.
Tableau Bridge
Tableau Bridge gives you the flexibility to make use of all your published data sources behind your firewall and keep them fresh.
Publishing data sources
You can publish data sources and workbooks to widen the audience for your data analysis within your organisation. By publishing, you can allow people in your organisation (even those who don't use Tableau Desktop) to view, interact with, download, subscribe to, share, edit and save published views. You can also incorporate views into blog posts or websites.
learn how to publish a data source
Keeping your data fresh
You’ve published your data connection to Tableau Cloud but it’s important to keep that data fresh and up to date. If you've established a live connection to a cloud-based data source, this data will be updated automatically. But for other scenarios, however, you'll need to define a refresh schedule. It’s easy to set refresh schedules, manage refresh tasks and ensure that your team are always seeing the most up-to-date data in Tableau Cloud. Sometimes you don’t want to have a live connection to your data. You might choose to take an extract of your database, rather than connect live, for performance reasons. Or you might be using data from a web application like Google Analytics or Salesforce that does not allow for live connections. In these cases, you can set full or incremental extracts to refresh on a regular, predictable schedule. You can define how often these occur.
ask data
Empower your team to ask questions with natural language
With Ask Data, your team gets an entirely new way to interact with data. Creators and Explorers can ask questions directly from published data sources and answers come in the form of automatic data visualisations.
Enable Ask Data
Ask Data saves your users time and makes it easier for them to do ad-hoc analysis. Follow the simple steps below to set up Ask Data on specific data sources.
- At the top of the data source page, click the Details icon for your data source.
- In the Ask Data section, click Edit.
- Tick the Enable for this data source box.
- If you're enabling Ask Data, choose a data source analysis option:
- Automatic checks for changes every 24 hours and analyses the data source if it is live, has had an extract refreshed or has been republished.
- Manual request analyses the data source only when a user clicks Reindex data source.
- Disabled analyses only field names, not values.
- Click Save and you're done.
Schedule your data*
Schedule your flows to run when you want them to – day or night. Automate your data prep processes with Tableau Prep Conductor so there’s always fresh data that’s prepped and ready for analysis.
Data confidence*
Ensure your organisation is using the right, up-to-date data. Through certifications, data quality warnings, and metadata in more places, everyone can trust and feel confident in the data decisions they’re making.
Learn more about Tableau Catalog
*Included as part of the Data Management Add-on
Step 3: Building out your site
When your site is brand new, everything is easy to find and quick to sift through. The reason being that you likely don’t have a lot of content on your site – yet.
However, as more and more team members begin sharing all the amazing data insights they’re discovering, your site can go from uncluttered tranquillity to a disorganised mess. But have no fear, there are some simple steps you can take to keep order.
Access Desktop using login-based licence management
Login-based licence management (LBLM) provides a number of benefits. This feature allows Creators to activate Tableau Desktop or Tableau Prep by simply logging in to these products with their Tableau Server or Tableau Cloud credentials. Admins can assign, monitor and reclaim Tableau Desktop or Tableau Prep access directly from Tableau Server without needing to distribute individual licence keys to end users. Starting with Tableau 2020.1, Tableau Desktop and Tableau Prep will have a new product activation experience. You can activate the product by signing into your Tableau Cloud site today.
Create projects
Projects help you hold and organise related resources. They can make it easier for people to find and use the information they need. Often, site admins create high-level projects tied to your company’s organisational structure (i.e. projects for each department). Teams in each department can then create sub-projects with designated project leaders. These leaders can take charge of further organising their areas.
Groups users together
Often, similarly situated people in your organisation will need access to the same kinds of content. For example, the Finance team usually need to access the same data sources and workbooks. Arrange users into groups according to what they’ll need to do.
User roles
Ask yourself, what capabilities do your people need to be successful? Tailor each user’s role based on how they will interact with your site.
Step 4: Share your site

Invite new users
You’ve created an organised site where members of your organization will want to go to view and share analytics. Don’t keep it all to yourself. Get the (data-driven) conversations started. It’s time to begin adding users to Tableau Cloud. Empower your team to browse, publish, edit content and collaborate around trusted data.
Tableau isn’t just about amazing technology, beautiful visualisations, and data in all shapes and sizes. It’s really about people: your people, your team, your organisation. With every person you invite onto your site, you’re empowering them to see and understand the information they care about. You’re helping them discover insights that would previously have been hidden.
Keys to the kingdom: site authentication
How do you want your users to sign into your Tableau Cloud site? Find the way that best fits your organisation.
There are multiple ways for users to log into Tableau Cloud after signing in the first time. Your authentication method will validate the user’s identity before allowing access to your site.
Tableau ID
This method is the default authentication type, available on all sites, requiring no additional configuration steps before you add users. Tableau credentials are made up of a username and password. Users enter their credentials directly on the Tableau Cloud sign-in page.
If your organisation uses Google applications, you can enable Tableau Cloud to use Google accounts for single sign-on (SSO) via OpenID Connect. When you enable Google authentication, it directs users to the Google sign-in page to enter their Google credentials.
SAML
Another way to use SSO is through SAML. To do this, you use a third-party identity provider (IdP) and configure the site to establish a trust relationship with the IdP. When you enable SAML, it directs users to the IdP’s sign-in page to enter their SSO credentials, which are already stored with the IdP.
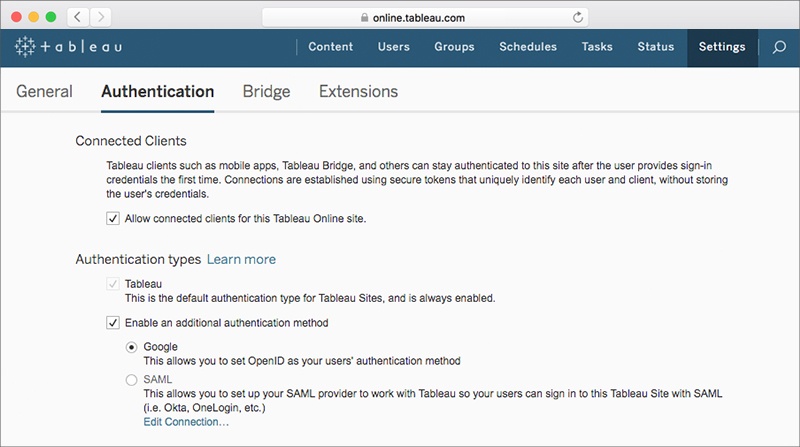
Choose your authentication
To choose your method of authentication, select Settings in the side navigation and then Authentication from the sub-menu. Enable the authentication method that best fits your organisation.
Step 5: Creating the rules of your site
Building rules for your Tableau Cloud site allows everyone to find the data they need to do their jobs, without the distraction of unwanted information. Start by creating groups for easy allocation of grouped permissions. With groups in place, you’ll be able to assign content access to team members in bulk.
User roles
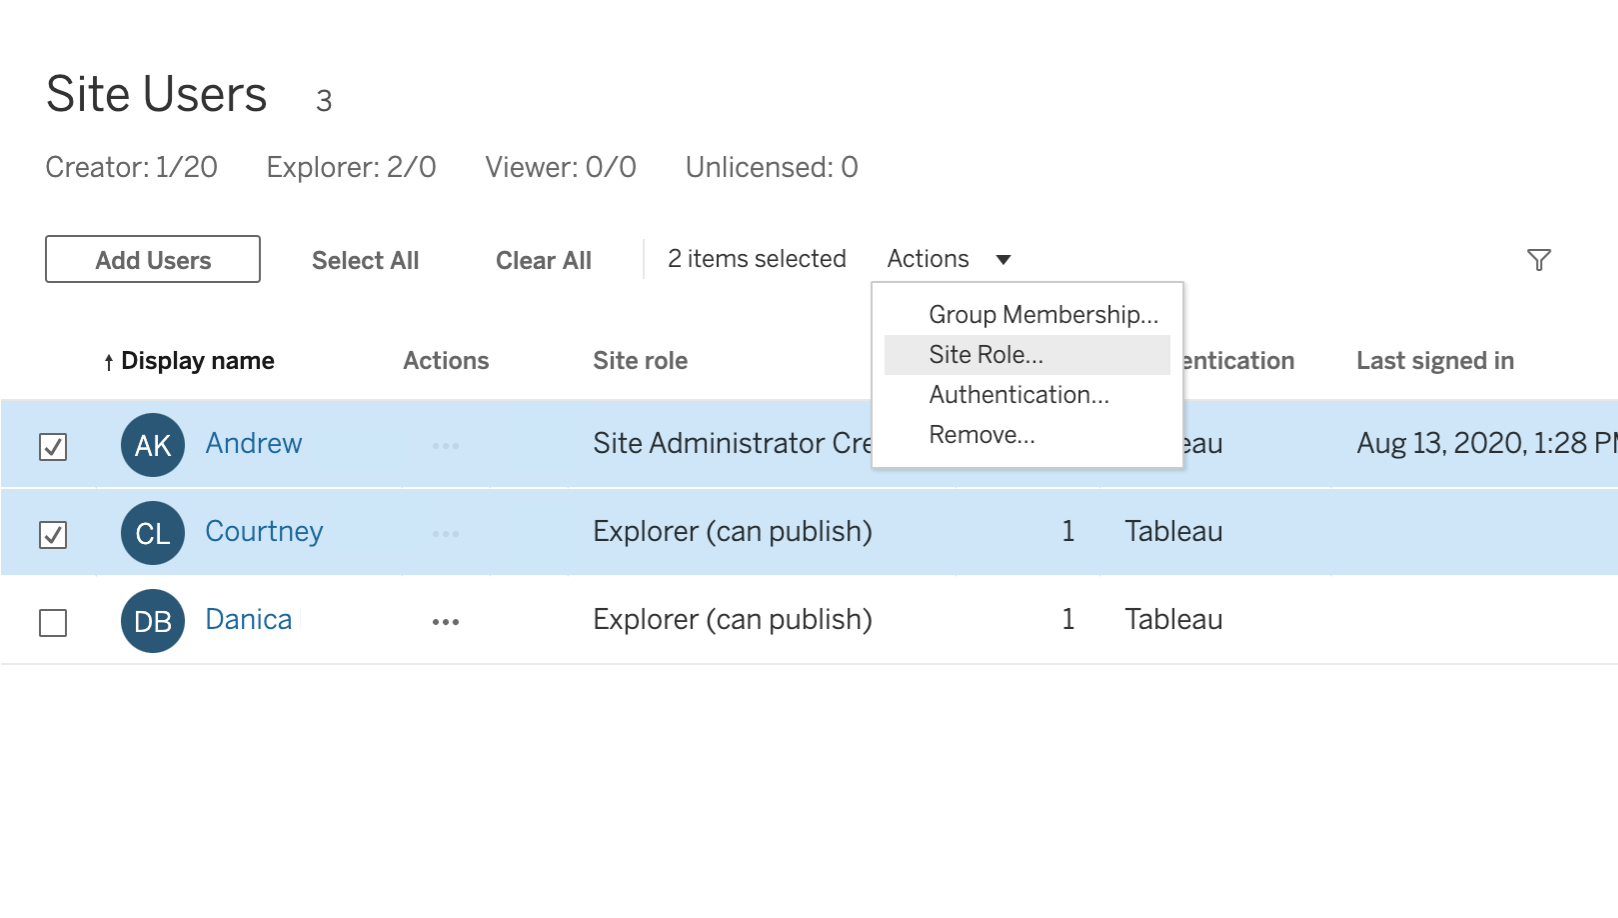
User roles signify the maximum level of access a person can have on your site. Used in conjunction with content permissions, you will able to determine who can publish, interact with, view and access data on your site.
In the side navigation, select Users and one or several users from the list. Then choose Actions and click Site role in the drop-down.
Choose from the list of site user roles in the drop-down menu.
Groups
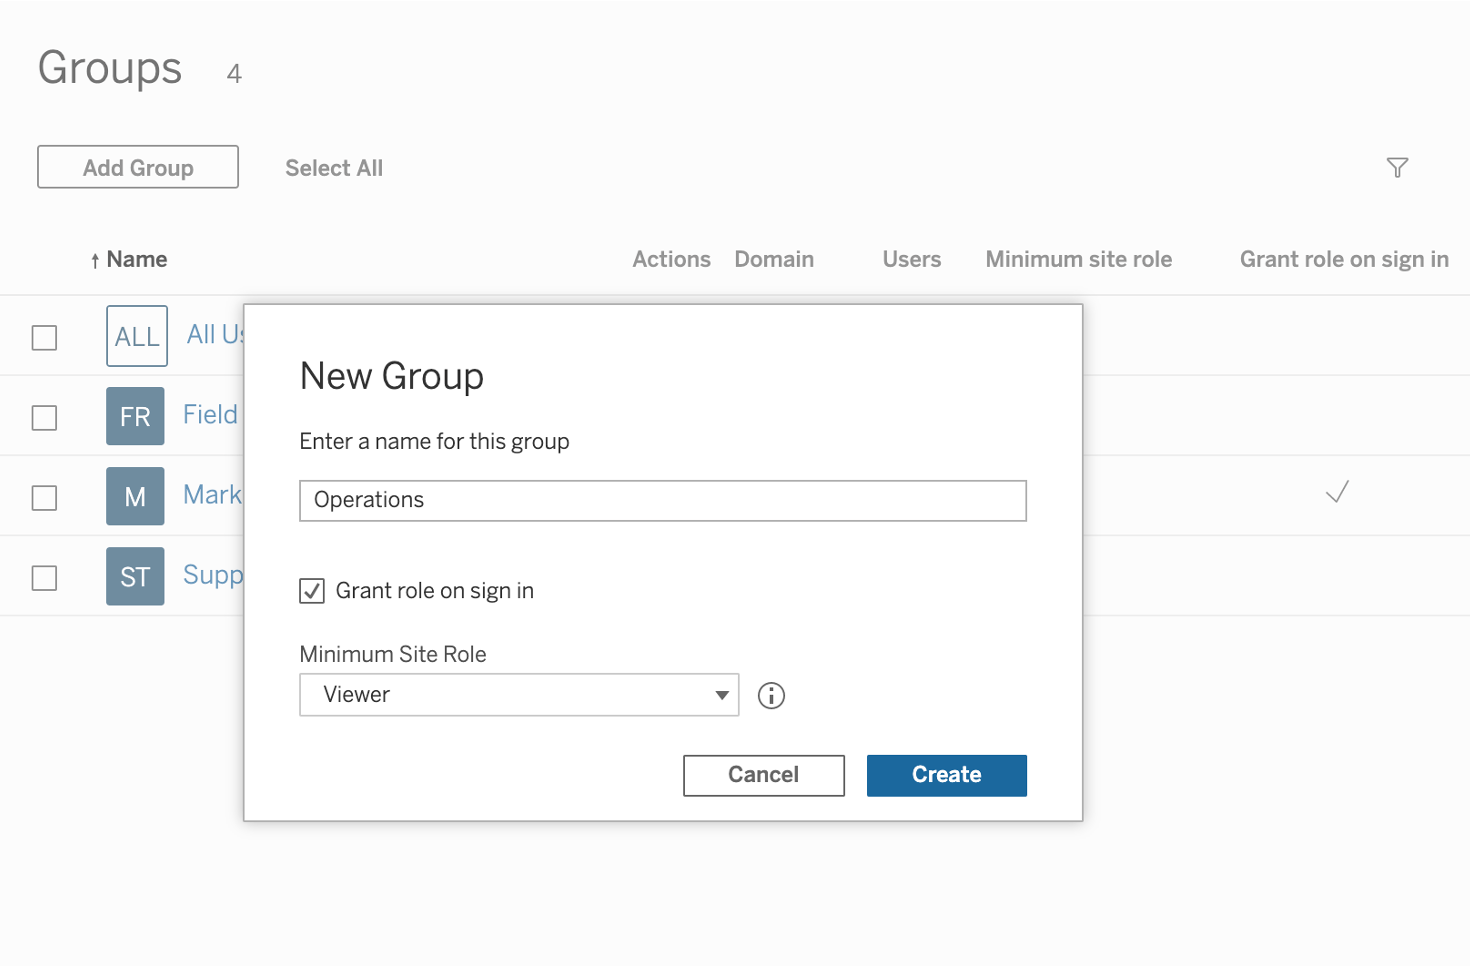
In your site, click Groups from the side navigation, then click New group. Name your new group and click Create.
Select the group you just created from the side navigation and click Add users to begin populating your new group. If you haven’t created any new users yet on your site, learn how to invite users.
To streamline licence provisioning, learn about using Grant licence on sign-in to automatically grant a licence to users the first time they log in to Tableau.
Permissions
Permissions are rules assigned to projects, groups, workbooks and data sources. Use them to specify who can work with what content.
To modify the permission levels for an entire group, navigate to the Group page and create a new set of permissions for a specific group. Click Add a user or group rule, select Group, then find and select the group.
At this point, you can select a permission role template to apply an initial set of capabilities for the group. Click a capability to set it to Allowed or Denied, or leave it Unspecified. Click Save.
On the Content page for your site, select Projects, workbooks, views or Data sources to display all items of that content type. Select the tick box for the item you’re modifying, select Actions and choose Permissions.
Step 6: Monitor your site
As a site administrator, you’ll have a view of how your team is interacting with your Tableau site. Seeing how your team are working on the site will help you help your team get the most value out of your site. Learn how to use admin views and admin insights
Explore usage with Admin Insights
Dig deeper into individual actions
Content: hot or not?
Check the pulse of your data
Monitor flows across your site*
See all your data*
*Included as part of the Data Management Add-on
Step 7: Keep yourself in the know
One of the best parts of Tableau Cloud is that Tableau handles all the upgrades and maintains the data centre infrastructure for you. But it’s important to keep up to date on what’s happening in Tableau Cloud through a few easy methods.
Trust site
Tableau Trust site
What to expect from upgrades
Tableau Cloud upgrade page
Community
Tableau Cloud community page
Product guides
Tableau Cloud help guide
Step 8: Do more with your site
Congratulations! You’ve come a long way from when your site was just a baby. Now look at it. It’s full of beautiful data and excited people discovering insights they never would have before. But now you’re ready for more.
Maximise site performance
There are lots of different strategies and tactics you can employ to improve the speed of your site. When we talk about performance, we mean the speed at which you can work in Tableau. That might mean speed of data analysis, for example, if you are working on a large corporate database that takes forever when you access it remotely. Or it might mean simply the speed of loading views or dashboards. Making performance improvements can mean making trade-offs between the most current data and speed or increasing performance by including a subset of data instead of the entire data set. The bigger and more complicated the data, the longer it can take to interpret and render. However, you can employ strategies to accelerate the process. Building efficient, well-tuned workbooks will keep your site users in the flow of analysis.

Visual best practices
Discover ways to improve your visualisations to increase understanding about your data and enable faster, more meaningful answers. The most important step you can take to make a great visualisation is to know what you’re trying to say. It is vital that your visualisation has a purpose and that you are selective about what you include in your visualisation to fulfil that purpose.
Know your audience
When you’re building a visualisation, it’s important to understand what questions your audience already has. What answers do you find for them? What other questions does it inspire? What conversations will result? Your viewers should take something away from the time they spend with your visualisation.
Choose the right chart for your data
Understanding what you’re trying to convey in your visualisation is a critical first step. Knowing which visualisation can best convey that purpose is equally important. Whether you’re trying to see trends over time, or comparing and ranking a group of items by a set of criteria, the chart type you choose will help your audience better comprehend the information in your visualisation.
Emphasise the most important data
Many chart types let you put multiple measurements and dimensions in one view. In scatter plots, for example, you can put measurements on the X or Y axis, as well as on the marks for colour, size or shape. A rule of thumb is to put the most important data on the X or Y axis and less important data on colour, size or shape.
Orient your views for legibility
Sometimes a simple change in how your labels are oriented can greatly increase how quickly viewers understand what’s being conveyed. If you find yourself with a view that has long labels that only fit vertically, try rotating the view. You can quickly swap the fields on the Rows and Columns shelves to achieve this change.
Need more licences? You can add more licences to your Tableau deployment directly through the Customer Portal, Tableau Cloud or Webstore.
Step 9: Join the community
The Tableau community is like no other in the industry. Thousands upon thousands of passionate data people are already passionate members. Encourage your team to learn, share and explore all it has to offer.
Get answers
Find support for your Tableau journey, in person or online. Quick tips, in-depth expertise and everything in between: The Tableau community has it all.
Make connections
Meet like-minded people who love telling stories with data – on the forums, on Twitter or at a local Tableau user group meeting. Join the conversation: we promise you’ll be welcomed with open arms.
Shape the future
We can’t think of anyone better to help us build great products. Create and vote on product ideas to tell the Tableau development team what matters to you.
Get inspired
The Tableau community will unlock your curiosity and unleash your creativity. From amazing dashboard designs to Tableau Server tips and tricks, there are lots of ways to take your skills to the next level.
Tips to get users active
Here are tips to get more users engaged with content on your site:
- See which users have been invited but have yet to activate their licences. Learn how with Admin Insights.
- Subscribe users to content. Admins and Creators can subscribe other users to content. Users will get emails about the views on a daily or weekly basis, keeping data top-of-mind. Learn how to subscribe others to views.
- See who is most active and identify users that need help getting started. Discover who is and isn't active on your site by logging into your site. Click Users, then sort the list by last login date.
- Change default start page for users. As an admin, you can update what users will see when they log in to the site to more useful content. Learn how to update the start page.
- Use recommendations. Promote the Recommendations tab in the left-hand navigation bar as a way to find new content to browse. Learn how to use recommendations.
- Embed views in shared places. Embed interactive views into share work spaces like wikis, intranet portals or SharePoint so data can be consumed outside of the site. Learn how to embed a view.