Tableau Dashboard Showcase
Tableau empowers people to find insights in their data, create beautiful and intuitive dashboards, and share them with their organisations and broader community. These are some of our favourite Tableau data visualisations.
Featured visualisations


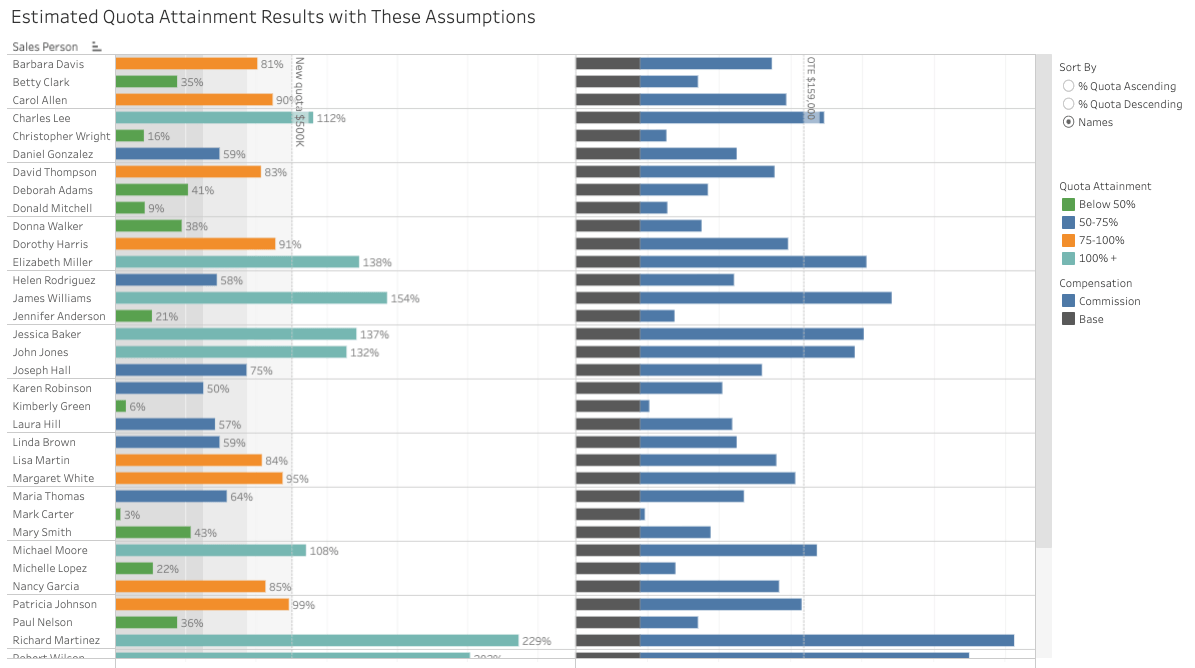
Tableau your mind. Daily.
Get the Viz of the Day delivered right to your inbox from Tableau Public, the world’s largest repository of data stories.
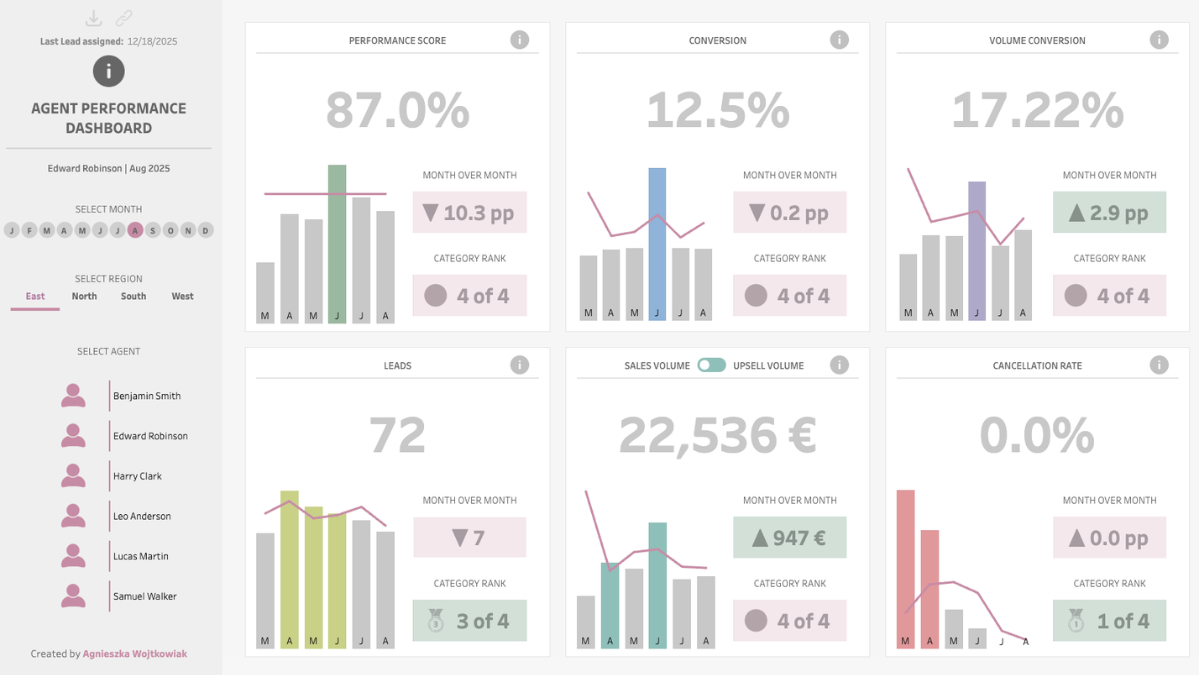
Sales Agent Performance
This #VizOfTheDay by Agnieszka Wojtkowiak delivers a sales agent performance summary through lead conversion rates, target tracking, and revenue benchmarks to help management evaluate team productivity and strengthen sales pipeline health. Inspired by Lisa Trescott. Explore the viz.
Interact with the vizIcon deep-statistics
Tableau community
Have a question about Tableau? Find advice from experts on everything. From using the product to industry solutions, we’ve got user groups and forum topics for you. Join today!
Icon deep-statistics
Learn Tableau your way
Whether you’re an experienced user or just building your data muscles, we can help you level up your Tableau game.
Try Tableau for free
When it comes to elevating people with the power of data, only Tableau combines a laser focus on how people see and understand data with the kind of robust, scalable platform you need to run even the world’s largest organisations.