Tableau Dashboard Showcase
Tableau empowers people to find insights in their data, create beautiful and intuitive dashboards, and share them with their organisations and broader community. These are some of our favourite Tableau data visualisations.
Featured visualisations


Tableau your mind. Daily.
Get the Viz of the Day delivered right to your inbox from Tableau Public, the world’s largest repository of data stories.
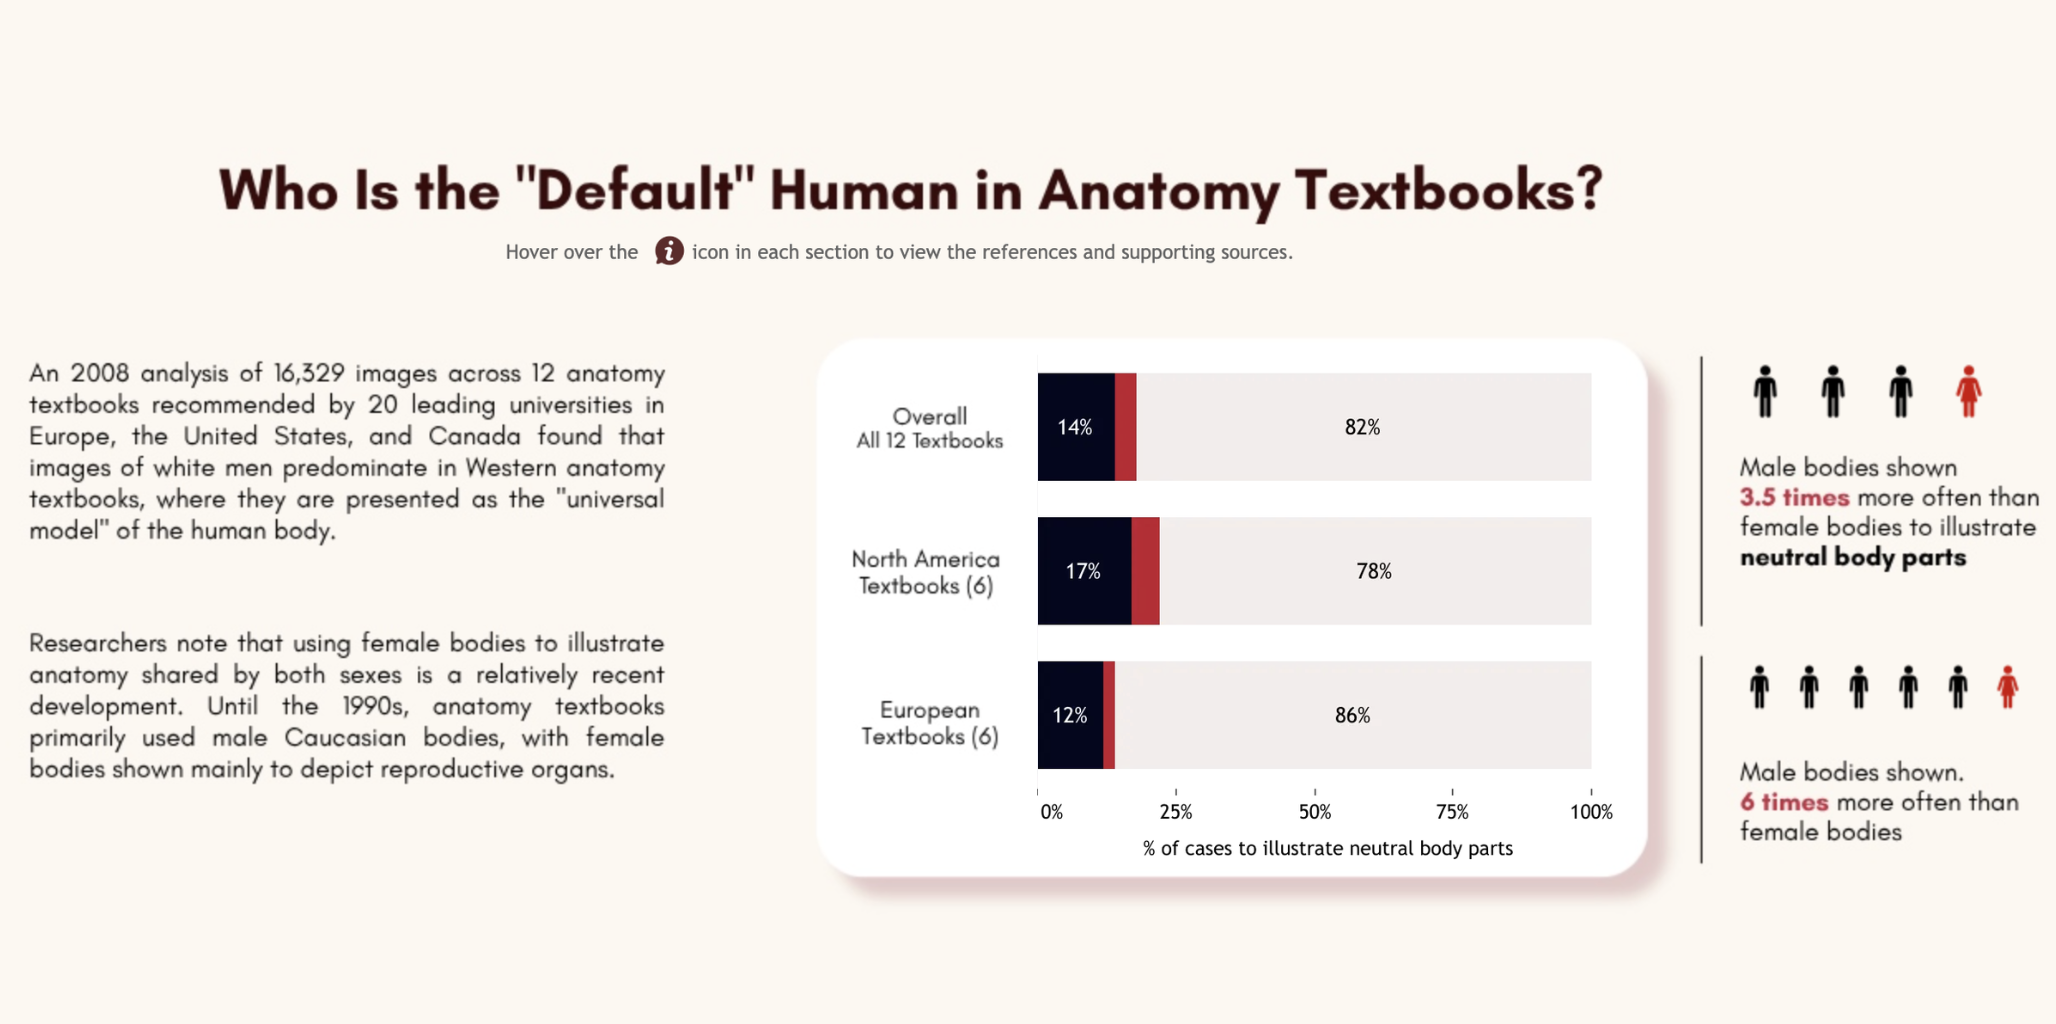
Why Medical Data Fails Women?
Today's #VizOfTheDay by Anindita Mitra highlights the historical and ongoing gender gap in medical research and clinical trials. The dashboard measures disparities across medical education and clinical trial representation to show how systemic data gaps negatively impact women's healthcare outcomes. Explore the viz.
Inspired by Heather Cox.
Icon deep-statistics
Tableau community
Have a question about Tableau? Find advice from experts on everything. From using the product to industry solutions, we’ve got user groups and forum topics for you. Join today!
Icon deep-statistics
Learn Tableau your way
Whether you’re an experienced user or just building your data muscles, we can help you level up your Tableau game.
Try Tableau for free
When it comes to elevating people with the power of data, only Tableau combines a laser focus on how people see and understand data with the kind of robust, scalable platform you need to run even the world’s largest organisations.