Interactive Fiscal Calendar
Shinichiro Murakami created a customisable fiscal year calendar in this viz, bringing interactivity into a typically static document. Parameters allow you to establish characteristics such as the first month of the fiscal year or first day of the week to suit your needs.
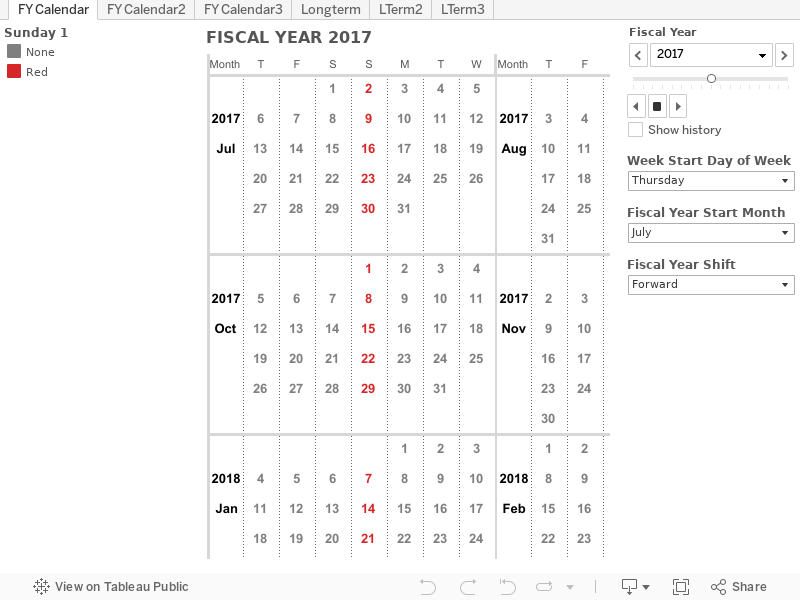
Tableau your mind. Daily.
Get the Viz of the Day delivered right to your inbox from Tableau Public, the world’s largest repository of data stories.

Why Medical Data Fails Women?
Today's #VizOfTheDay by Anindita Mitra highlights the historical and ongoing gender gap in medical research and clinical trials. The dashboard measures disparities across medical education and clinical trial representation to show how systemic data gaps negatively impact women's healthcare outcomes. Explore the viz.
Inspired by Heather Cox.