Telecommunications Analytics
This broadband network was analysed to evaluate future expansion sites and current performance. By clicking on a portion of the bar chart on the left, relevant site information is immediately displayed in the map and the detailed list below. Instead of creating hundreds of individual reports by site, the entire network can be evaluated in real time in one compact and powerful telecommunications analysis dashboard.
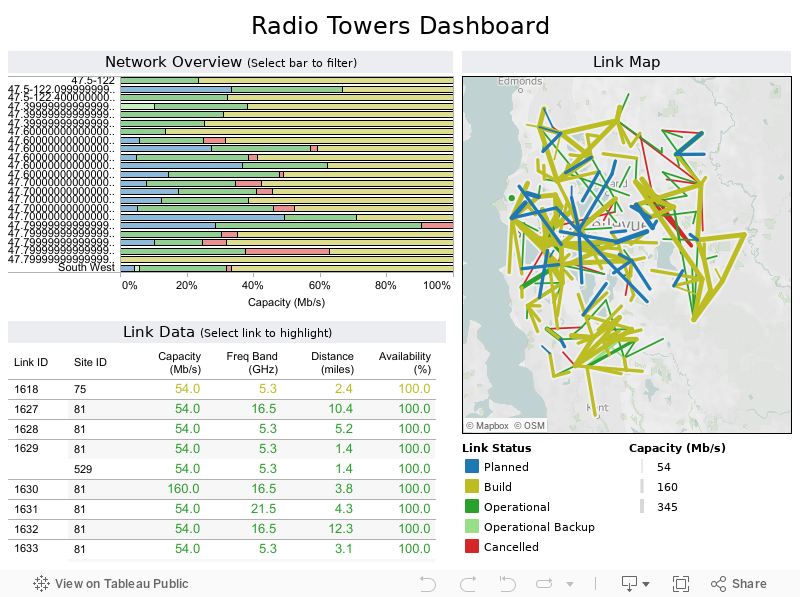
Tableau your mind. Daily.
Get the Viz of the Day delivered right to your inbox from Tableau Public, the world’s largest repository of data stories.
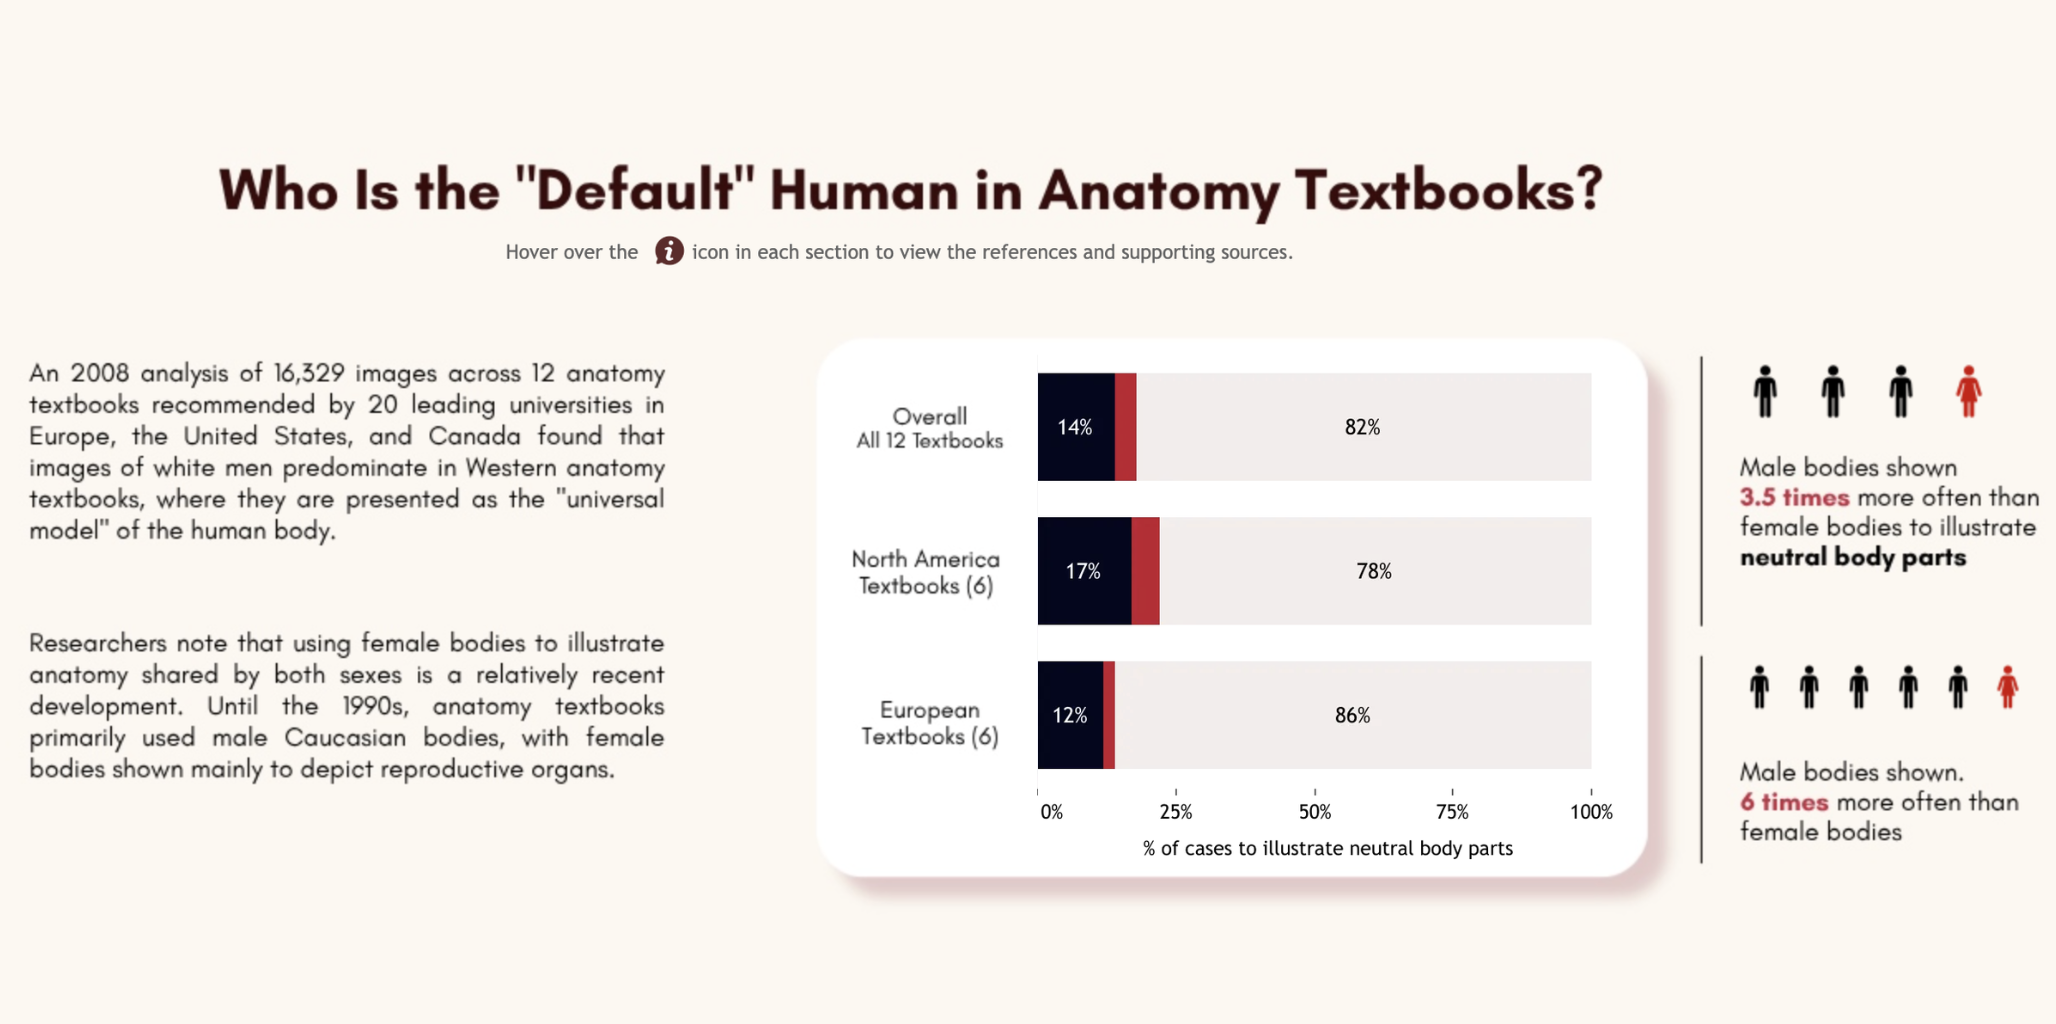
Why Medical Data Fails Women?
Today's #VizOfTheDay by Anindita Mitra highlights the historical and ongoing gender gap in medical research and clinical trials. The dashboard measures disparities across medical education and clinical trial representation to show how systemic data gaps negatively impact women's healthcare outcomes. Explore the viz.
Inspired by Heather Cox.