Super Sample Superstore
This corporate-style visualisation is a different take on the classic Tableau Superstore data set. Quickly spot increases or decreases in sales, profit ratio and shipping time, and switch to the Prescriptive tab to pinpoint the root cause. Created by Ryan Sleeper, this workbook aims to train users on design, data visualisation strategy and how to use Tableau to get the most out of any data set.
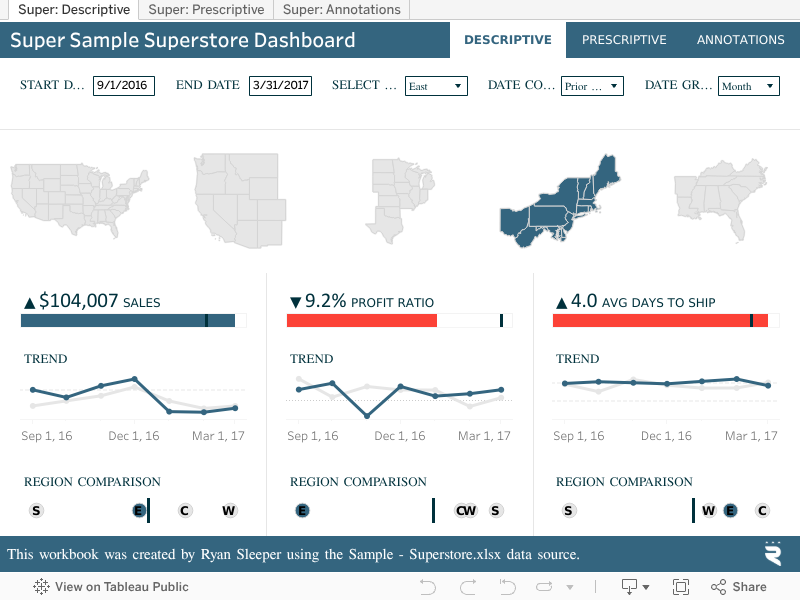
Tableau your mind. Daily.
Get the Viz of the Day delivered right to your inbox from Tableau Public, the world’s largest repository of data stories.
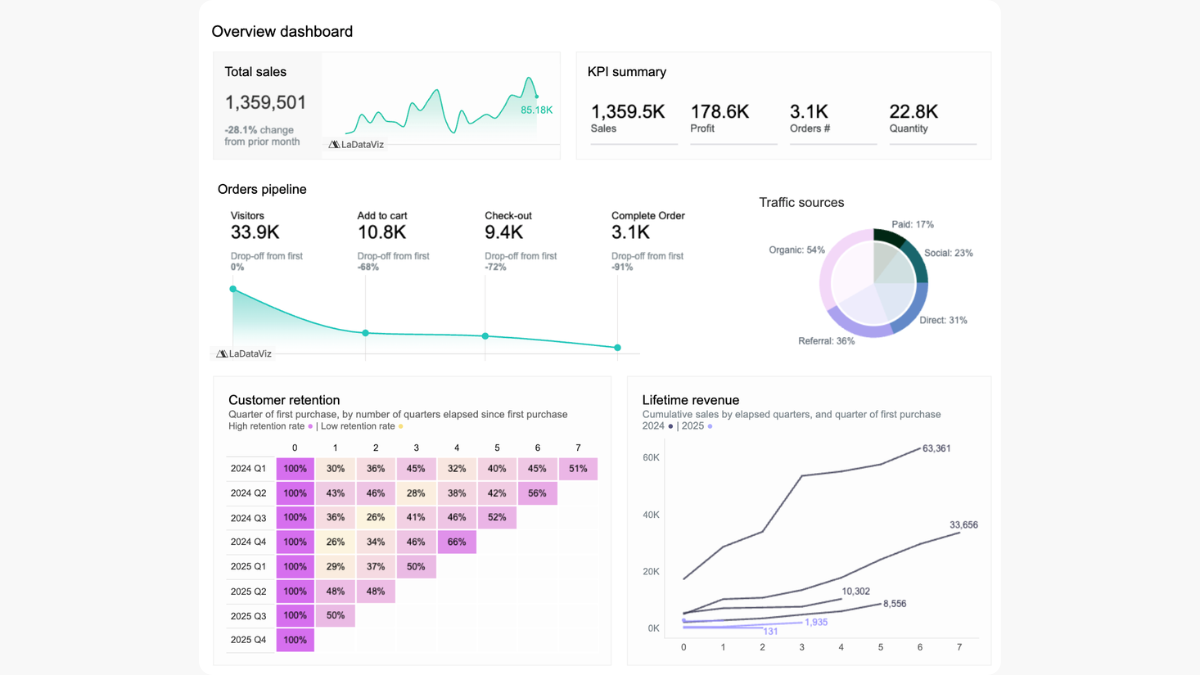
Overview Dashboard | Viz Extensions
Today's #VizOfTheDay by Ellen Blackburn showcases a business operations dashboard highlighting LaDataViz viz extensions. By tracking pipeline metrics and customer retention cohorts, it demonstrates how custom chart types elevate executive reporting. Explore the viz.
Interact with the viz