Tale of 100 Entrepreneurs
The visualisation is filled with investment stories and insights. For instance, most successful technology companies aren’t rocket ships. Only 28% of the nation’s most successful public software empires were rocket ships. (A rocket ship is defined as a company that reached $50 million in annual sales in 6 years or less.)
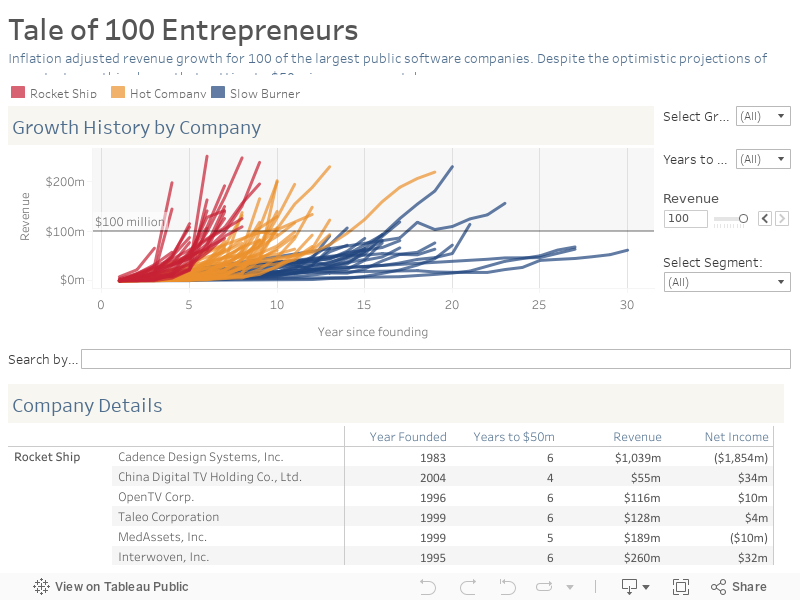
Tableau your mind. Daily.
Get the Viz of the Day delivered right to your inbox from Tableau Public, the world’s largest repository of data stories.
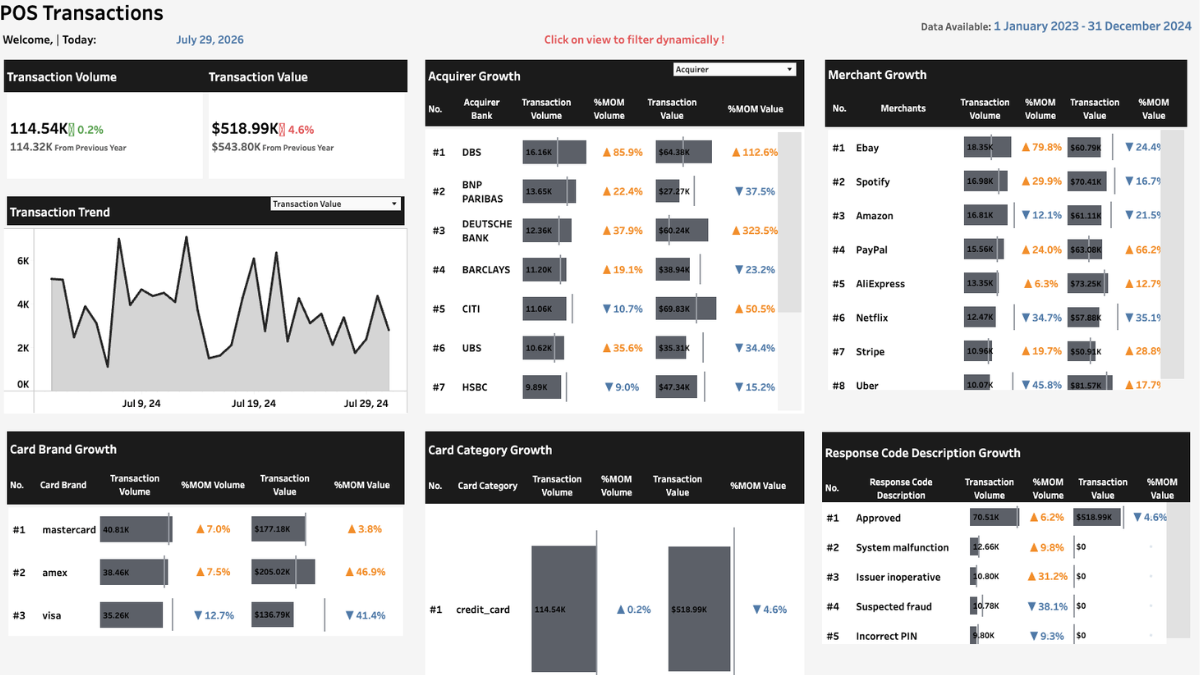
Transaction Insights Dashboard
This #VizOfTheDay by Anibaba Ayodeji delivers a point-of-sale transaction summary through volume distributions, peak hour timelines, and category insights to help finance teams evaluate terminal efficiency and monitor commercial revenue trends. Explore the viz.
Interact with the viz