请注意,这是非常现代的 BI 定义 - BI 曾经一度被用作流行语。传统商业智能最早出现于 20 世纪 60 年代,是一种在组织之间共享信息的系统。在 20 世纪 80 年代,人们开发出了用于制定决策以及将数据转化为见解的计算机模型,商业智能也得到了进一步的发展;再后来,商业智能发展成了 BI 团队提供的一项特定功能,其中包含依赖 IT 的服务解决方案。现代 BI 解决方案注重灵活的自助式分析、可信平台上的受管控数据、业务用户能力提升,以及快速获取见解。 本文将以管窥豹,对 BI 进行简单的介绍。其他资源:
- 关于从传统 BI 迁移到现代 BI 的 6 大迷思
- 本年度十大商业智能趋势
- 关于商业智能的书籍
- 商业智能的一系列实际应用示例
- 为什么需要 BI 平台以及如何进行选择
- 如何制定成功的商业智能战略
- BI 仪表板必备知识
商业智能示例
通过 Tableau 的“数据解释”功能,有助于针对数据中的异常值和趋势快速找出可能的原因。
它并不是一个具体的概念,而是一个总括性术语。为了优化绩效,需要从业务运营或活动中收集数据、加以存储并进行分析,这一过程所涉及到的各种流程和方法都在商业智能的涵盖范围内。在所有这些环节的协同作用下,人们得以全方位了解业务情况,从而做出更明智、可付诸实践的决策。 经过过去几年的发展,商业智能纳入了更多的流程和活动来提高绩效。这些流程包括:
- 数据挖掘:使用数据库、统计数据和机器学习来发现大型数据集中的趋势。
- 报告生成:与利益相关者共享数据分析,帮助他们得出结论和制定决策。
- 绩效指标和基准比较:将当前绩效数据与历史数据进行比较,确定绩效是否达到了目标;该流程通常会使用自定义仪表板。
- 描述性分析:使用初步数据分析来查明真实情况。
- 查询:提出具体的数据问题,让 BI 从数据集中提取出答案。
- 统计分析:通过描述性分析获取结果,并使用统计方法对数据做进一步探索(例如这种趋势的发生过程和原因)。
- 数据可视化:以可视化形式(例如图表、图形和直方图)呈现数据分析,让人们能够更加方便地使用数据。
- 可视化分析:以讲述可视化故事的方式来探索数据,实现见解的即时传达并保持分析的连贯性。
- 数据准备:对多个数据源进行汇编,确定维度和度量,为数据分析做好准备。
商业智能的重要性体现在哪里?
理想的 BI 能够帮助企业和组织根据自己的数据提出和回答各种问题。
商业智能可以在具体的业务上下文中展示当前和历史数据,从而帮助公司做出更好的决策。分析师可以利用 BI 来提供绩效和竞争对手基准,以使组织更加平稳、高效地运行。分析师还可以更轻松地发现市场趋势,从而增加销售额或收入。从合规到招聘,各项工作都会受益于相关数据的有效利用。 商业智能可以通过多种方式帮助公司制定更加明智的数据驱动型决策,以下是几个示例:
- 找出提高利润的方法
- 分析客户行为
- 与竞争对手进行数据比较
- 追踪绩效
- 优化运营
- 预测成功
- 发现市场趋势
- 发现问题
商业智能的工作原理
企业和组织都有各自的问题和目标。为了回答这些问题并根据这些目标跟踪业绩,企业和组织会收集所需的数据,加以分析,然后确定需要采取哪些行动才能实现自己的目标。

从技术方面来说,首先需要从企业的活动中收集到原始数据。经过处理后,将这些数据存储在数据仓库中。存储下来后,用户就可以访问这些数据,开始执行分析过程来解答业务问题。
BI、数据分析和商业分析如何协同工作
商业智能包括数据分析和商业分析,但二者仅仅作为整个流程的一部分进行使用。BI 帮助用户从数据分析中得出结论。数据科学家使用高级统计和预测分析来挖掘数据细节,以便发现模式并预测未来模式。数据分析会问“为什么会发生这件事,接下来会发生什么事?”商业智能会获取相应模型和算法,并将结果分解为具有实际指导意义的信息。 依据 Gartner 的 IT 词汇表,“商业分析包括数据挖掘、预测分析、应用分析和统计”。简言之,组织开展的商业分析就是其商业智能整体战略的一个环节。BI 旨在回答具体查询,并为决策或规划提供一目了然的分析。但是,公司可以使用分析流程来不断改进后续问题和迭代。 不能将商业分析视作一个线性的过程,因为解答一个问题很可能会引出后继问题,如此反复迭代。正确做法是将此过程视作一个由数据访问、发现、探索和信息共享环节构成的循环。这个循环有一个现代名词,叫做“分析循环”,它解释了企业如何运用分析来对不断变化的问题和期望作出反应。
传统 BI 与现代 BI 的差异
现代 BI 更加注重自助式分析和快速获取见解的能力。
过去,商业智能工具都是基于传统的商业智能模型。这是一种自上而下的方法:商业智能由 IT 部门推动,大多数甚至全部的分析问题均通过静态报告加以解答。这意味着,如果有人对自己收到的报告提出了后续问题,他们的请求会排到报告队列的最后,这时不得不重新开始整个过程。因此,报告周期十分漫长、令人沮丧,用户也无法利用最新的数据来作出决策。如今,人们仍然经常使用传统商业智能,来生成常规报告和回答静态查询。 而现代商业智能具有交互性,并且易于使用。尽管 IT 部门仍然在数据访问管理中发挥着重要作用,但多个层级的用户都可以在短时间内完成仪表板自定义和报告创建工作。有了合适的软件,用户就能够对数据进行可视化并回答自己的问题。
主流行业如何使用商业智能
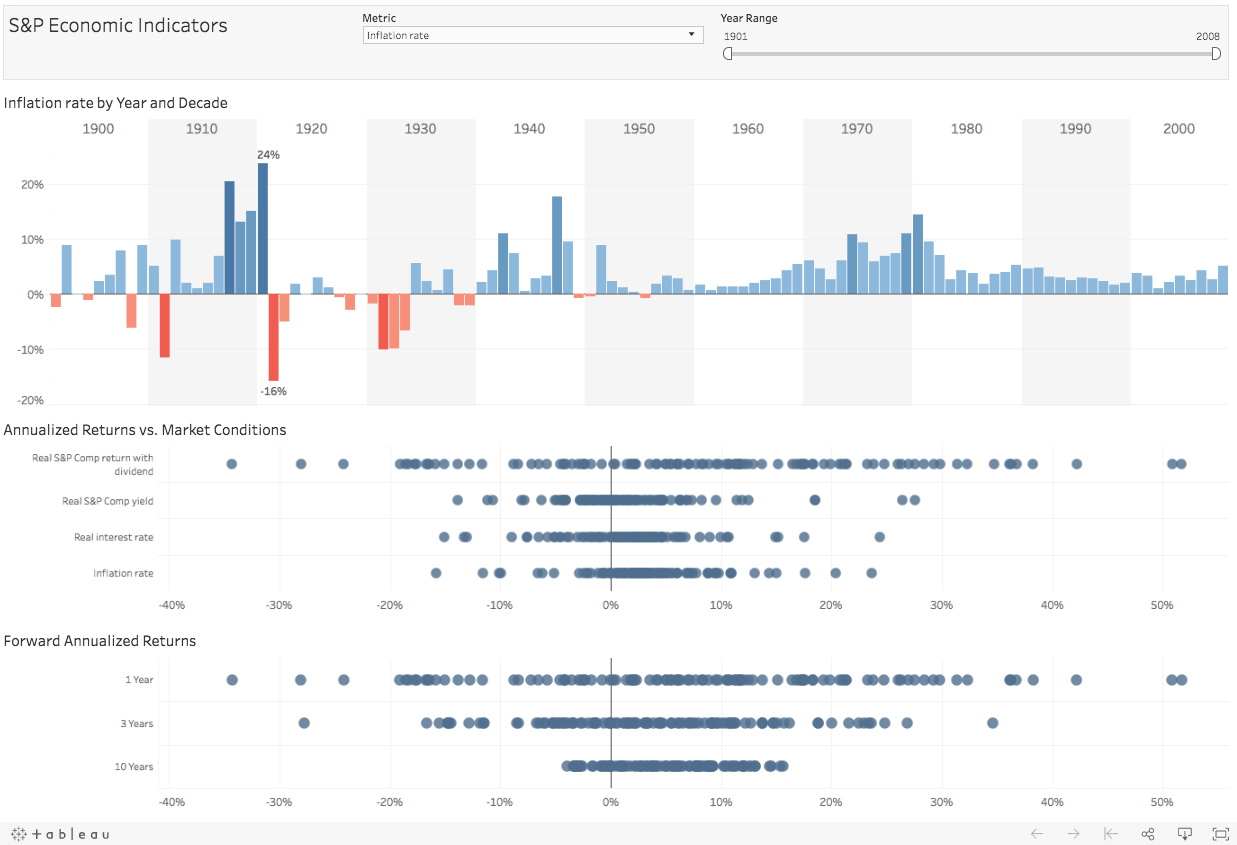
这个示例仪表板通过各种经济指标展现了美国经济的长期推动力。
在采用 BI 方面,多个不同行业走在了前列,包括医疗、信息技术和教育。所有组织都可以使用数据来实现运营方式的变革。 金融服务公司嘉信理财采用商业智能后,得以全方位了解其在美国的所有分公司的情况,从而掌握了准确的绩效指标并发现了存在机会的领域。通过使用一个集中的商业智能平台,嘉信理财将其所有分公司数据都整合到了一个视图中。 现在,分公司经理可以发现投资需求可能会有变化的客户。领导团队则可以跟踪某个地区的业绩是高于还是低于平均水平,还可以点击查看是哪些分公司推动了该地区的业绩。这就带来了更多的优化机会,同时也为客户提供了更好的服务。
商业智能工具和平台
许多自助式商业智能工具和平台可以简化分析过程。人们因此可以更加轻松地查看并理解自己的数据,而无需掌握专业的数据挖掘技术。许多 BI 平台都可以用于生成临时报告、进行数据可视化,并为多个层级的用户创建自定义仪表板。 我们已经概述了关于评估现代 BI 平台的建议,您可以根据这些建议选择适合贵组织的平台。数据可视化就是用来呈现商业智能的一种较为常见的方法。
可视化分析和数据可视化的好处
可视化分析使您可以始终专注于数据分析。
数据可视化就是用来呈现商业智能的一种较为常见的方法。人是视觉动物,对于图案或颜色差异一看就懂。数据可视化正是通过更容易为人所理解的方式来呈现数据。 各种可视化图表组合成仪表板后,可以像讲故事一样快速传达数据内涵,突显出在手动分析原始数据时可能很难发现的趋势或规律。这种易懂的形式还可以激发用户围绕数据进行更多对话,从而产生更广泛的业务影响。
为您的公司使用自助式商业智能 (SSBI)
如今,越来越多的组织改用现代商业智能模型,这种模型的特点在于以自助方式分析数据。IT 部门负责管理数据(安全性、准确性和访问权限),同时允许用户直接与自己的数据交互。 像 Tableau 这样的现代分析平台可以帮助组织顺利完成分析循环中的每一个环节 - 通过 Tableau Prep 可以完成数据准备,通过 Tableau Desktop 可以进行分析和发现,而通过 Tableau Server 或 Tableau Cloud 则可以进行共享和管控。也就是说,IT 部门可以有效管控数据访问,同时使得更多用户能够以可视化方式探索自己的数据并分享得出的分析见解。
商业智能的未来角色
目前,商业智能正在不断发展来适应新的业务需求和技术。因此,我们每年都会找出当前的趋势,让用户能够及时了解创新动向。大家普遍意识到,人工智能和机器学习将会继续增长,并且企业可以将来自 AI 的见解整合到更广泛的 BI 战略中。各公司都在努力提升数据驱动程度,因此会采取更多措施来共享数据和开展协作。数据可视化对于跨团队和部门的协作将更加不可获取。 本文只是对广阔的商业智能领域进行了简单的介绍。BI 提供了近实时销售跟踪功能,让用户能够深入了解客户行为、预测利润,以及实现其他目标。零售、保险和石油等多个行业都已经采用了 BI,并且每年都有更多行业加入。BI 平台可以适应新的技术及其用户的创新。请关注我们列出的当前 10 大 BI 趋势,及时了解商业智能的各种趋势和变化。