All stories
 Tableau Community
Meet our Tableau TEN-ured community members!
 16 August, 2016
There's something special about the number ten. Sure, it's only got one more digit than nine, but that digit makes a world of difference. Tableau 10 is big! It's an exciting milestone for us, and we couldn't have gotten there without you, our incredible community.
16 August, 2016
There's something special about the number ten. Sure, it's only got one more digit than nine, but that digit makes a world of difference. Tableau 10 is big! It's an exciting milestone for us, and we couldn't have gotten there without you, our incredible community.
 Product
Hello, world. It’s Tableau 10
 16 August, 2016
I’m pleased to announce Tableau 10 is now available for download. So what’s in it? For starters, it has an entirely new look and feel with beautiful defaults and colors to make your viz shine.
16 August, 2016
I’m pleased to announce Tableau 10 is now available for download. So what’s in it? For starters, it has an entirely new look and feel with beautiful defaults and colors to make your viz shine.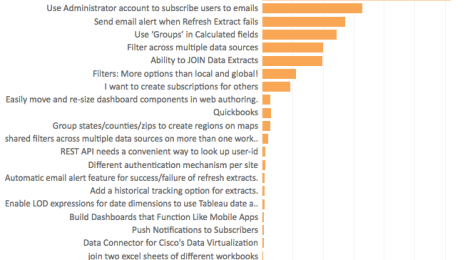 Product
Your ideas are now reality in Tableau 10
 16 August, 2016
Tableau 10 is here! And thanks to your ideas, it’s one of our best releases yet. There are dozens and dozens of new features in Tableau 10, and many of them started as ideas from you, the community.
16 August, 2016
Tableau 10 is here! And thanks to your ideas, it’s one of our best releases yet. There are dozens and dozens of new features in Tableau 10, and many of them started as ideas from you, the community. Mobile
Tips for designing device-specific dashboards that make everyone happy
 15 August, 2016
You’ve connected to data, created some views, placed them on a dashboard, and now it’s time to share. Before you do, have you considered who you are sharing your dashboard with? Check out these tips and tricks for using Device Designer (new in Tableau 10!) to let your data shine on phone, tablet and more.
15 August, 2016
You’ve connected to data, created some views, placed them on a dashboard, and now it’s time to share. Before you do, have you considered who you are sharing your dashboard with? Check out these tips and tricks for using Device Designer (new in Tableau 10!) to let your data shine on phone, tablet and more.
-
 Tableau Community
This data kid's favorite Pokémon? He found the answer in the data
 12 August, 2016
Judah Bausili has always enjoyed catching Pokémon, but he hasn’t always been discerning about the types he caught. And that’s where Ben, his data-minded dad who happens to work for Tableau Gold Partner InterWorks, saw an opportunity.
12 August, 2016
Judah Bausili has always enjoyed catching Pokémon, but he hasn’t always been discerning about the types he caught. And that’s where Ben, his data-minded dad who happens to work for Tableau Gold Partner InterWorks, saw an opportunity.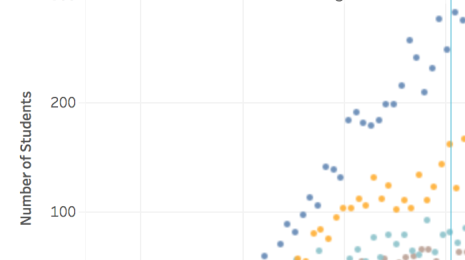 Product
Tableau 10 includes a new typeface designed for data
11 August, 2016Last January, we decided it was time to move beyond the limited set of faces available to most users. Like with the new color palettes in Tableau 10, we wanted to go all-in to create the best typeface possible. This led us to partner with Tobias Frere-Jones, a world-class designer with over 700 typefaces too his name. Tableau Community
We want YOU to help us design our new T-shirt!
Fellow data lovers, here’s your chance to be Tableau famous: Send us your best design idea for our new Tableau User Group t-shirt!
 Visualizations
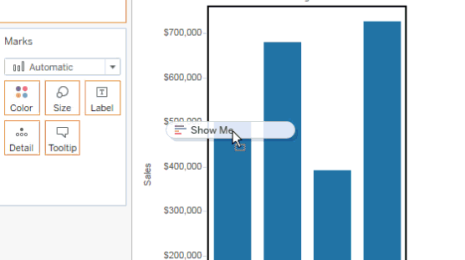
Save time with these 10 Tableau shortcuts
We all want to see and understand our data—and fast. So I thought I'd share 10 Tableau shortcuts to help save you time.


