Announcing the Launch of Tableau Public 10
Tableau Public authors everywhere, take a victory lap! Tableau Public 10 is here, thanks in large part to your input.
Over the past few years, you've told us the experience on mobile devices matters a great deal to you and your readers. You've told us the importance of mobile has continued to grow along with your website traffic.
Our talented developers took your input and went to work. And we're thrilled to give you Tableau Public 10 featuring device designer. You can now create and publish vizzes optimized for desktop, tablet, and mobile phones!
So How Does Device Designer Work?
Take a look at the embedded viz below. It shows how, per capita, carbon dioxide emissions have changed over time:
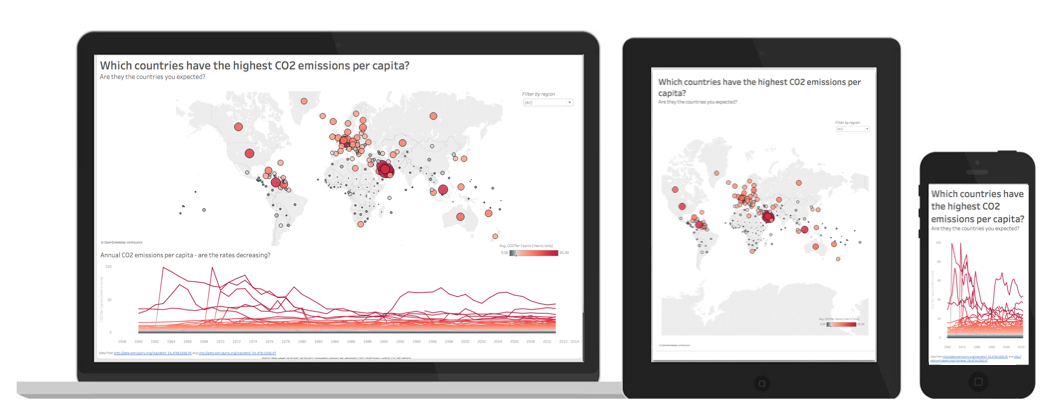
Do you see a map? A timeline? Both? It depends; what you see is controlled by the width of your screen at the time you loaded this page.
- For screens with height and width greater than 800 pixels, Tableau Public shows the desktop version of this particular viz, which we designed to include both the map and timeline due to the luxury of space
- For screens with height and width between 500 and 800 pixels, readers will see the tablet version, which we configured to only show the map in this case
- For screens with height and width less than 500 pixels, the phone version (timeline only) shows up
The image below shows what renders when viewing the viz on different devices. Keep in mind that you, as the author, have the ability to customize each experience as you see fit.

This feature was designed to give you, the author, optimal control over the look and feel of your vizzes on these different platforms. For more information on how to use this powerful new feature, visit our special Tableau Public 10 resources page or sign up for one of our live, feature-specific webinars in the coming weeks.
Connect to Google Sheets with Daily Auto-Refresh!
Another highly-requested feature that we're excited to launch is the ability to connect to data stored in Google Sheets. Tableau Public authors can now configure their vizzes to automatically refresh! That's right, our developers added the option to set your visualization to refresh daily, meaning if your Google Sheets file changes in any way, those changes will be reflected in your live viz by the end of the day without you taking any action.
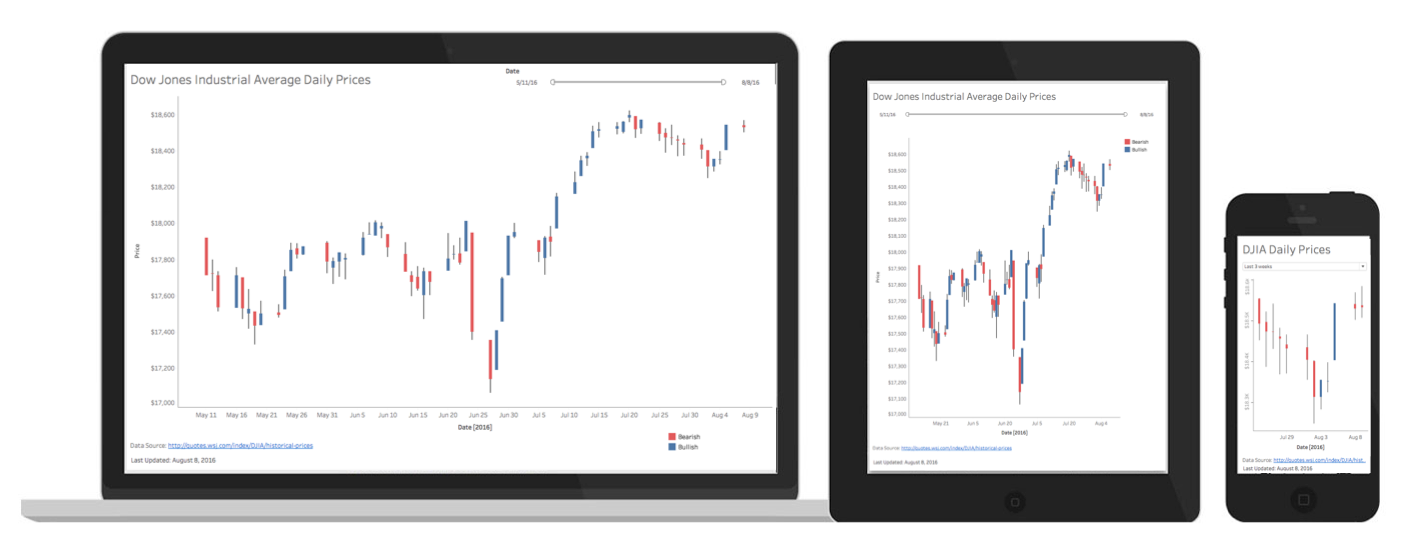
Here's a dashboard that shows the recent history of the Dow Jones Industrial Average.
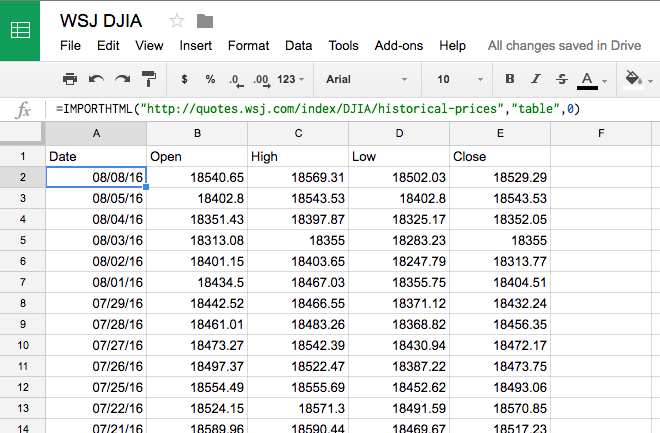
The data that drives the dashboard comes from a table published by the Wall Street Journal that gets imported into a Google Sheet as shown in the image below:

Does your Google Sheets data need refreshing more than once a day? You can always update your dashboard at any time by clicking the "request update" button from the viz homepage, no republishing necessary. And if you're wondering whether this viz also adjusts based on the width of your screen, it does!

So What Else Is New in Tableau Public 10?
Device designer and the Google Sheets connector with auto-refresh are just two of the many new features we packed into this major new release of our award-winning and free data visualization platform. We're also excited to bring you a number of additional new features. Here are a few notable ones:
- You can now use the data highlighter to select and highlight marks that have a common dimension
- Or quickly and easily change fonts across the entire workbook with a single click using the new workbook-formatting feature
- And the improved embed codes resize your vizzes to fit your reader's device when you publish with automatic or range dashboard sizing
- We've also revamped the Tableau Public 10 look with brand new iconography, typography, and colors for a cleaner, more beautiful design
Give these new features a try, check out our list of resources, and be sure to let us know what you think @tableaupublic.
Thanks again for all the great ideas! Keep them coming. We hope you love Tableau Public 10 as much as we do, and we're looking forward to seeing what you create with our latest release!
The Tableau Public Team


