All stories
 Visualizations
How to add context to Marimekko charts in Tableau
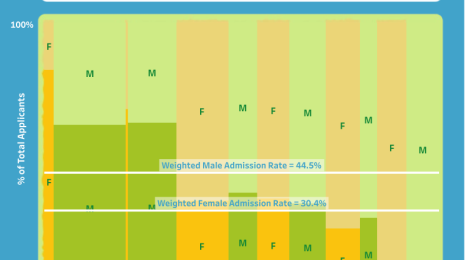
Throughout this series, we've been exploring admission rates at the University of California in Berkeley. In 1973, the overall graduate-school admission rates for men and women appeared to be biased toward men. But when looked at in more detail, the trend shifted the other direction. In four of the six largest departments, there were proportionately more women admitted than men.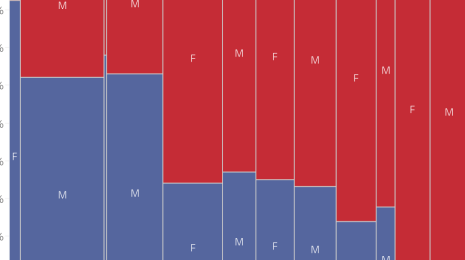 Visualizations
How to build a Marimekko chart in Tableau
Now that you know what a Marimekko chart is and when it’s most useful, it’s now time to learn how to build it in Tableau.
 Tableau Public
Web Scraping for Everybody: Using the Import Functions in Google Sheets with Tableau Public 10
 23 August, 2016
 Visualizations
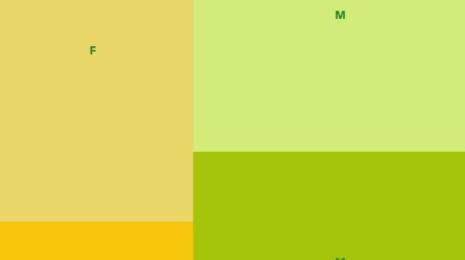
An introduction to Marimekko, a chart of many colors and many names
A Marimekko chart is a two-dimensional stacked chart of stacked, contiguous bars—looking somewhat like a Marimekko fabric. Marimekko charts combine visual pop with information—the eye captures two levels of information as it admires the colorful pattern the chart creates. Tableau
Tableau appoints new CEO
 22 August, 2016
We’ve decided it’s time to broaden our leadership team. I’m thrilled to share Adam Selipsky will join Tableau as our new CEO. Adam has spent more than a decade building Amazon Web Services from its inception. He’s been part of the leadership team that established AWS as the indisputable market leader in cloud platforms. Adam will start his new role on September 16, and we’re excited to further our mission under his leadership.
22 August, 2016
We’ve decided it’s time to broaden our leadership team. I’m thrilled to share Adam Selipsky will join Tableau as our new CEO. Adam has spent more than a decade building Amazon Web Services from its inception. He’s been part of the leadership team that established AWS as the indisputable market leader in cloud platforms. Adam will start his new role on September 16, and we’re excited to further our mission under his leadership.
 Visualizations
Primer: What exactly is clustering, and why would you use it?
 19 August, 2016
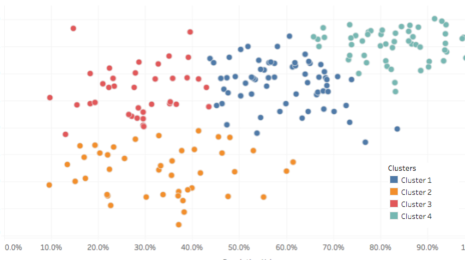
One great new feature in Tableau 10 is clustering. What was once only available to people who could use complex statistical tools can now be done with a drag and a drop. I know my mean from my mode and what a normal distribution looks like, but like many of our customers, I’m no statistical expert. I wanted to answer a simple question: What exactly is clustering and why would you use it?
19 August, 2016
One great new feature in Tableau 10 is clustering. What was once only available to people who could use complex statistical tools can now be done with a drag and a drop. I know my mean from my mode and what a normal distribution looks like, but like many of our customers, I’m no statistical expert. I wanted to answer a simple question: What exactly is clustering and why would you use it? Data
DataWith Tableau 10, exploring big data just got even easier
Earlier this week, Tableau released the much-anticipated Tableau 10. The team here at AtScale, being both big-data geeks and data-visualization nerds, has been eager to see how some of the great new features work with our business interface for Hadoop. We’ve been thrilled so far, and thought it would be nice to share some of the features we are most excited about.
 Enterprise
Ten features IT will love in Tableau 10
In Tableau 10, we’ve improved both the beauty and brains of Tableau. We’ve added dozens and dozens of new features to make your analysis faster, easier, and even more delightful. Here are ten features that are specifically designed to empower your entire enterprise.

