Tableau 2020.1
Explore the newest features in Tableau 2020.1 including dynamic parameters, viz animations and buffer calculations
Feature highlights
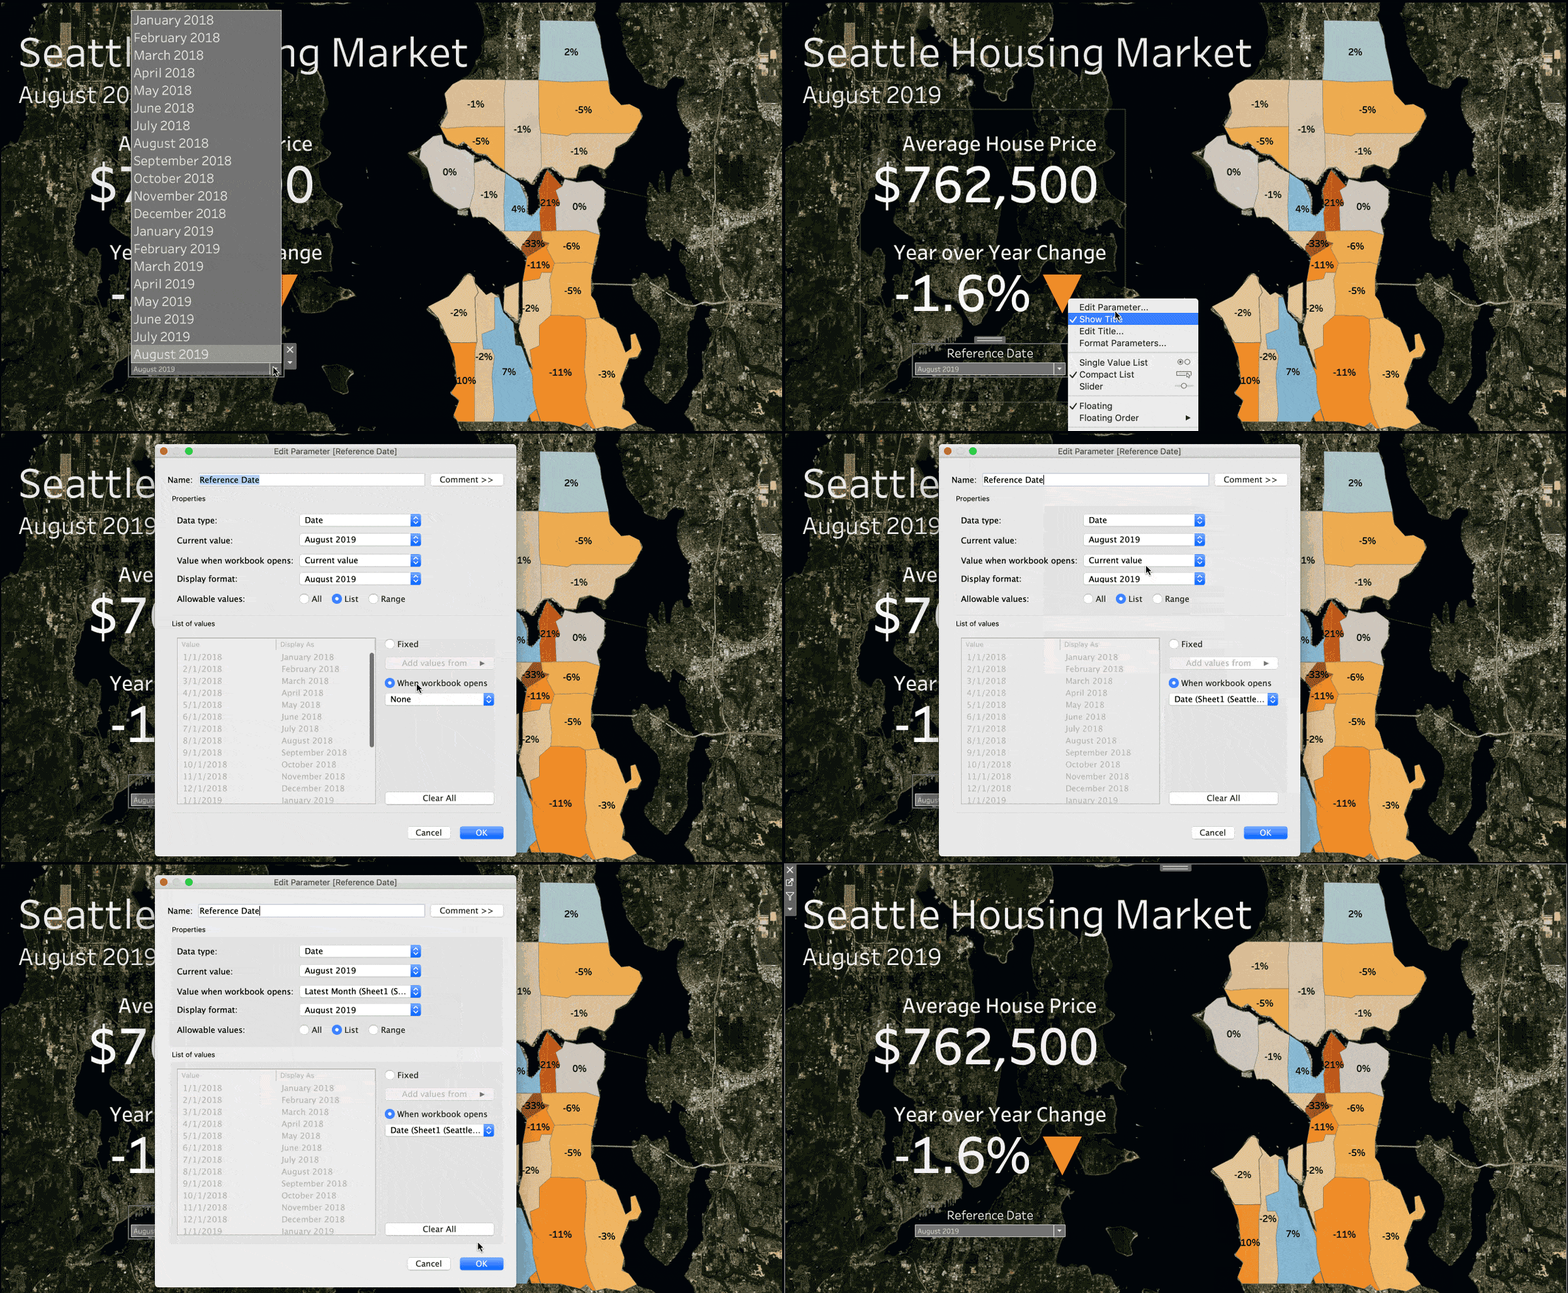
Dynamic parameters
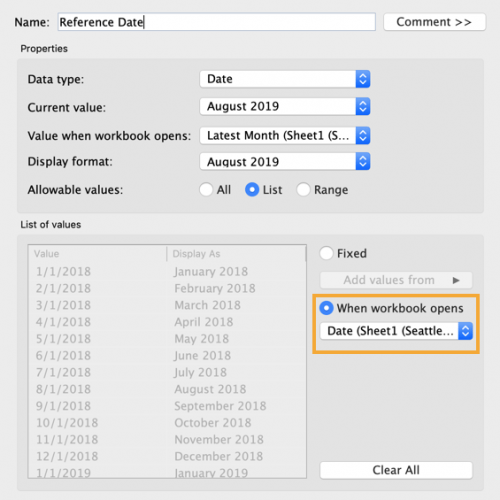
Say goodbye to republishing workbooks with parameters every time the underlying data changes. Set your parameter once and Tableau will automatically update the parameter’s list of values every time someone opens the workbook.
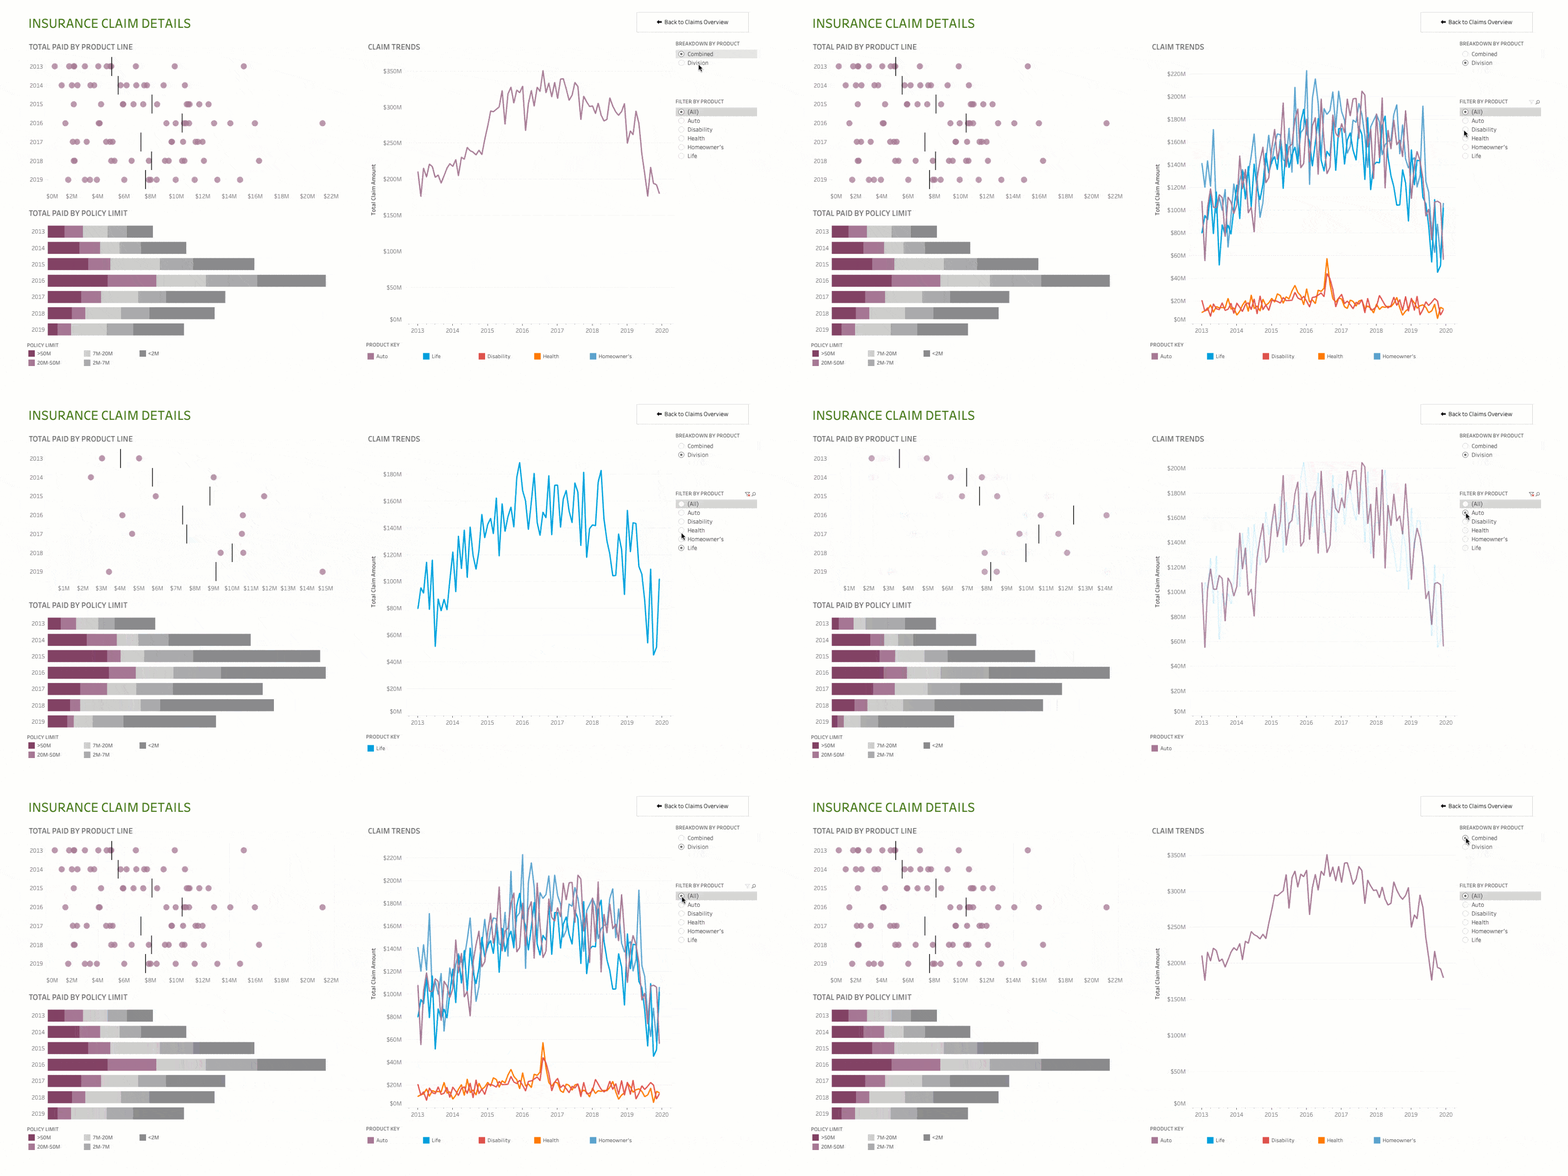
Viz animations
Viz animations help you see and understand your changing data. It’s easy to track the logical steps behind data’s evolution and tell powerful data stories. Sorting, filtering, adding fields and other actions will now smoothly animate your visualisations. Choose whether to turn viz animations on or off, and decide how you’d best like to apply animations to your new workbooks.
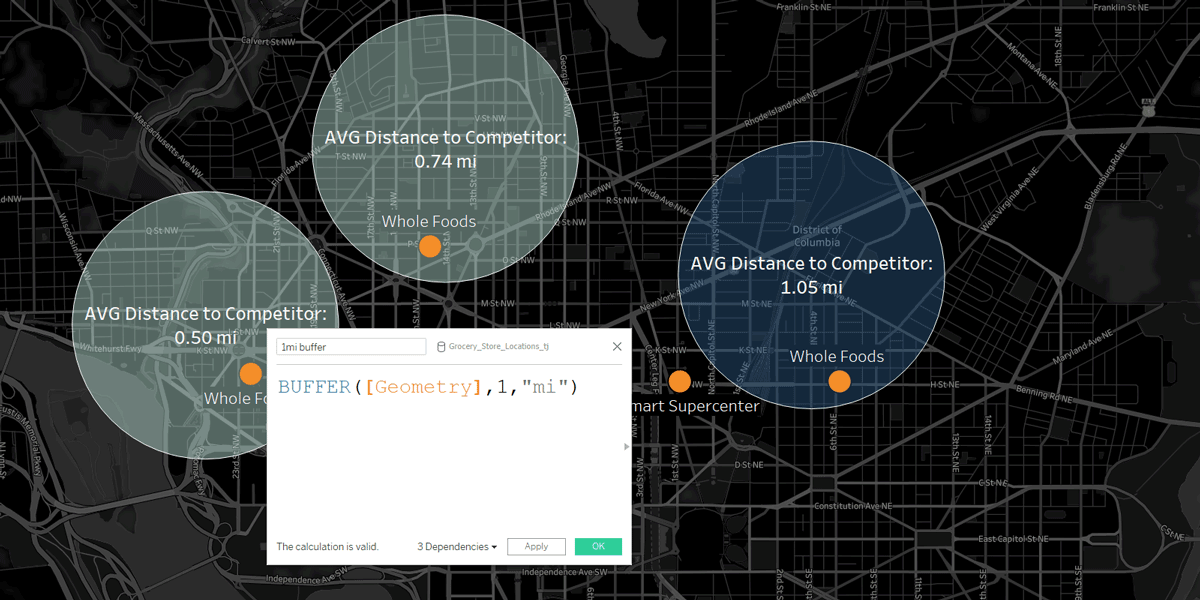
Buffer calculations
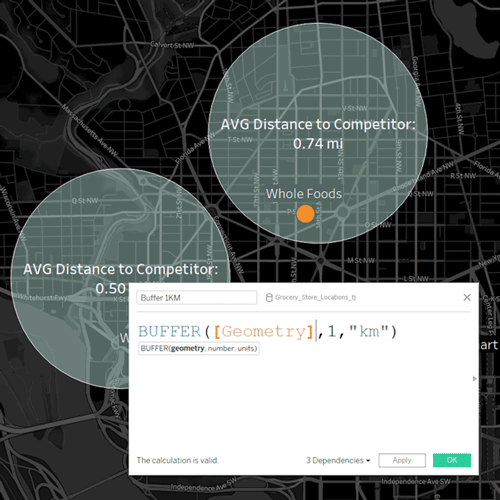
Buffer calculations allow you to visualise the distance around point locations. Give Tableau three parameters – location, distance and a unit of measure – and a buffer, or boundary, is instantly created. Answering complex spatial questions becomes easier than ever before. Visualise what properties are within 200 metres of a proposed public transport stop, how many competitors’ stores are within 1 mile of another of their stores, and more.
Each month, I manually update the parameter values of a dozen dashboards. Dynamic parameters will allow those parameters to be updated automatically, saving me hours every single month. This is the most requested feature in the history of Tableau and it is a complete game-changer – I cannot wait to see how others use it!
Tableau 2020.1 viz gallery
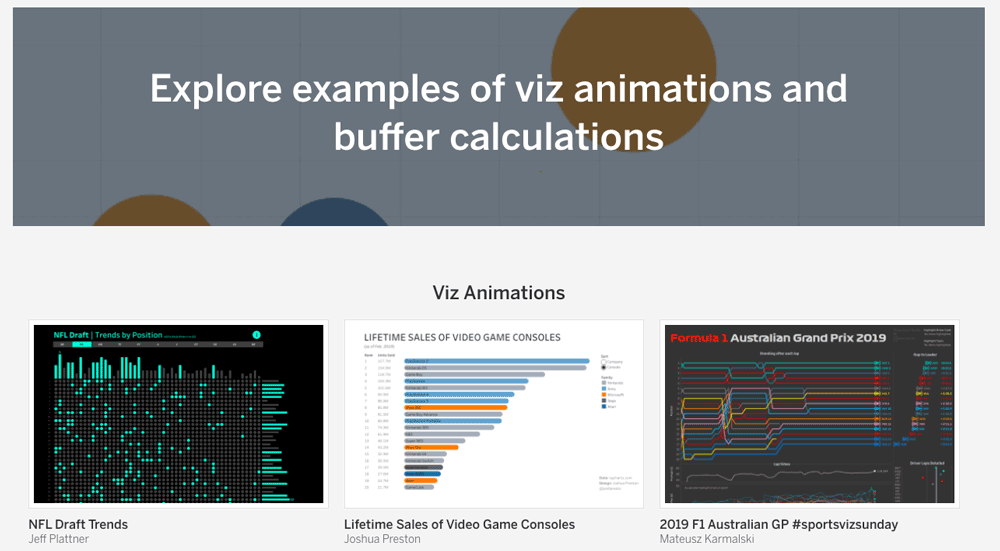
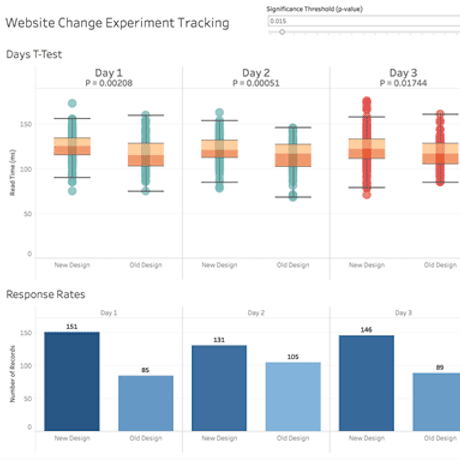
Explore creative examples of viz animations and buffer calculations from the Tableau community.
Learn moreAll features
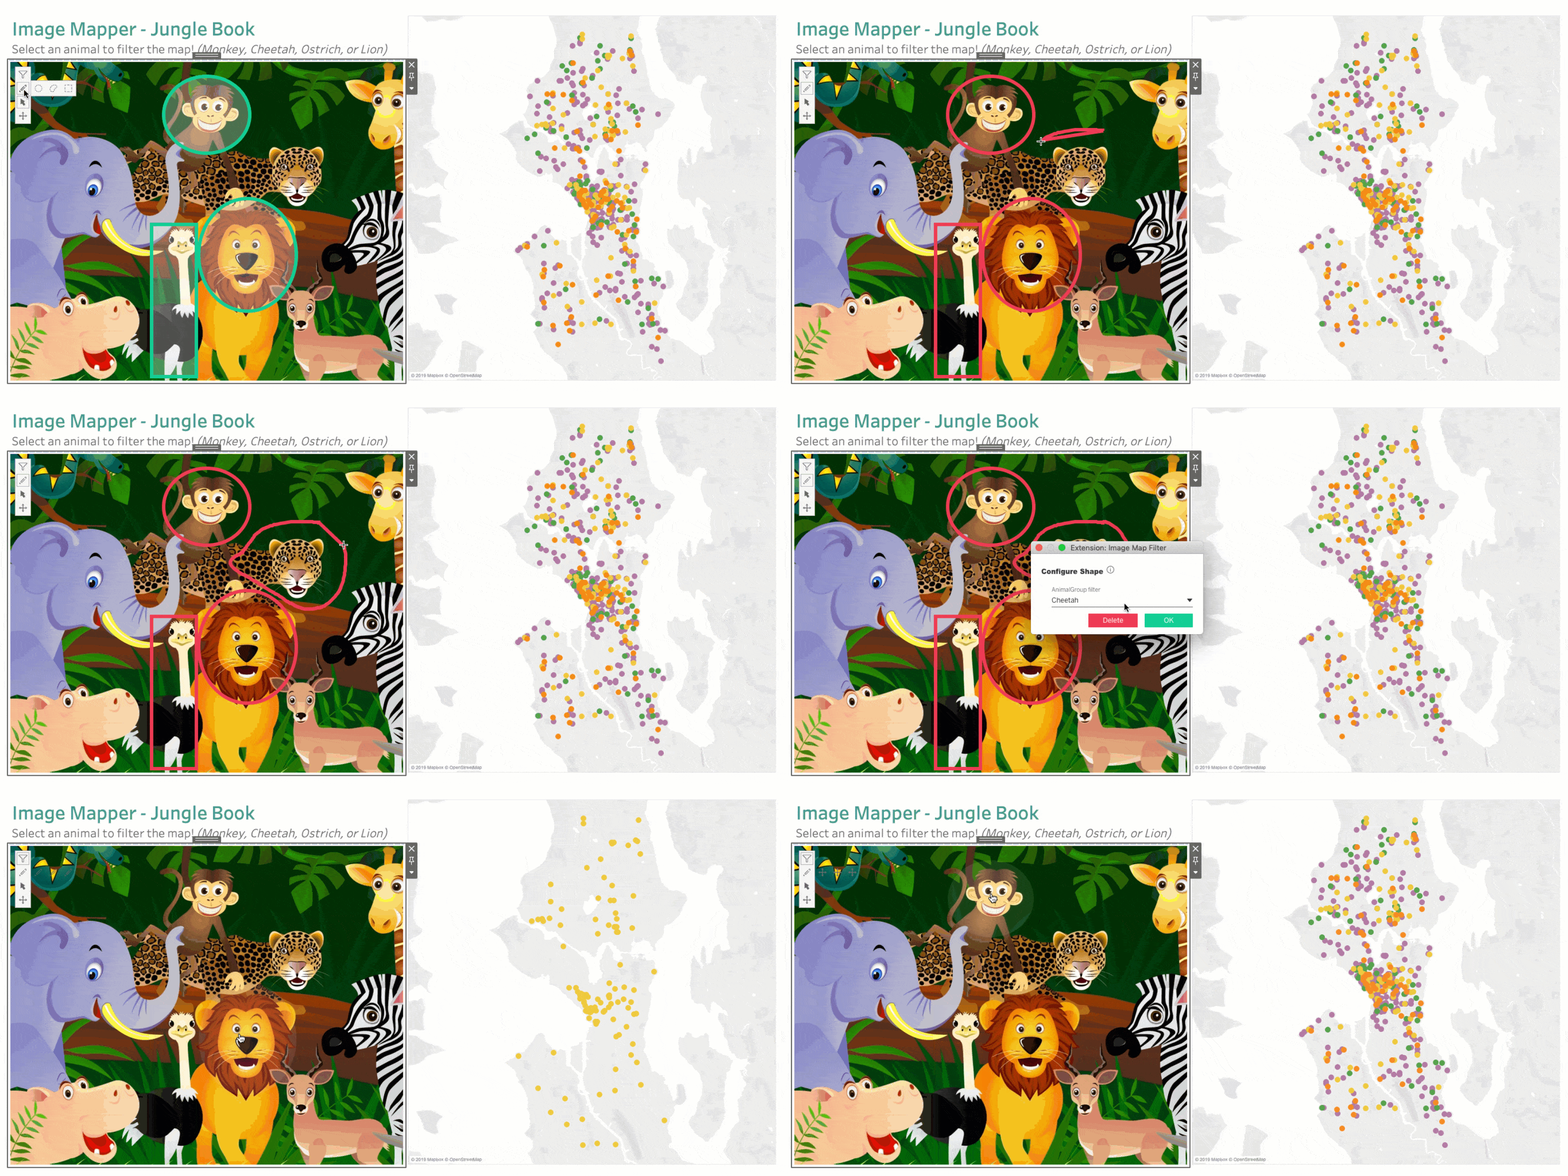
Dashboard extensions for Tableau Public
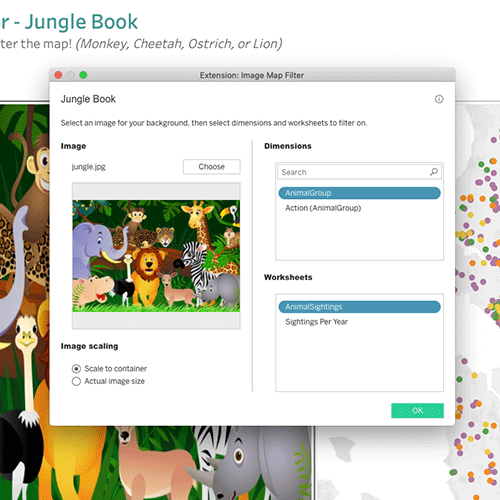
With extensions, you can create more customized visualisations. We now support the Image Map Filter, Single Checkbox Parameters and Filter Bookmarks extensions on Tableau Public. These extensions are available for download in our extension gallery.
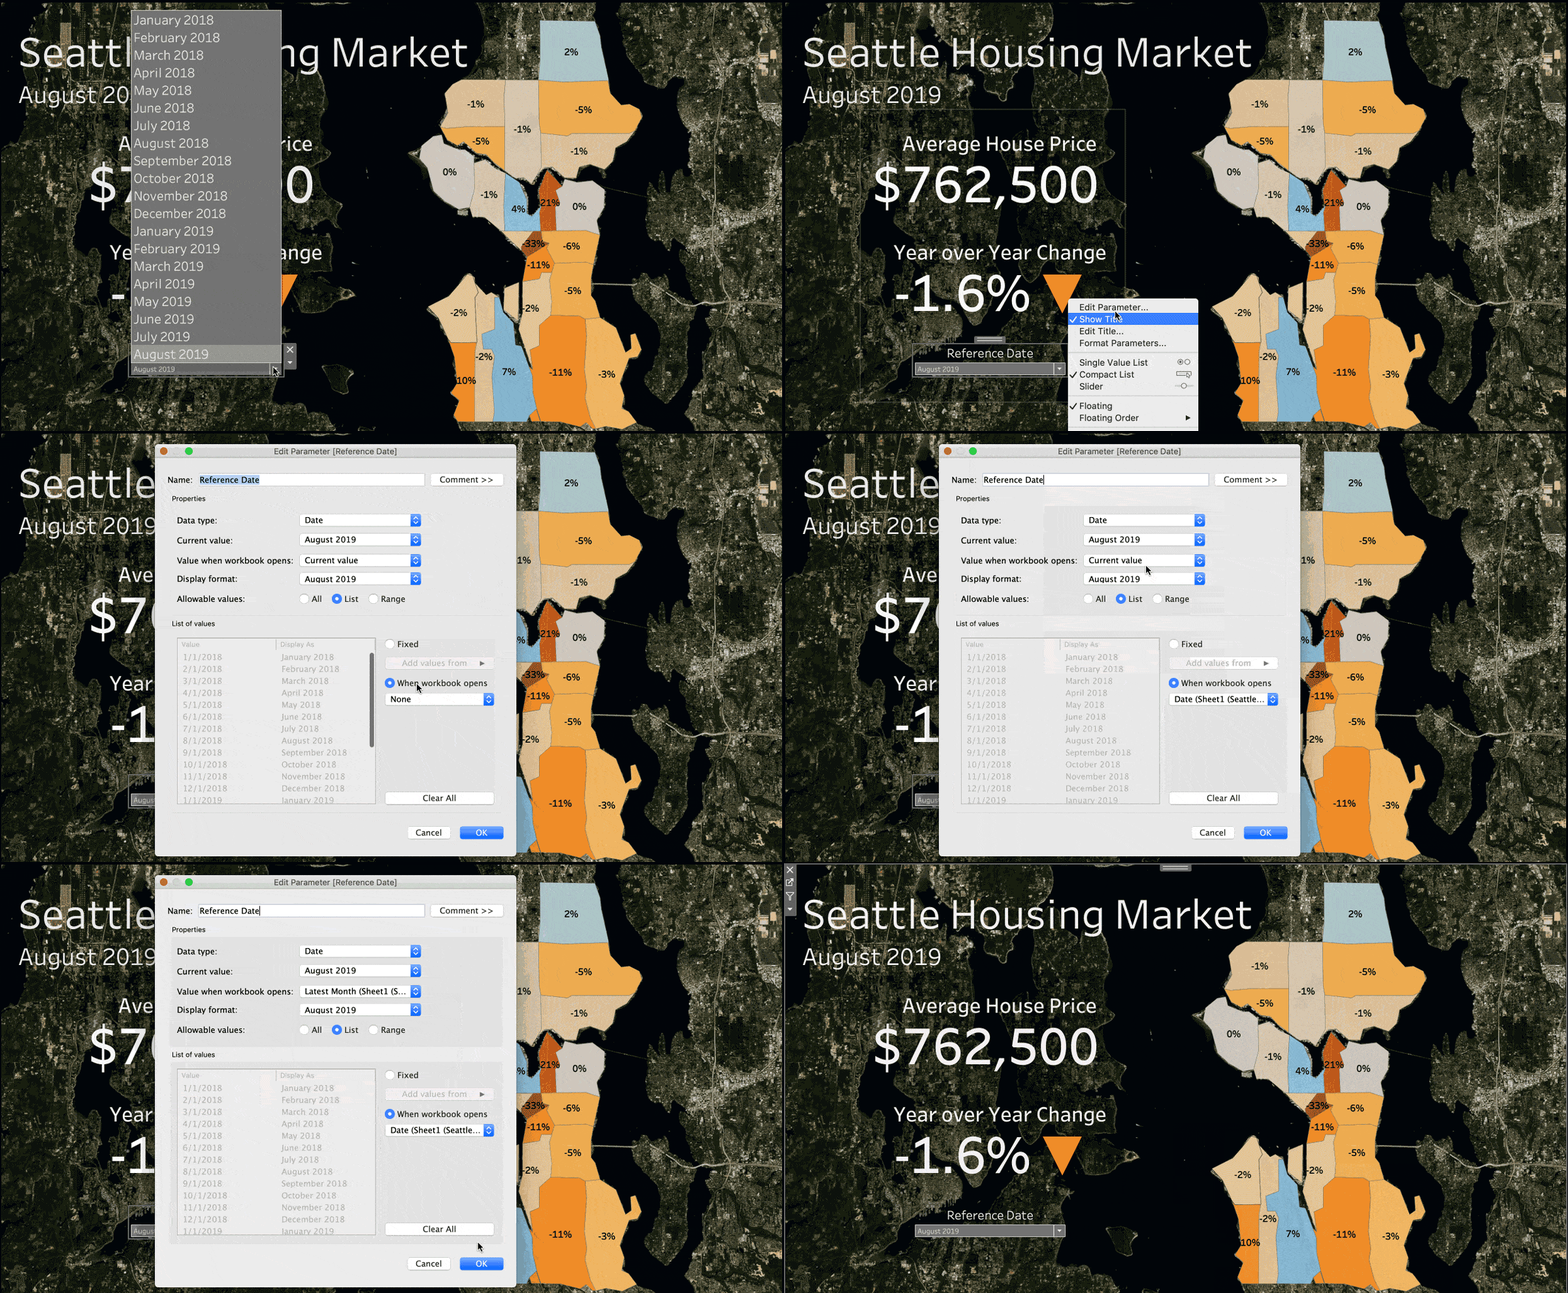
Dynamic parameters
Say goodbye to republishing workbooks with parameters every time the underlying data changes. Set your parameter once and Tableau will automatically update the parameter’s list of values every time someone opens the workbook.
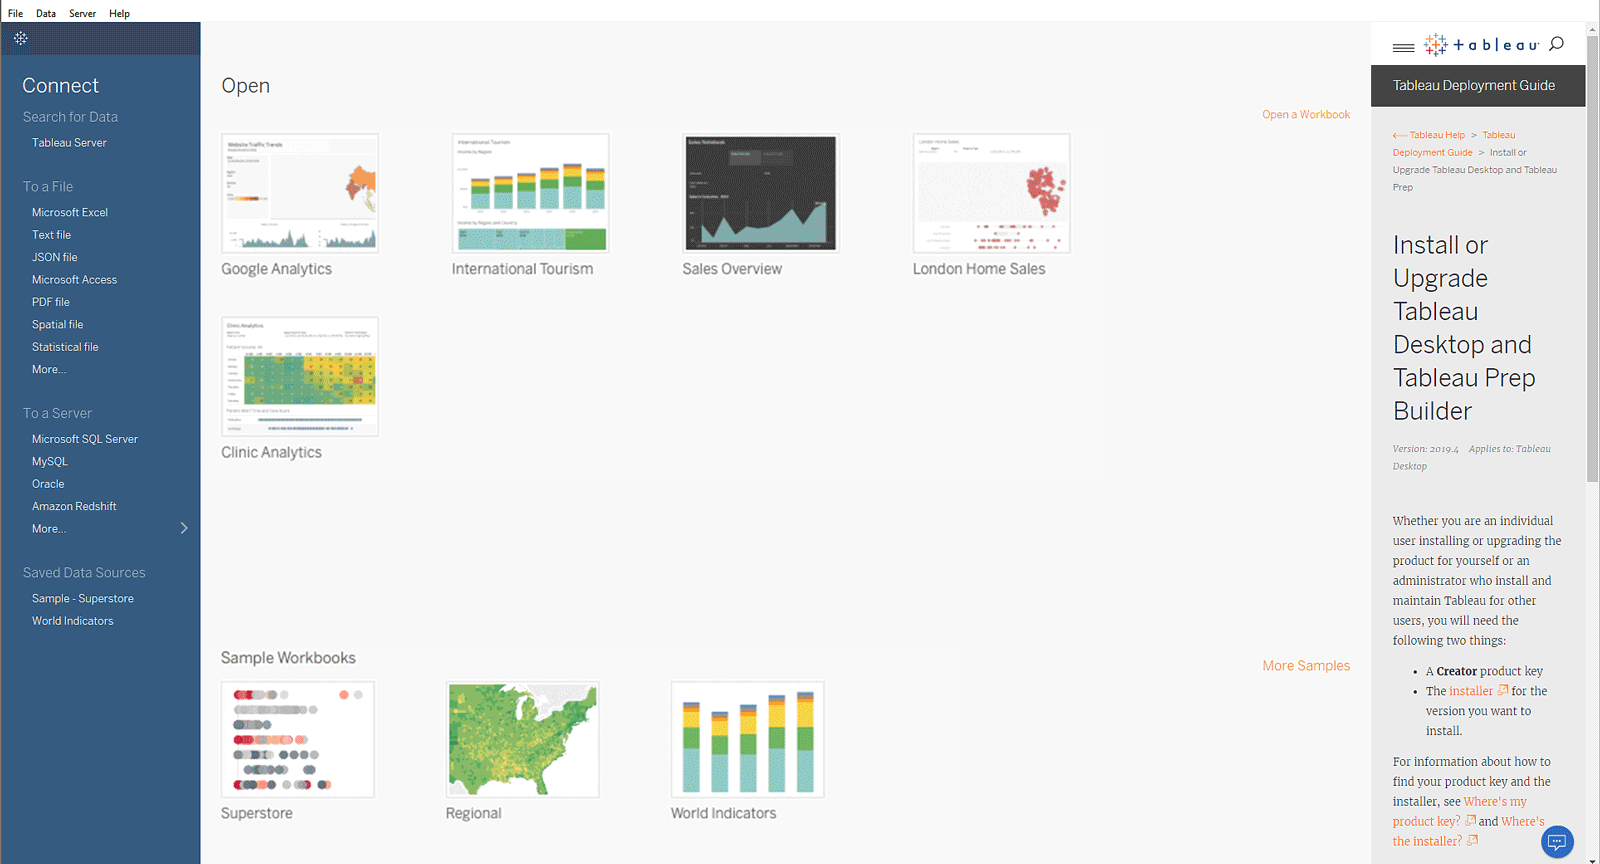
Customisable Discover pane for Tableau Desktop
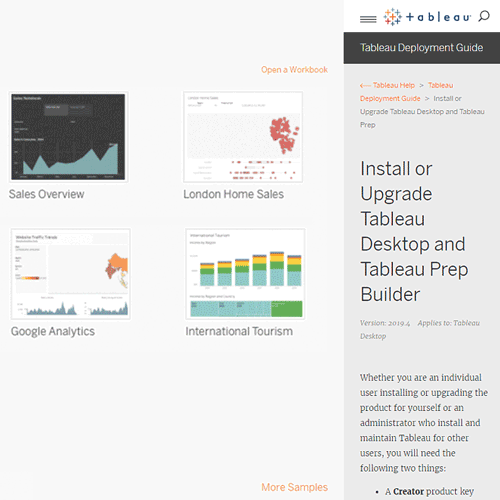
You can now customise the Discover pane that appears on the start page in Tableau Desktop to show your own custom content instead of the content Tableau shows by default. Provide links and information specific to your organisation to make it easier for your users to get started using Tableau quickly. Learn more about it here.
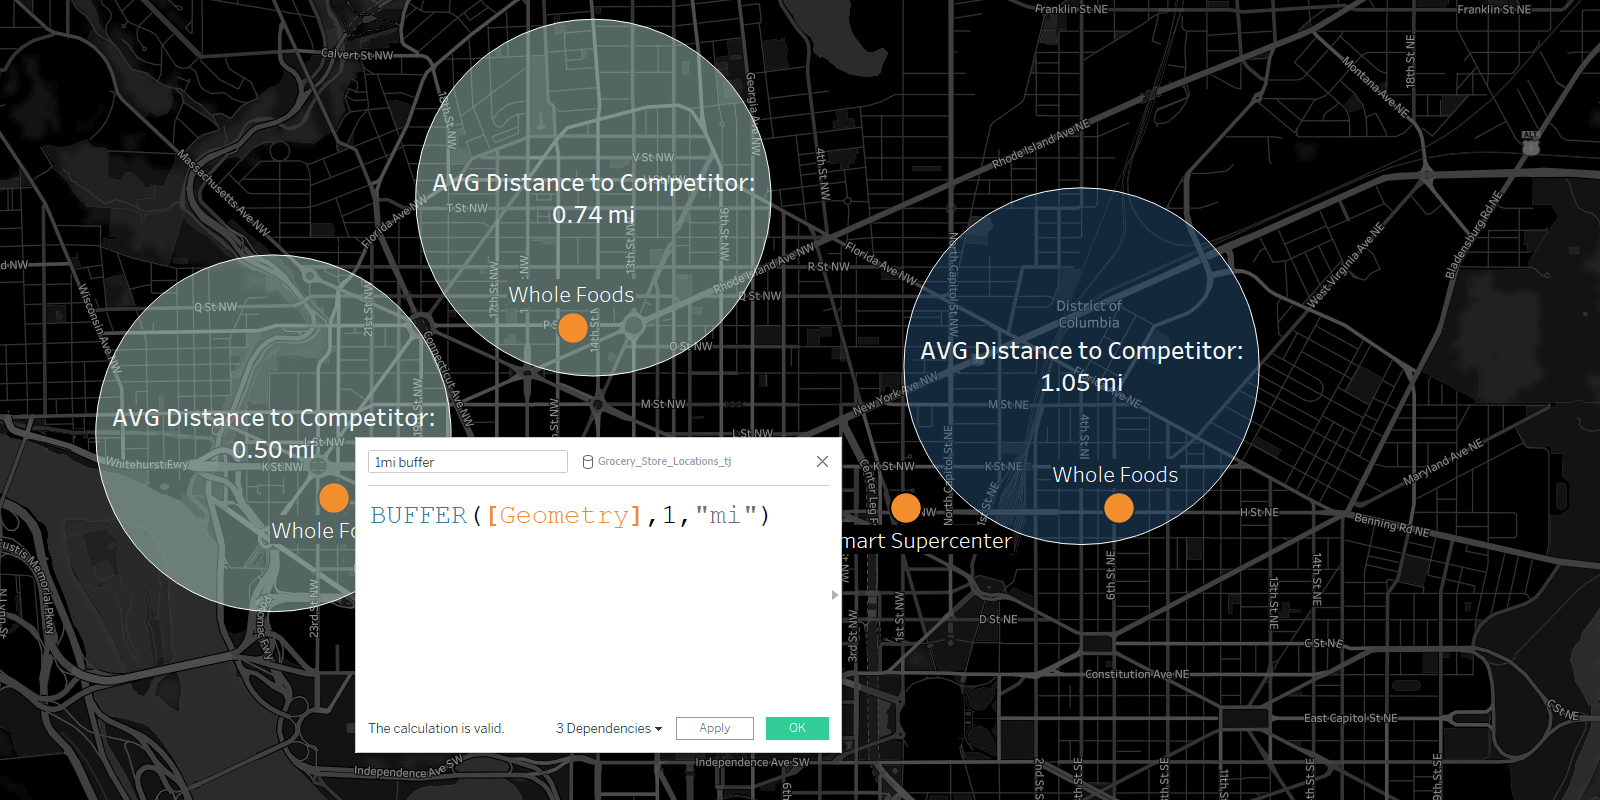
Buffer by distance calculations
Buffer calculations allow you to visualise the distance around point locations. Give Tableau three parameters – location, distance and a unit of measure – and a buffer, or boundary, is instantly created. Answering complex spatial questions becomes easier than ever before. Visualise what properties are within 200 metres of a proposed public transport stop, how many competitors’ stores are within 1 mile of another of their stores, and more.
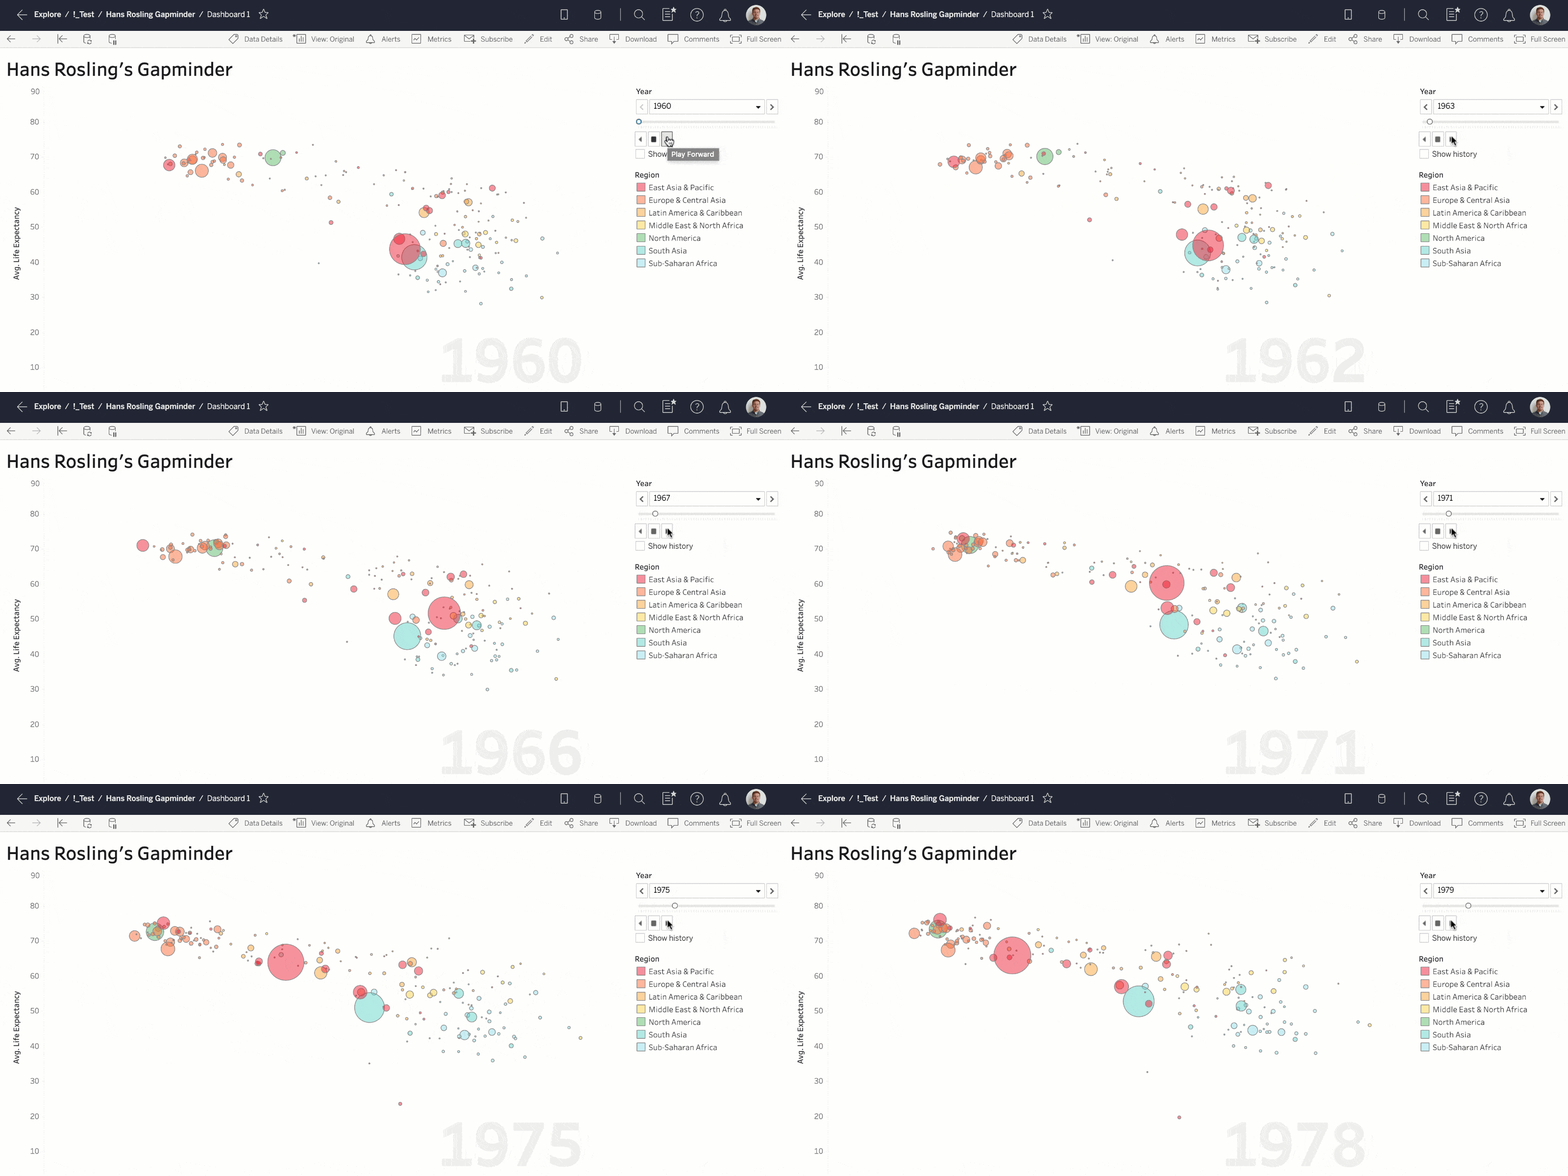
Play button in the browser
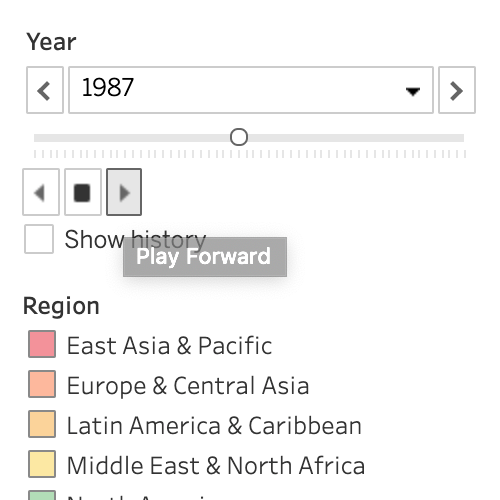
For workbooks using pages, press Play directly in the browser to see how a given measure affects the rest of your data. Combine with viz animations for smooth, coherent transitions showing changes between states or over time.
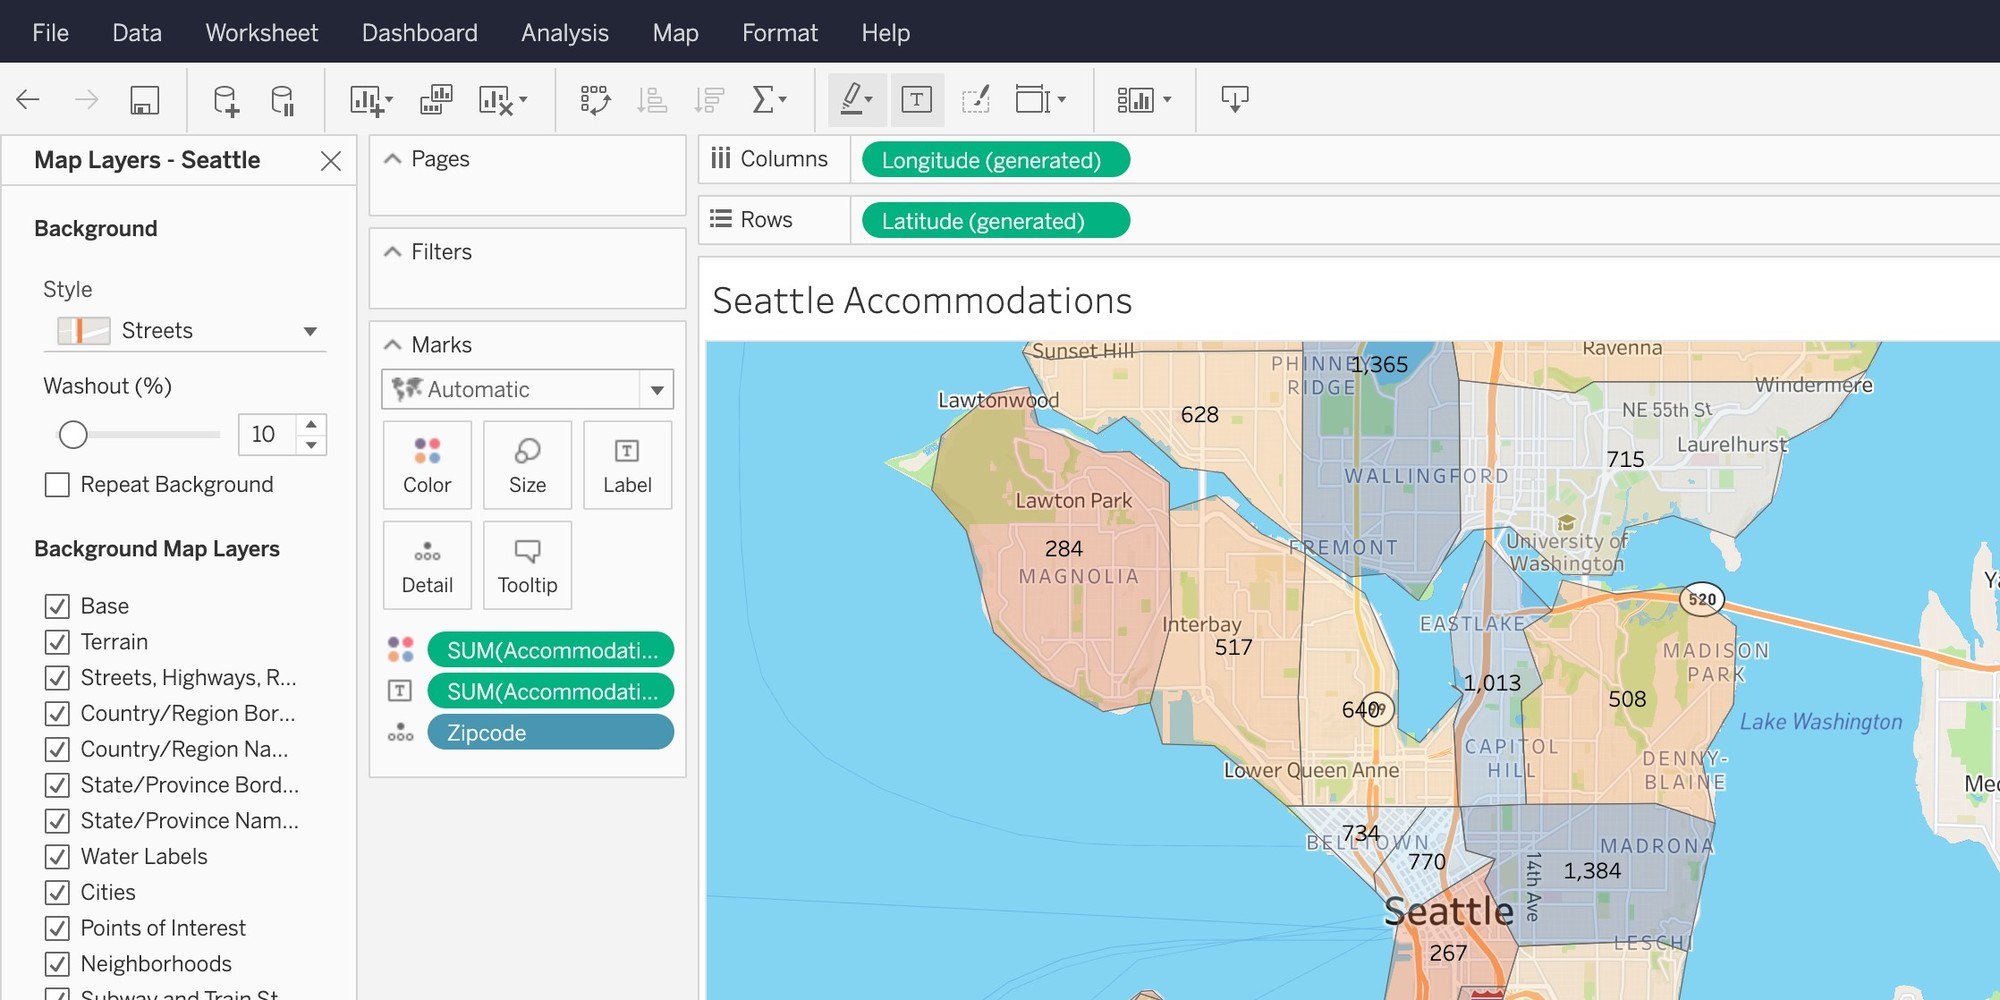
Map improvements in the browser
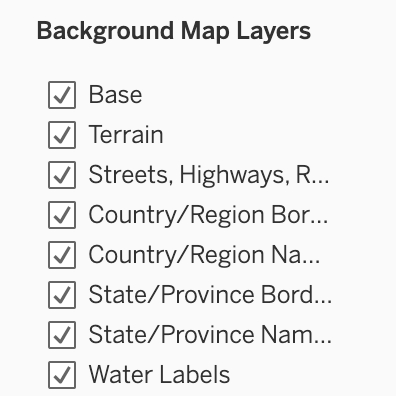
Control more aspects of your map in the browser. Change background map styles, repeat backgrounds, map layers and demographic data layers. In addition, the style picker drop-down makes it easier to find and distinguish between map styles.
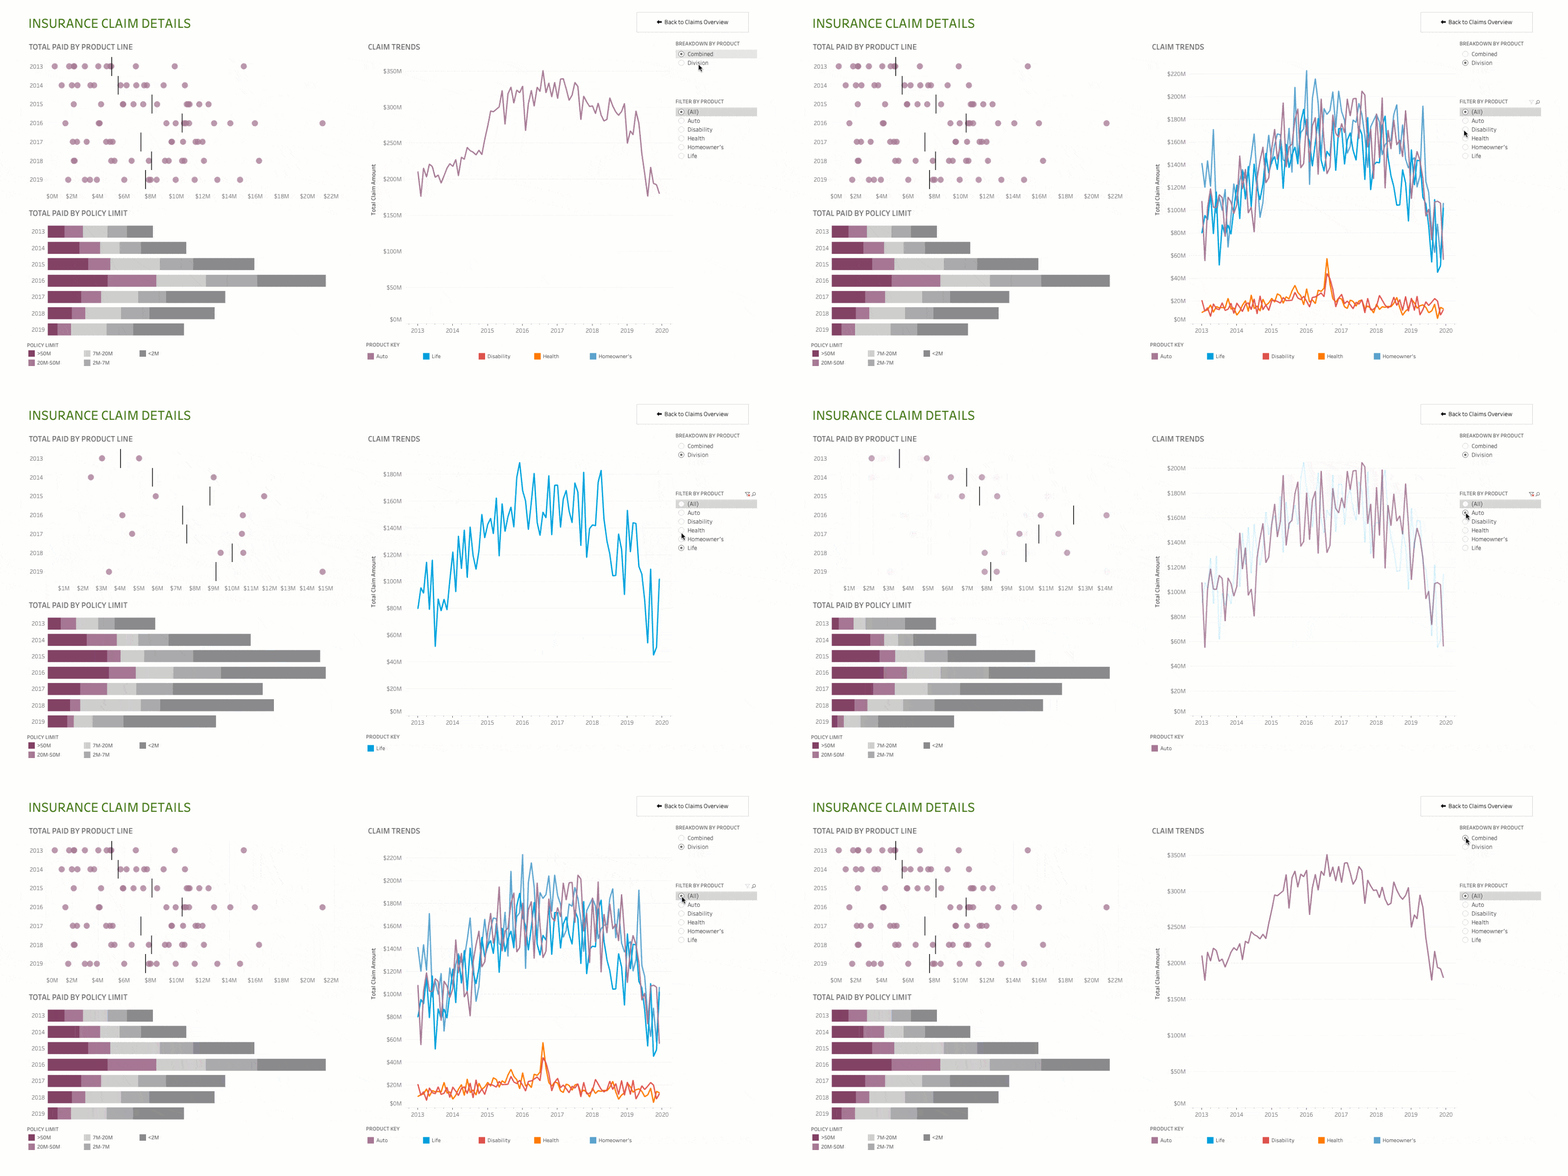
Viz animations
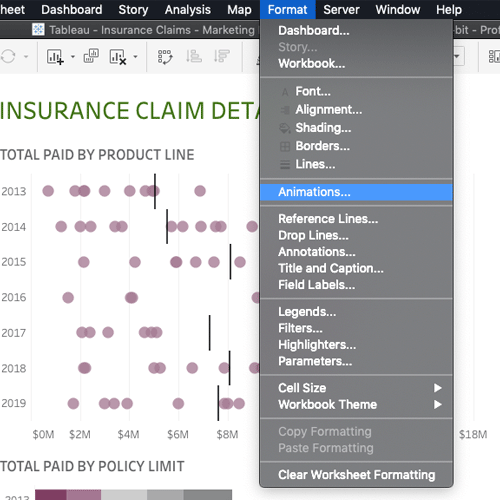
Viz animations help you see and understand your changing data. It’s easy to track the logical steps behind data’s evolution and tell powerful data stories. Sorting, filtering, adding fields and other actions will now smoothly animate your visualisations. Choose whether to turn viz animations on or off, and decide how you’d best like to apply animations to your new workbooks.
Improved site role allocation limits
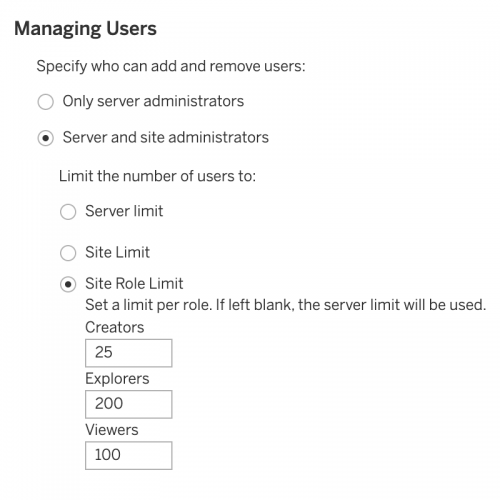
We've improved the way Server and site admins limit the number of licence types on their sites. This update will also allow Server admins to delegate licence allocation to site admins.
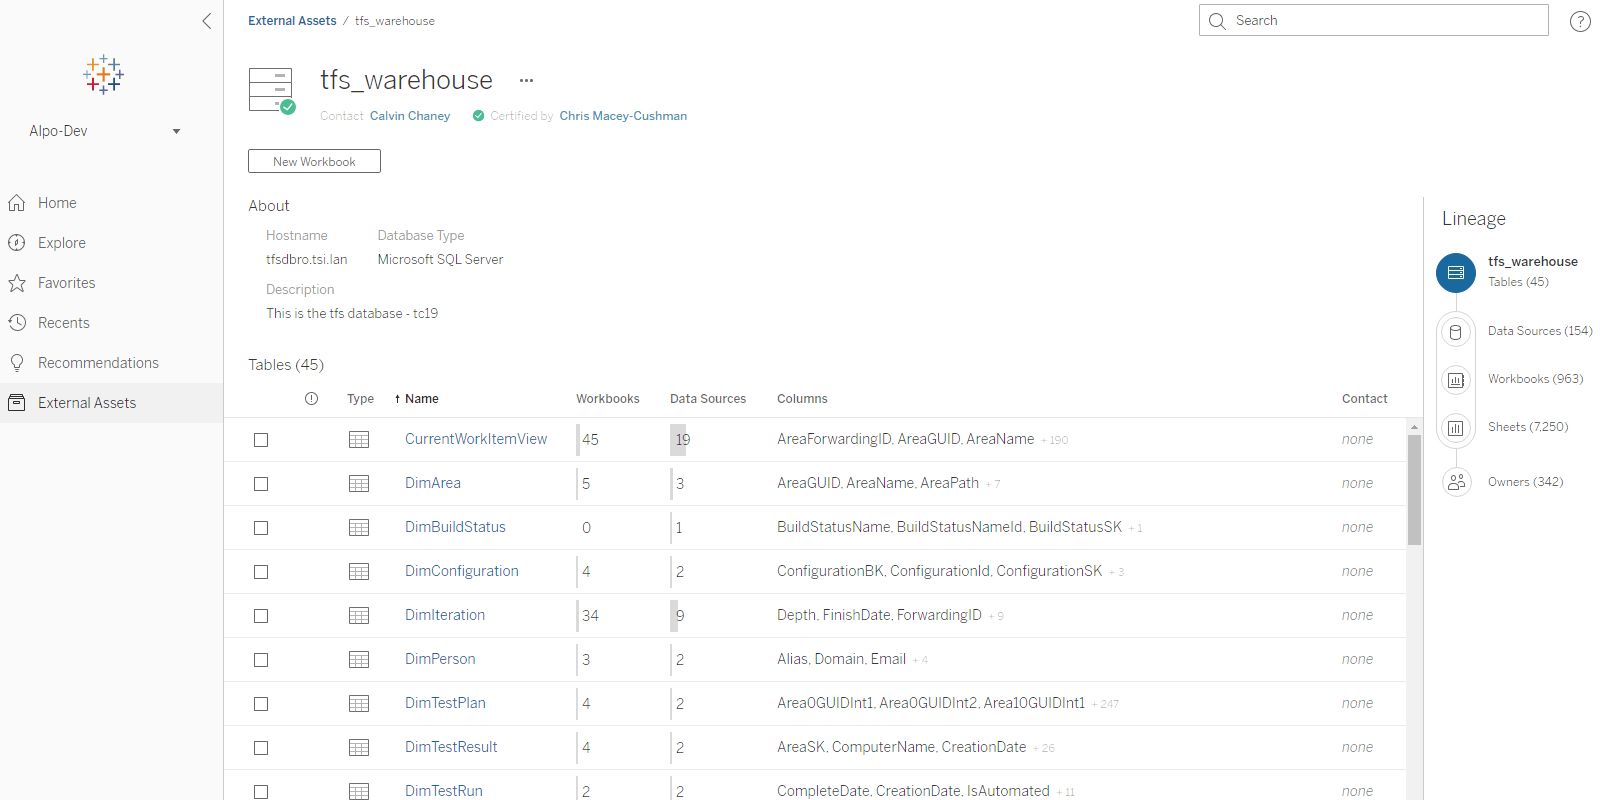
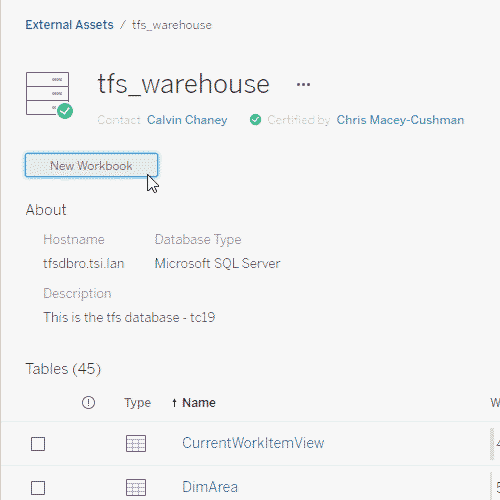
Create a workbook from External assets
Connect to the right data more quickly by creating a workbook directly from the External assets page.
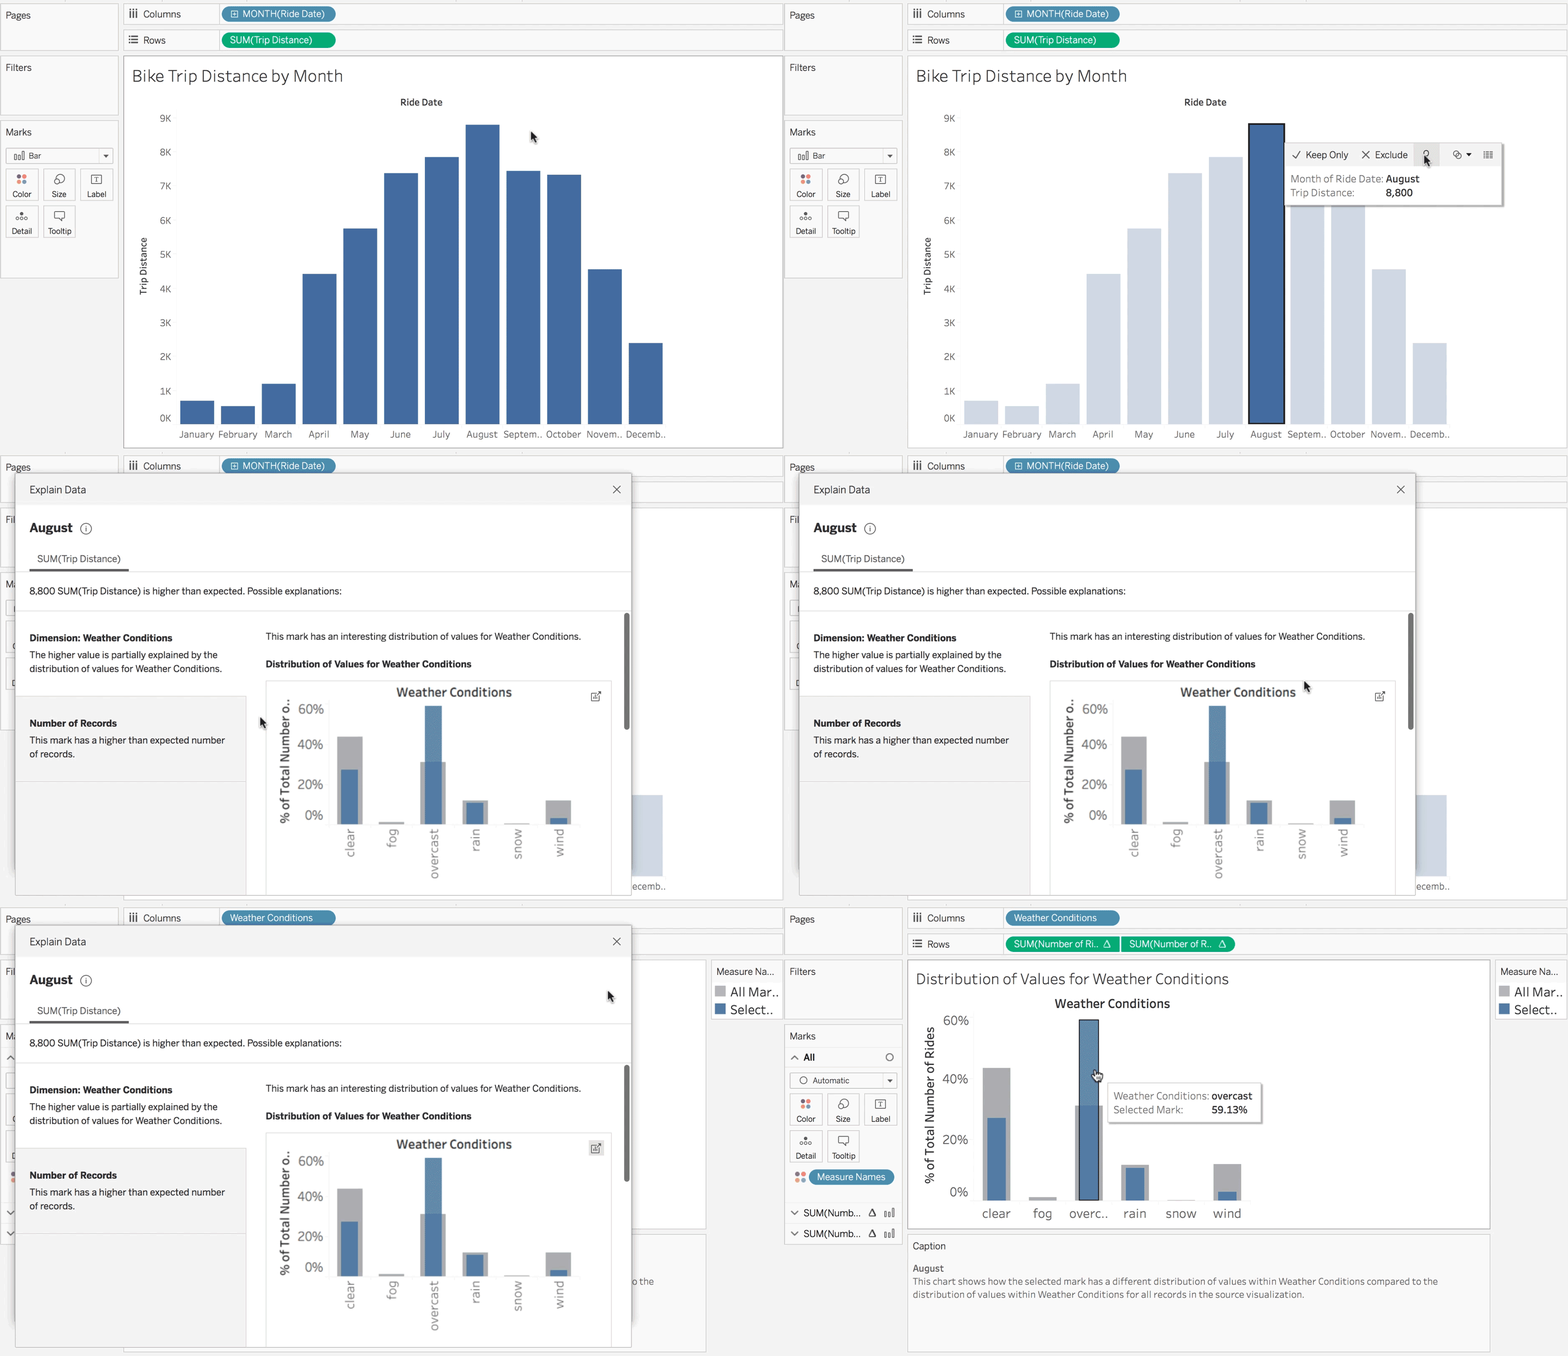
Explain Data improvements
Explain Data continues to get better and better, with performance improvements for wide datasets and refined models to help you go deeper into your data.
External file store for Tableau Server
As part of Advanced Management for Tableau Server, you can now leverage network storage devices for backup snapshots which significantly reduces the time required to perform a backup. You can also use this new capability to streamline your deployment topology by centralising your file store, eliminating the need to run file stores on multiple nodes in a Tableau Server cluster.
Salesforce connector updates
We’ve updated our Salesforce connector to provide faster performance, greater flexibility and even more data to play with. First, we changed the way we connect to Salesforce data; the connector now dynamically switches APIs depending on how large your dataset is, greatly increasing performance. Additionally, the Salesforce connector also now supports using the SOQL language in the same way that Custom SQL can be used today, adding flexibility to your analysis. Finally, you will now be able to connect to additional data objects like Salesforce Activity History and Campaign Influence, giving you even more data to see and understand in Tableau.
Snowflake connector updates
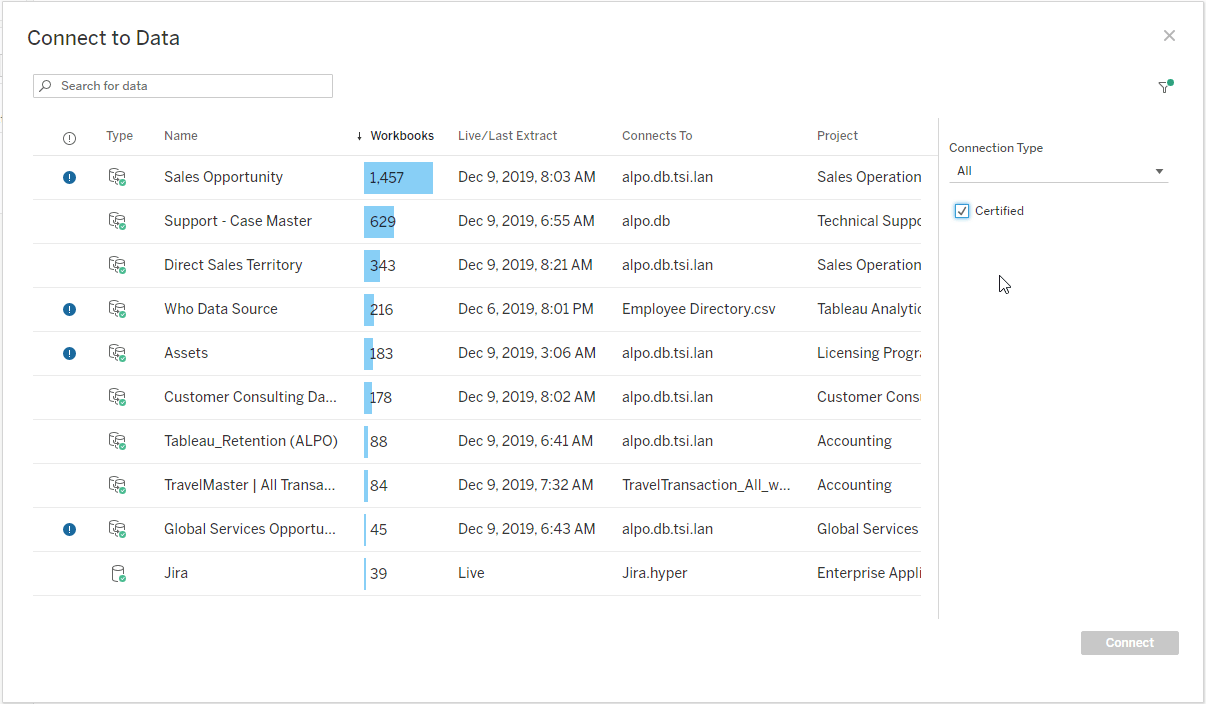
Filter by certified data sources
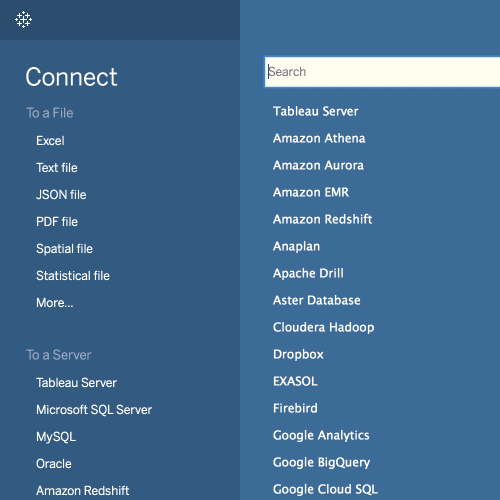
With the Data Management Add-on, users can now filter to a particular connection type or data sources with certifications or data quality warnings in the Connect to data experience. Get to the right data, faster.
Google BigQuery, Google Sheets and Cloudfile connectors for Tableau Catalog
Get to the right data, faster. See Google BigQuery, Google Sheets and Cloudfile connections in Tableau Catalog Connect to experience when the Data Management Add-on is enabled on your deployment.
Impala connector
Connect to your Cloudera Impala data natively on Tableau Desktop or from the web authoring experience on Tableau Server or Tableau Online.
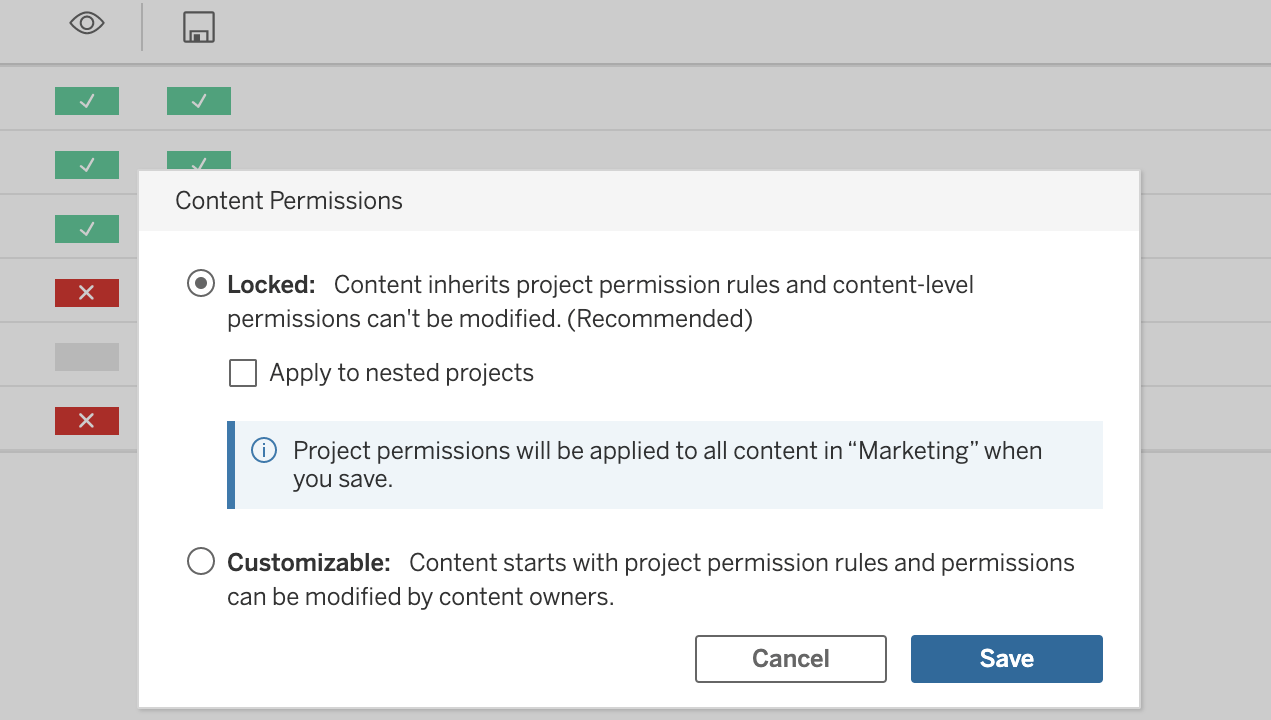
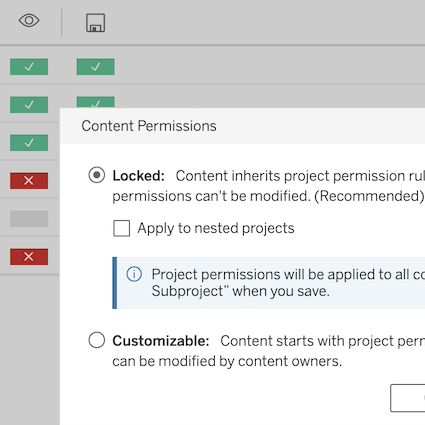
Set permissions for nested projects
You can now control the permission settings separately for content in a project and any nested projects it contains. Improve navigation and organisation of your site’s content and allow site admins to delegate more effectively to non-admins.
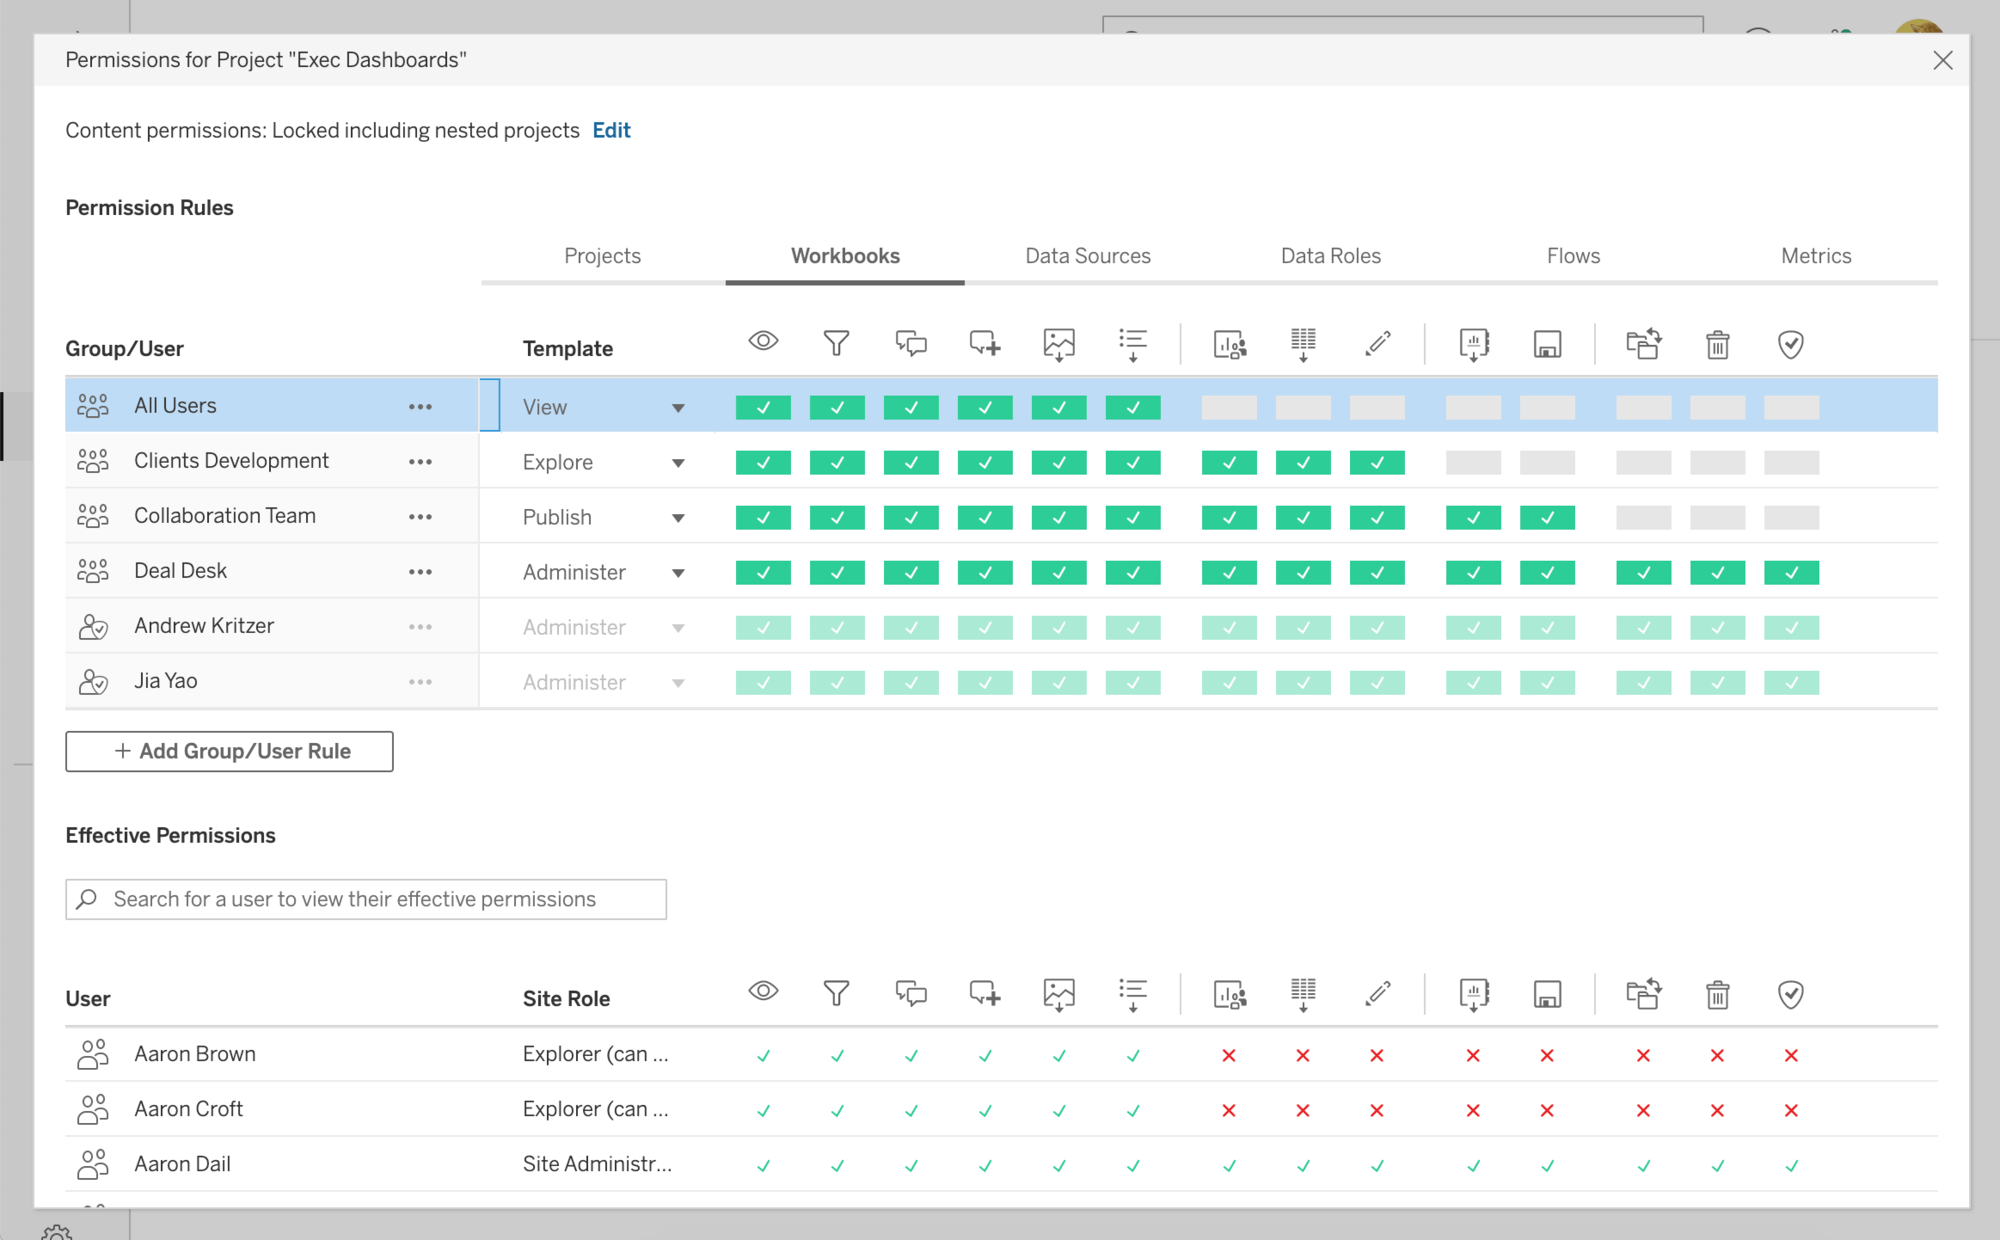
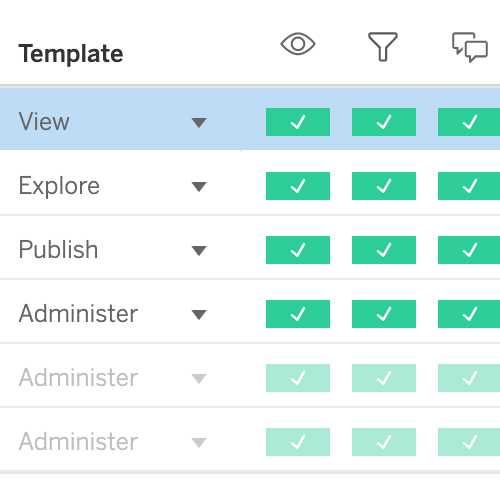
Improved permissions dialog
With a major update to the permissions dialog, you'll be able to set up permissions for users and groups faster and easier than ever before. Updates include new action-oriented permission templates, the ability to search both Users and Groups simultaneously without preselecting your choice, and a new copy-paste function for permission rules. All of these updates are wrapped in a more intuitive user experience with stylistic refinements.
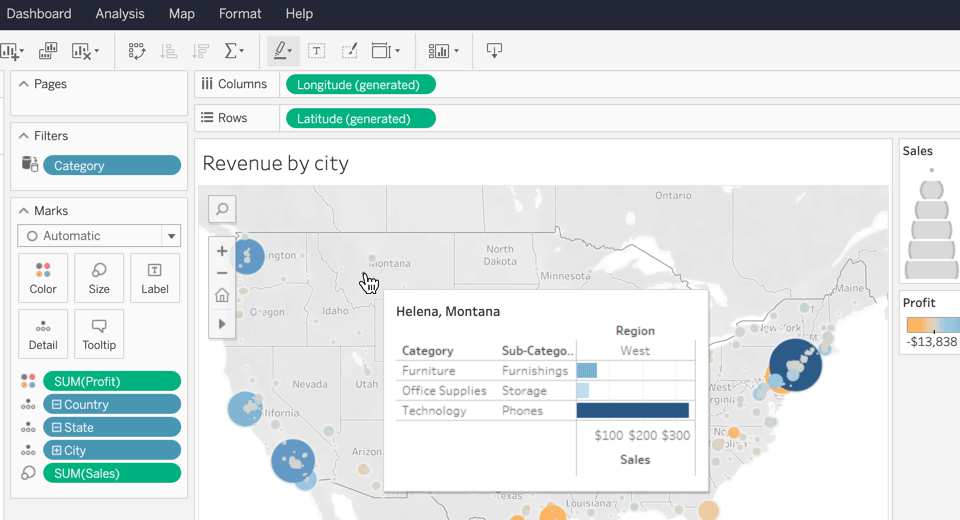
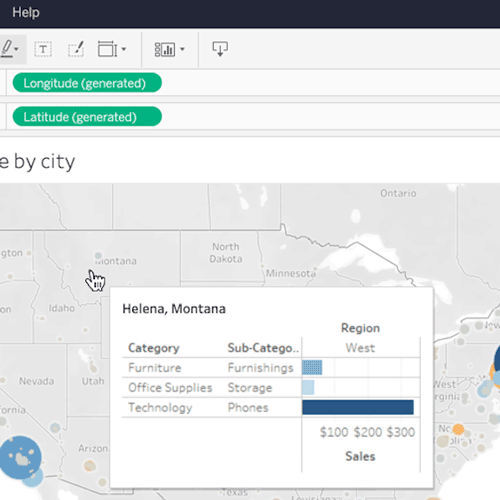
Viz in tooltip in the browser
Bring more interactivity and richness to your dashboards by adding visualizations to your tooltips, directly in the browser.
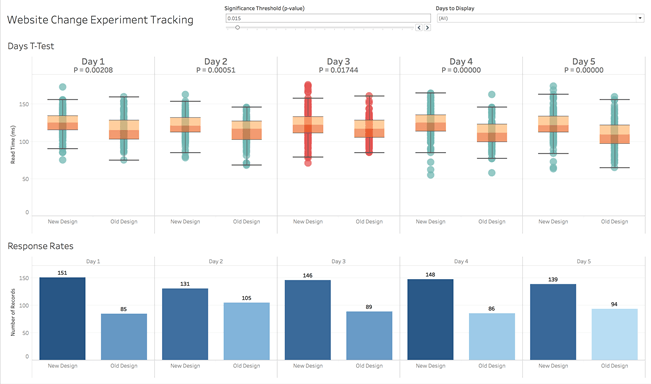
TabPy 1.0
Tableau’s Python Integration Server, TabPy, is being moved to a Tableau supported 1.0 version. This update includes a simplified install, user authentication, secured connections (SSL), and pre-built statistical models.
Analytics Extensions API
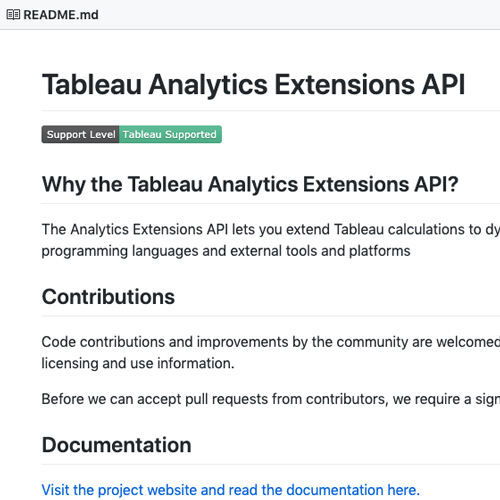
The Analytics Extensions API allows developers to write their own dynamic extensions of Tableau’s calculation language to integrate new programming languages, machine learning models, and advanced statistical functions. This initial release of the API supports the Evaluate API method.
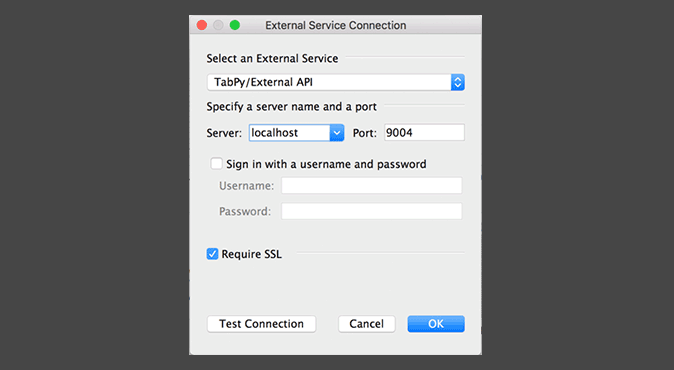
Analytics Extensions Key Store SSL
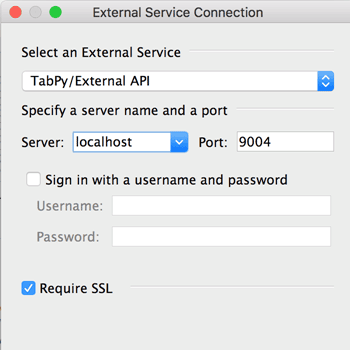
To improve secured connections for R, Python, and other Analytics Extensions (formerly External Services), Tableau Desktop and Server now support the ability to use SSL certificates stores in the operating system key store instead of requiring a cert to be provided directly.
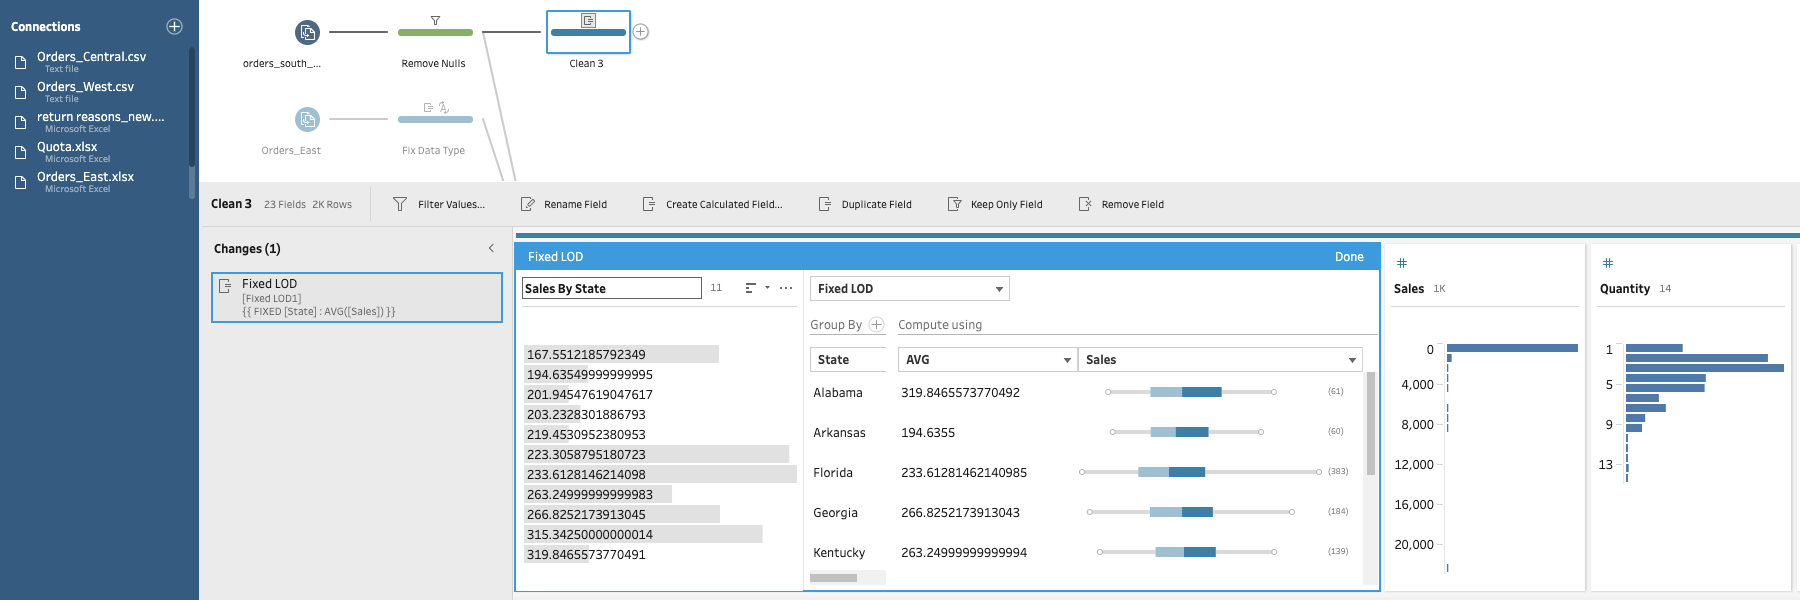
Level of detail calculations in Prep Builder
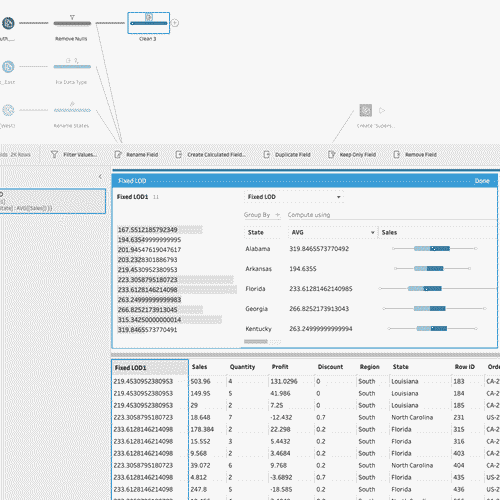
Simplify the ability to prepare and analyse your data at multiple levels of granularity with level-of-detail calculations in Tableau Prep Builder. No more multi-step flows to get the desired aggregation. Instead, use Tableau Prep's visual and easy-to-use calculations.
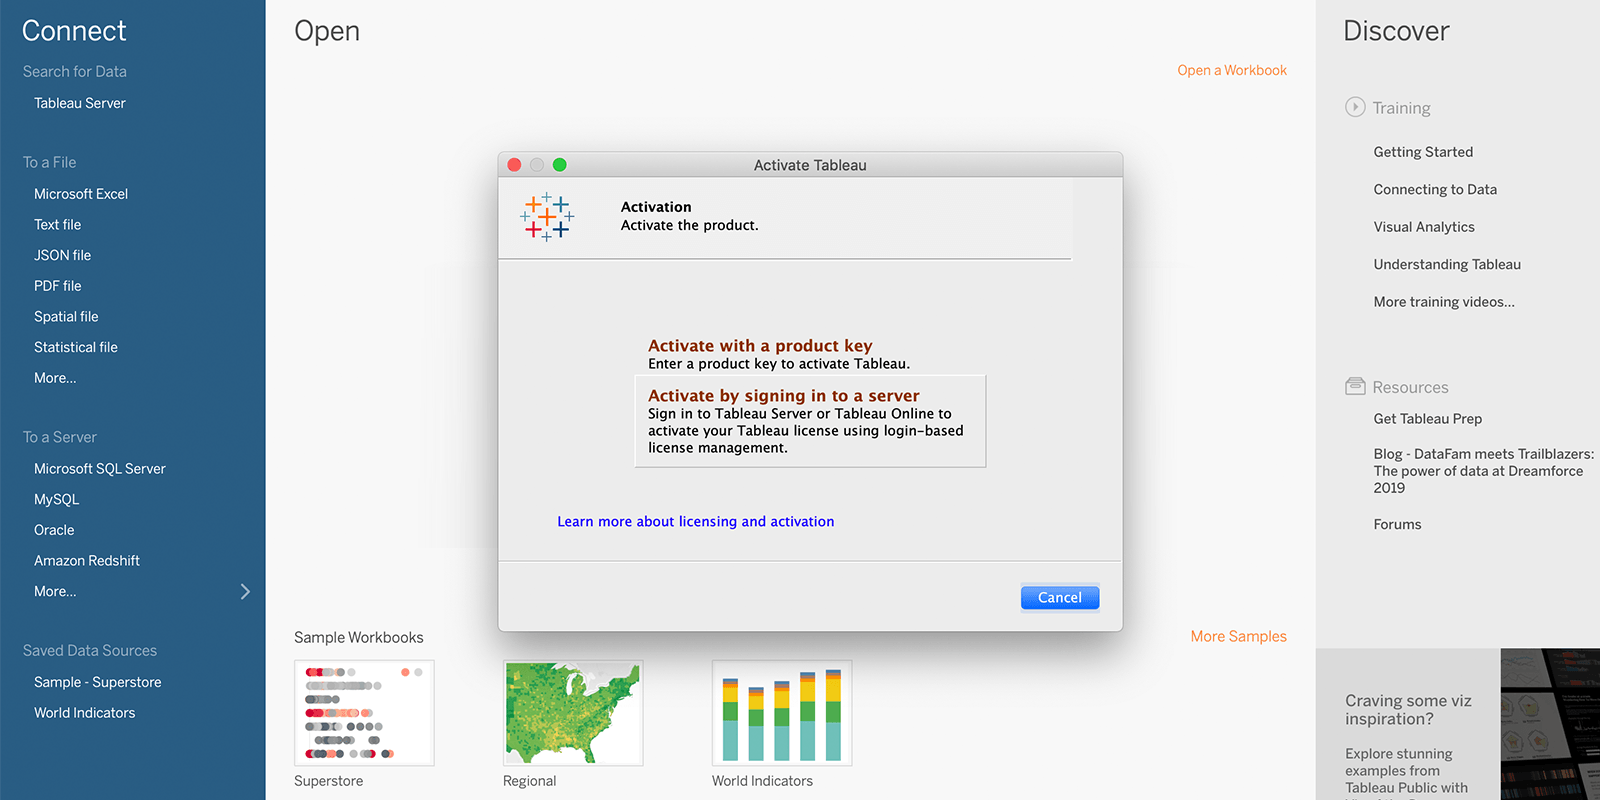
Login-based licence management
Login-based licence management allows Creators to activate Tableau Desktop or Tableau Prep by simply logging in to these products with their Tableau Server credentials. No product key needed! Admins can assign, monitor and reclaim Tableau Desktop or Tableau Prep access directly from Tableau Server instead of distributing licence keys to end users. This licensing option is available to role-based customers. Contact your account team to learn more.
More Initial SQL parameters supported in Prep
You can now use TableauServerUser, TableauServerUserFull, TableauApp, TableauVersion and WorkbookName as parameters in your Initial SQL for Tableau Prep.
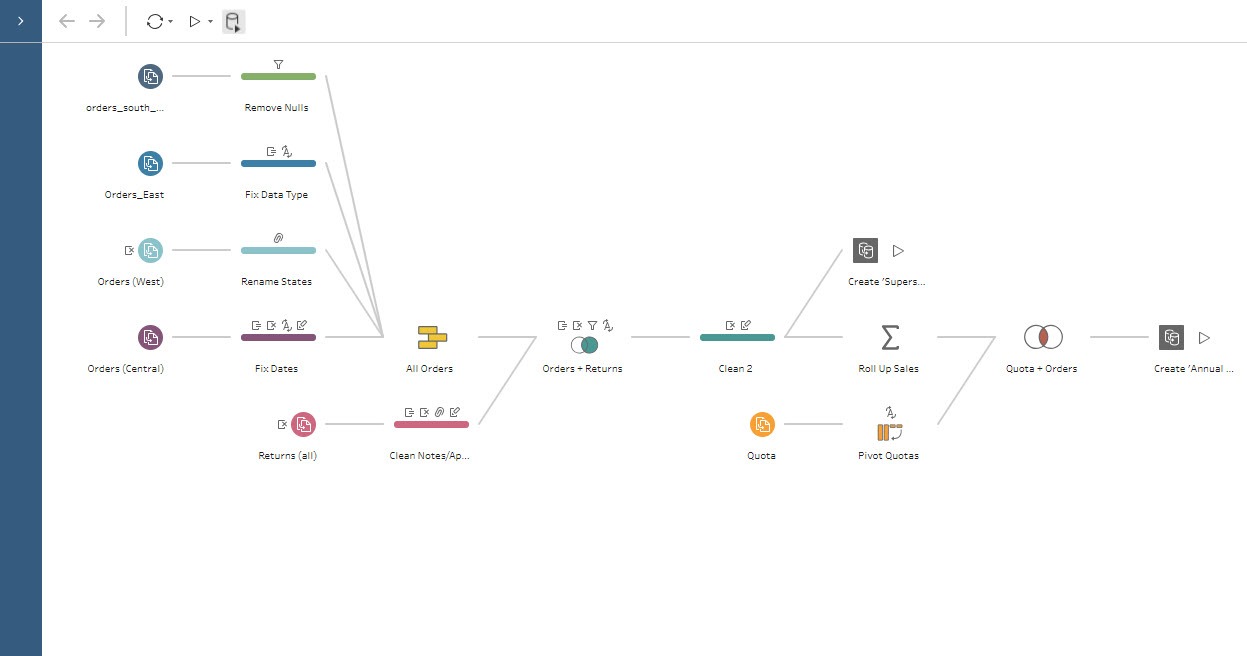
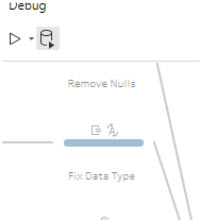
Pause data updates
Add cleaning operations in bulk without waiting to see the data update in the profile panes. Hit the pause button, add your operations, and then click resume to see the collective results of all the new steps you added.
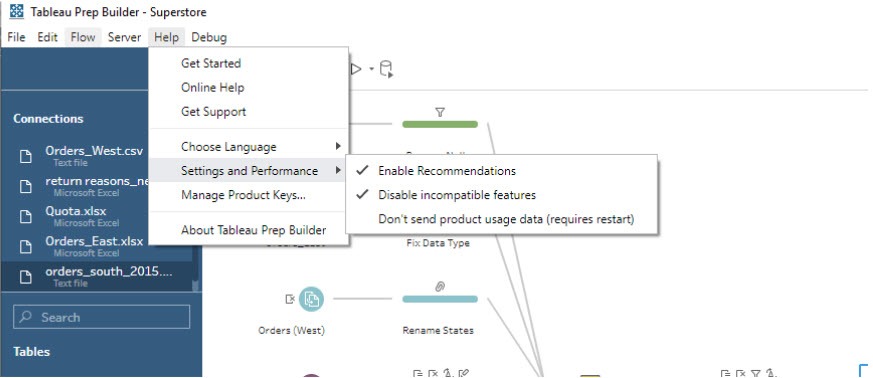
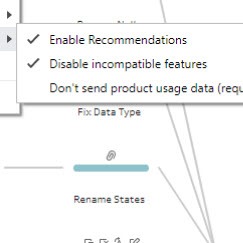
Disable incompatible Tableau Conductor features
If you are using Tableau Prep Conductor in Tableau Server or Tableau Online to operationalize your flows, you need to be able to seamlessly navigate between the desktop and the server experience. With compatibility mode, only features that are fully compatible with your server version will be active. If a feature is incompatible, it will be greyed out and disabled.
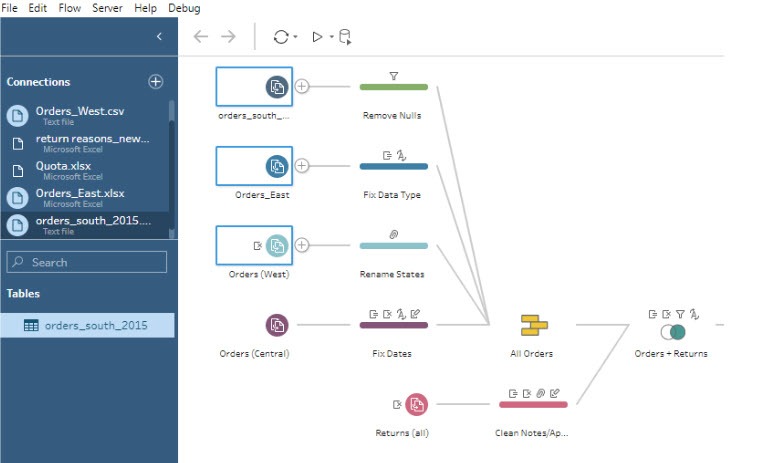
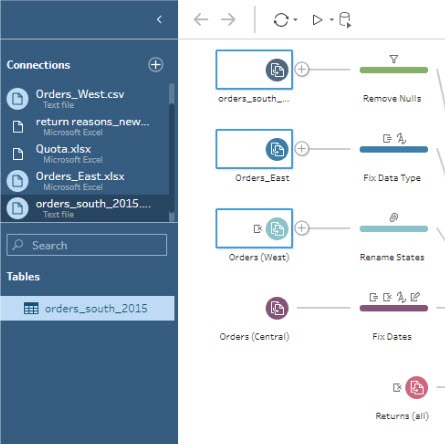
Connections Highlighting
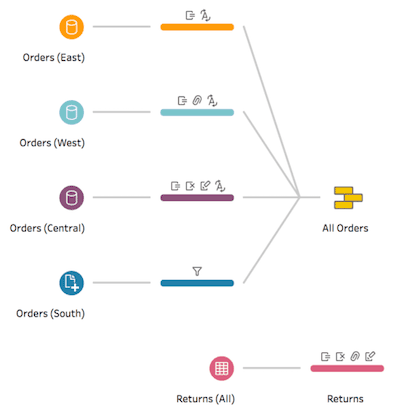
While building your Prep Builder flows, you may occasionally want to change the connection attributes or the credentials for your input steps. With this release, we are making it easier to quickly map your Input steps to their originating connections in the Connections pane. Simply select one or more of your input steps, and all the connections associated with those inputs will be highlighted in the Connections pane.
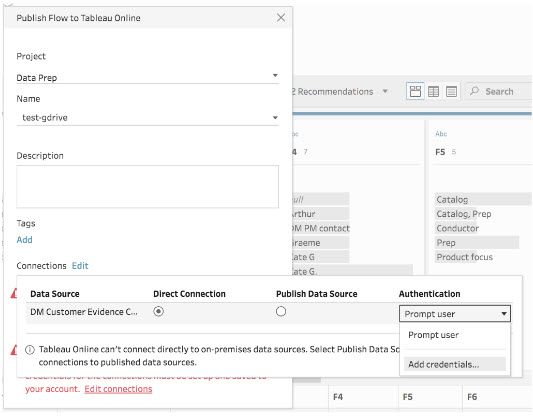
Embed cloud credentials in Prep Conductor
“Add Credentials” in Prep Builder before publishing your flow to Prep Conductor. This will allow you to create new credentials in Tableau Server, that you can choose to use with the flow you are publishing.
Tableau Mobile for BlackBerry
Tableau Mobile for BlackBerry is an update to the existing mobile app. The new app (compatible with iOS13) includes a newer and more intuitive design, an improved search and browsing experience that is consistent with Tableau Server and Tableau Online, as well as enhanced offline capabilities so users can enjoy the richness and interactivity of visualizations, from anywhere.
