DataFam Roundup: March 13-17, 2023


Welcome! Dig into this week's DataFam Roundup—a weekly blog that brings together community content all in one post. As always, we invite you to send us your content—and the DataFam content from your peers that have inspired you! Find the content submission form here.
Community Highlight
To recognize new and consistent Tableau contributors—we’re excited to have a section within the weekly DataFam Roundup called the Tableau Community Highlight. Find out how to get involved.

Adam Korengold, Analytics Lead
Virginia, USA
Adam Korengold is the Analytics Lead at the National Library of Medicine and part-time faculty at the Maryland Institute College of Art. He advocates for visualization as a tool for gaining analytics insights and enjoys Tableau to dive deeper into his interests in baseball and painting.
As a long time avid baseball fan, Adam began baseball-related data visualization at the beginning of the COVID-19 pandemic which led him to exploring many different niches within the topic area. In talking with others, Adam learned more about the growing role of women in baseball: from playing, to managing teams, to working in the sport. He translated these learnings to his visualizations as he saw that not only was there a lack of statistics and visualizations about the All-American Girls Professional Baseball League, there was no online database either; so he created one based on the published hard copy record book.
Using Tableau has also opened a door for Adam to combine data visualization with his passion for painting. In the last year, he has merged these interests by creating his own baseball cards that create a visual narrative both in painting and by revisiting the traditional back of the baseball card in a visual way.
Connect with Adam on Linkedin, Tableau Public, Mastodon, through the Analytics and Healthcare Tableau User Groups, and on his blog, “Section 514.”
Women's History Month with the Tableau Community
- Weekly Viz of the Day's Each week Tableau Public will be featuring a viz celebrating Women's History Month.
- Community Data Visualization Challenges: The DataFam has launched a series of data challenges celebrating Women's History Month. Check them out below!
-
Back to Viz Basics - Visualize Data in a Timeline: As we celebrate International Women's Day and Women's History Month, it's important to recognize the incredible contributions that women have made to our world. In honor of this occasion, this week's data is on Nobel Prize laureates (a person who is honored with an award for outstanding creative or intellectual achievement), with a particular focus on the achievements of female laureates.
-
ProjectHealthViz - Impact of Endometriosis on in Vitro Fertilization Outcomes – Data set from a research paper and aims to highlight the invisible struggle many women with endometriosis face when trying to get pregnant. March is Women’s History Month and it’s important to bring awareness to fertility struggles and the huge hurdles women and their partners go through in hopes of having a family.
-
Diversity in Data - A compilation by Thoughtco.com of the 100 most popular women in history by internet searches
-
DataFam content
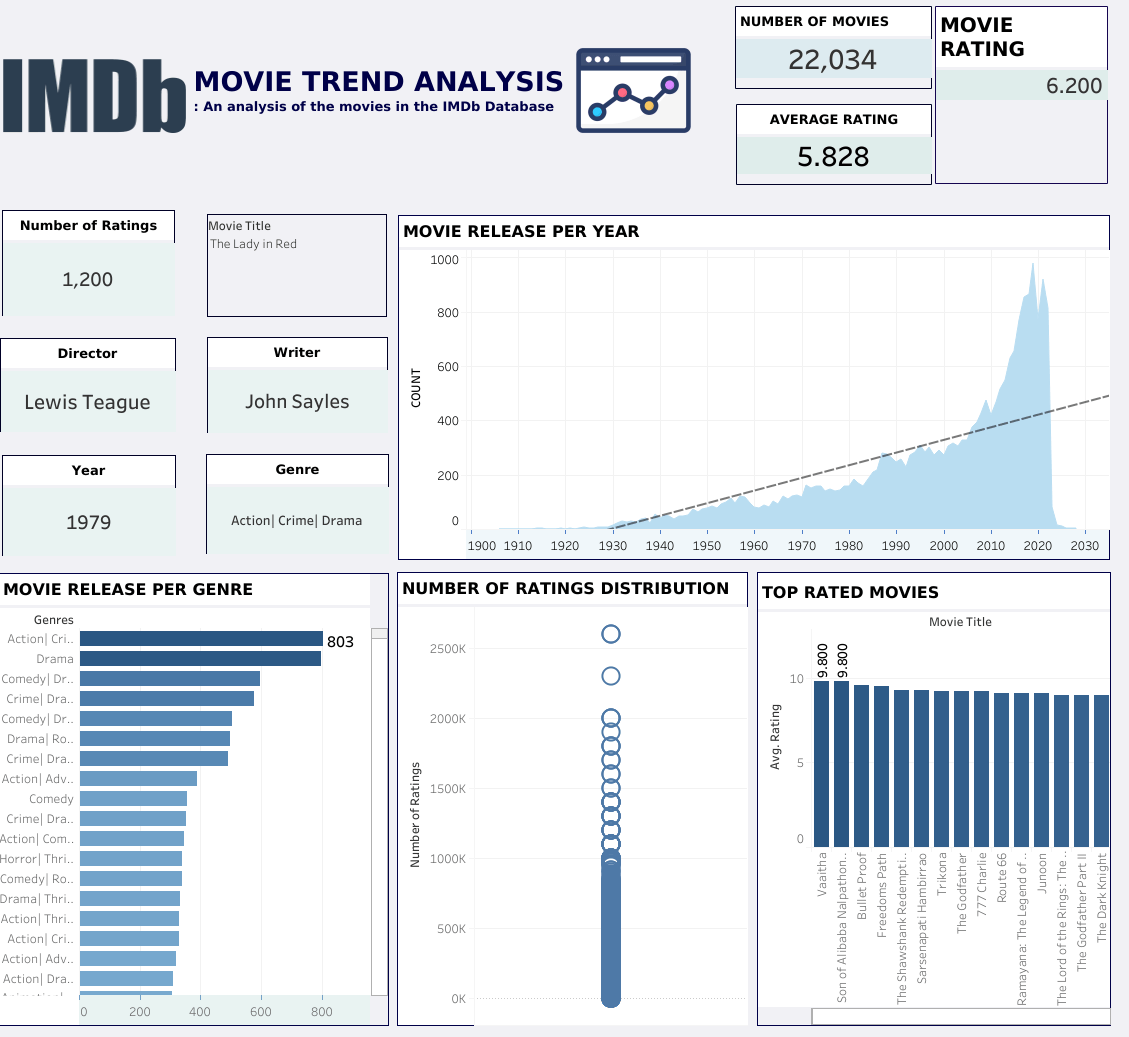
Chelsea Adetan: IMDb Movie Trend Analysis
Dive into content created by the Tableau Community:
- Serious Group: The Benefits of Attending a Tableau User Group
- Hamouchi Imad, BI Tips Boy: #16 Tableau Tips - Swap Pictures /GIFs using Parameter
- Donabel Santos, Sqlbelle: Tableau and Rank over time - bump chart, slope chart, connected scatter plot
-
Kelechi Uzoukwu: Customer Churn Analysis Using SQL
-
Ansula Jain, TechiAnshi: How to create Infographical KPI in Tableau
- Chelsea Adetan: IMDb Movie Trend Analysis
- Jellyman Education: MASSIVE JELLYMAN NEWS | By learning Tableau, you've helped me feed 1,000 Aussies | Mystery Donation!
- Andy Kriebel, VizWiz: How to Dynamically Resize Marks in Tableau
-
Rosario Gauna, RosarioViz: A Trick Filter in Tableau
-
Zena Patton: Companion Site to Create Accurate and Interactive Dashboards with Tableau
Team Tableau
Upcoming events and community participation
-
The 2023 Vizzies Award Nominations: The Tableau World Podcast established the Vizzies as a way to recognize individuals in the Tableau community who are not recognized through the visionary program. It is our goal that these awards are diverse and inclusive of the Tableau community. So without further ado, we present the 8th Annual Vizzies. Nominations are open through March 31st. Winners will be announced live on stage at TC23! How do you nominate someone? It's super easy. Just fill out the nomination form by typing in the person's name.
-
Data Super Star: The theme of this competition is insightfulness, navigability, and user-friendliness. We are looking for BUSINESS DASHBOARD that effectively communicate key insights and patterns in the data, allow for easy exploration, and provide a positive user experience.
-
Dataviz Conferences to not miss in 2023 Are you ready to join the global dataviz community? Fortunately, there are a number of amazing conferences held throughout this year that can help you network with your peers, uncover new learnings, give you memories, and lot of fun. Let’s check them.
-
Data Superstar: Get ready for a data visualization extravaganza! Our competition is all about showcasing the best and brightest in data visualization. The theme of this competition is insightfulness, navigability, and user-friendliness. We are looking for visualizations that effectively communicate key insights and patterns in the data, allow for easy exploration, and provide a positive user experience.
-
Community Calendar and Upcoming Events: stay up-to-date on the latest Women in Dataviz events and other data visualization-related events. If you'd like to submit an event to the calendar, please fill out this form.
Vizzes

James Fox: Radials
See the latest Viz of the Day, trending vizzes, featured authors, and more on Tableau Public.
Check out some inspirational vizzes created by the community:
-
Annabelle Rincon: Analytics of the Analytics TUG
-
James Fox: Radials
-
Dorian Banutoiu: Inventory Dashboard
Community Projects
Back 2 Viz Basics
A bi-weekly project helping those who are newer in the community and just starting out with Tableau. Not limited just to newbies!
Web: Back 2 Viz Basics
Twitter: #B2VB
Week 5: Visualize Data in a Timeline
Workout Wednesday
Build your skills with a weekly challenge to re-create an interactive data visualization.
Web: Workout Wednesday
Twitter: #WOW2022
Week 11: Can You Compare State Sales?
Makeover Monday
A weekly social data project.
Web: Makeover Monday
Twitter: #MakeoverMonday
Week 11: Women’s college basketball rosters
Preppin' Data
A weekly challenge to help you learn to prepare data and use Tableau Prep.
Web: Preppin’ Data
Twitter: #PreppinData
Week 11: Which customers are closest?
DataFam Con
A monthly challenge covering pop culture and fandoms.
Web: DataFam Con
Twitter: #DataFamCon
February 2023: (Reality) Love is in the Air!
EduVizzers
A monthly project connecting real education data with real people.
Web: Eduvizzers
March 2023: Strategic Measure Number of Apprenticeship and Internship Positions Offered by the City of Austin
Games Night Viz
A monthly project focusing on using data from your favorite games.
Web: Games Nights Viz
Twitter: #GamesNightViz
Level 6: The Final Boss
Iron Quest
Practice data sourcing, preparation, and visualization skills in a themed monthly challenge.
Web: Iron Quest
Twitter: #IronQuest
Storytelling with Data
Practice data visualization and storytelling skills by participating in monthly challenges and exercises.
Web: Storytelling with Data
Twitter: #SWDChallenge
March 2023: remake a famous graph
Project Health Viz
Uncover new stories by visualizing healthcare data sets provided each month.
Web: Project Health Viz
Twitter: #ProjectHealthViz
March 2023: Impact of Endometriosis on in Vitro Fertilization Outcomes
Diversity in Data
An initiative centered around diversity, equity & awareness by visualizing provided datasets each month.
Web: Diversity in Data
Twitter: #DiversityinData
March 2023: Women's History Month
Sports Viz Sunday
Create and share data visualizations using rich, sports-themed data sets in a monthly challenge.
Web: Sports Viz Sunday
Twitter: #SportsVizSunday
January 2023: Is it a Sport or a Game?
Viz for Social Good
Volunteer to design data visualizations that help nonprofits harness the power of data for social change.
Web: Viz for Social Good
Twitter: #VizforSocialGood
Feb 17 - Mar 17, 2023: Video Volunteers - India
Real World Fake Data
Create business dashboards using provided data sets for various industries and departments.
Web: Real World Fake Data
Twitter: #RWFD
Session 5: Diversity Score Card
Data Plus Music
A monthly project visualizing the data behind the music we love!
Web: Data Plus Music
Twitter: #DataPlusMusic
相關文章

DataFam Roundup June 2026

DataFam Roundup May 2026

Iron Viz 2026: Read Between the Data
 2026/05/28