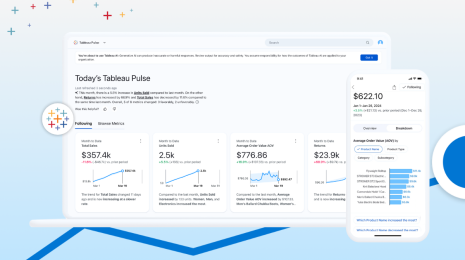
 Tableau Pulse
Top New Tableau Pulse Feature Releases to Know
Here are the top new Tableau Pulse features and capabilities to know. AI
AI4 Ways to Use Generative AI for Business Analytics
 2024/09/26
Discover the four ways generative AI helps data analytics, including data collection and generation, data preparation, data modeling, and predictive analytics.
2024/09/26
Discover the four ways generative AI helps data analytics, including data collection and generation, data preparation, data modeling, and predictive analytics.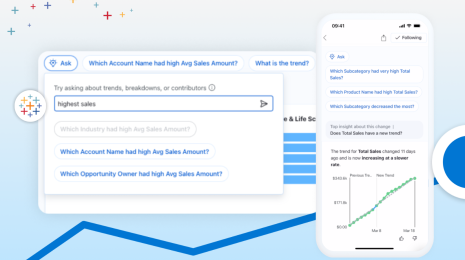 Tableau Pulse
How Tableau Pulse Approaches NLP with Q&A to Empower Everyone
 2024/07/09
Reveal business insights proactively with AI–even before you ask a question–with the Tableau Pulse Q&A feature.
2024/07/09
Reveal business insights proactively with AI–even before you ask a question–with the Tableau Pulse Q&A feature. Releases
Inside the Release: Tableau 2022.2 for Analysts and Business Users
 2022/07/06
Learn what’s in Tableau 2022.2 for analysts and business users, including automated insights with Data Stories, autosave, Prep and Metrics enhancements, and more.
2022/07/06
Learn what’s in Tableau 2022.2 for analysts and business users, including automated insights with Data Stories, autosave, Prep and Metrics enhancements, and more. Product
扩展增强分析,帮助更多人从自己的数据中获得答案
 2021/06/29
了解 Tableau 在增强分析领域进行了哪些投资,这些投资如何让每个人都能够借助易于操作的 AI 使用数据来回答业务问题。
2021/06/29
了解 Tableau 在增强分析领域进行了哪些投资,这些投资如何让每个人都能够借助易于操作的 AI 使用数据来回答业务问题。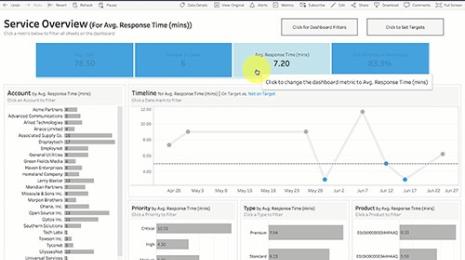 Product
How to analyze Salesforce Service Cloud data smarter with Tableau Dashboard Starters
 2020/10/13
Every department in an organization should be able to understand their data—and customer service organizations are no exception—which is why we’re excited to add the Service Overview and the Case Tracking dashboards to our collection of starters. These two Dashboard Starters are specifically made for the Salesforce Service Cloud and are a great launching pad for anyone introducing analytics to their service organization.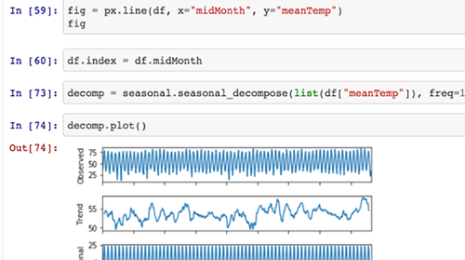 Product
Interactive, notebook-style analysis in Tableau for data science extensibility
 2020/10/13
In the past, the number one reason for the lower adoption of Tableau for data scientists was the lack of support of this code-driven, iterative development methodology. However, with the Dashboard Extensions API and the Analytics Extensions API things have changed. The platform for everyone offers the best from code-driven data science and easy-to-use, drag-and-drop visualization worlds.
2020/10/13
In the past, the number one reason for the lower adoption of Tableau for data scientists was the lack of support of this code-driven, iterative development methodology. However, with the Dashboard Extensions API and the Analytics Extensions API things have changed. The platform for everyone offers the best from code-driven data science and easy-to-use, drag-and-drop visualization worlds.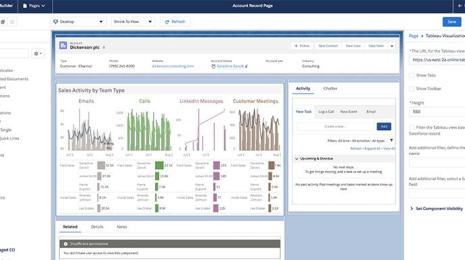 Product
Introducing a new way to bring Tableau analytics into Salesforce
 2020/09/21
Meet the Tableau Viz Lightning Web Component. Now, a Salesforce admin or developer can embed Tableau visualizations into a Salesforce Lightning page in just a few clicks. Read to learn more about this new feature and see a demo.
2020/09/21
Meet the Tableau Viz Lightning Web Component. Now, a Salesforce admin or developer can embed Tableau visualizations into a Salesforce Lightning page in just a few clicks. Read to learn more about this new feature and see a demo.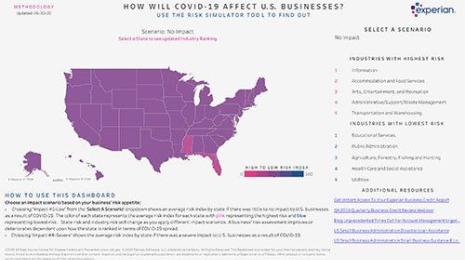 COVID-19
How will COVID-19 affect U.S. businesses in the long term? Experian's Risk Index dashboard reveals possible risk scenarios.
 2020/07/01
Experian built its COVID-19 Risk Index dashboard in Tableau to better assess the pandemic's impact on small businesses by geographic area.
2020/07/01
Experian built its COVID-19 Risk Index dashboard in Tableau to better assess the pandemic's impact on small businesses by geographic area.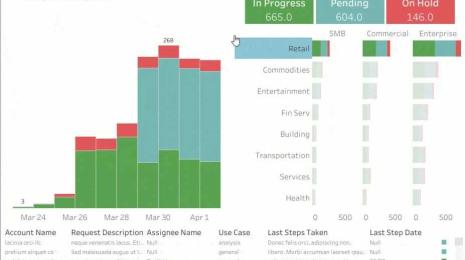 COVID-19
在 COVID-19 业务连续性计划中使用数据的四个步骤
 2020/05/26
在此博客中,我们提供了一个由四部分组成的框架,帮助您了解如何在适应新运营方式期间使用数据和分析。我们会分享一些来自“Tableau on Tableau:领导企业妥善应对变化”网络讲座的示例,介绍 Tableau 的营销、销售、财务等部门中的团队如何创造出各种解决方案来应对危机,改善资源管理。
2020/05/26
在此博客中,我们提供了一个由四部分组成的框架,帮助您了解如何在适应新运营方式期间使用数据和分析。我们会分享一些来自“Tableau on Tableau:领导企业妥善应对变化”网络讲座的示例,介绍 Tableau 的营销、销售、财务等部门中的团队如何创造出各种解决方案来应对危机,改善资源管理。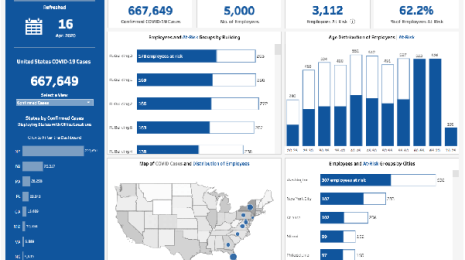 COVID-19
6 dashboards from Tableau partners to help you mitigate COVID-19 impacts
 2020/05/14
Data is a critical asset during this time—to understand, track, and mitigate the impacts of the COVID-19 pandemic. These dashboard solutions from Tableau partners—including dashboard templates and extensions—can help you move quickly and confidently. The solutions cover a variety of industries and use cases including healthcare, financial services, retail, and human resources.
2020/05/14
Data is a critical asset during this time—to understand, track, and mitigate the impacts of the COVID-19 pandemic. These dashboard solutions from Tableau partners—including dashboard templates and extensions—can help you move quickly and confidently. The solutions cover a variety of industries and use cases including healthcare, financial services, retail, and human resources.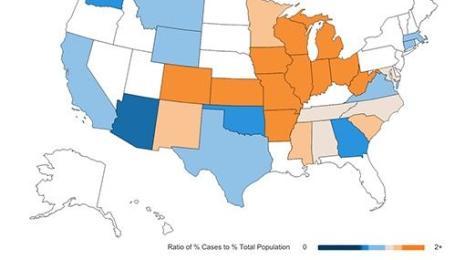 COVID-19
COVID-19 and communities of color: What the data tells us
 2020/05/13
The novel coronavirus is anything but “a great equalizer.” As the outbreak has progressed through the United States, black and brown communities are facing particularly extreme impacts.
2020/05/13
The novel coronavirus is anything but “a great equalizer.” As the outbreak has progressed through the United States, black and brown communities are facing particularly extreme impacts.