 AI
AI4 Ways to Use Generative AI for Business Analytics
 2024/09/26
Discover the four ways generative AI helps data analytics, including data collection and generation, data preparation, data modeling, and predictive analytics.
2024/09/26
Discover the four ways generative AI helps data analytics, including data collection and generation, data preparation, data modeling, and predictive analytics.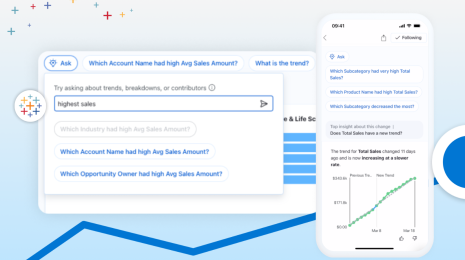 Tableau Pulse
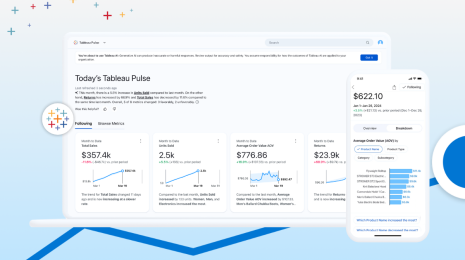
Tableau Pulse がすべての人を支援するための、質問機能における NLP に対する取り組み
 2024/07/09
Tableau Pulse の質問機能を使えば、AI を活用して、質問をするまでもなくビジネスインサイトを積極的に明らかにできます。
2024/07/09
Tableau Pulse の質問機能を使えば、AI を活用して、質問をするまでもなくビジネスインサイトを積極的に明らかにできます。 Releases
Inside the Release: Tableau 2022.2 for Analysts and Business Users
 2022/07/06
Learn what’s in Tableau 2022.2 for analysts and business users, including automated insights with Data Stories, autosave, Prep and Metrics enhancements, and more.
2022/07/06
Learn what’s in Tableau 2022.2 for analysts and business users, including automated insights with Data Stories, autosave, Prep and Metrics enhancements, and more.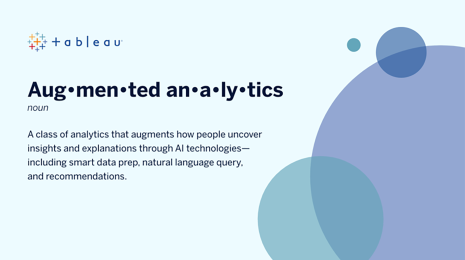 Product
一層多くの人がデータから答えを導き出せるように拡張分析を強化
 2021/06/29
誰もがデータを利用して、使いやすい AI でビジネス上の質問に答えを出せるようにするために、Tableau は拡張分析に投資しています。詳しくご覧ください。
2021/06/29
誰もがデータを利用して、使いやすい AI でビジネス上の質問に答えを出せるようにするために、Tableau は拡張分析に投資しています。詳しくご覧ください。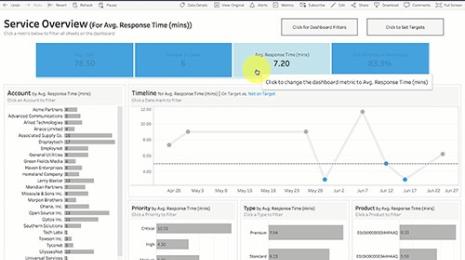 Product
How to analyze Salesforce Service Cloud data smarter with Tableau Dashboard Starters
 2020/10/13
Every department in an organization should be able to understand their data—and customer service organizations are no exception—which is why we’re excited to add the Service Overview and the Case Tracking dashboards to our collection of starters. These two Dashboard Starters are specifically made for the Salesforce Service Cloud and are a great launching pad for anyone introducing analytics to their service organization.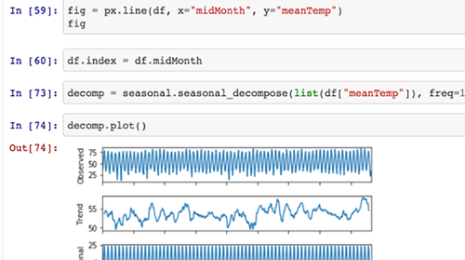 Product
Interactive, notebook-style analysis in Tableau for data science extensibility
 2020/10/13
In the past, the number one reason for the lower adoption of Tableau for data scientists was the lack of support of this code-driven, iterative development methodology. However, with the Dashboard Extensions API and the Analytics Extensions API things have changed. The platform for everyone offers the best from code-driven data science and easy-to-use, drag-and-drop visualization worlds.
2020/10/13
In the past, the number one reason for the lower adoption of Tableau for data scientists was the lack of support of this code-driven, iterative development methodology. However, with the Dashboard Extensions API and the Analytics Extensions API things have changed. The platform for everyone offers the best from code-driven data science and easy-to-use, drag-and-drop visualization worlds.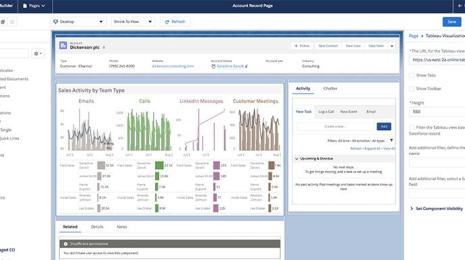 Product
Introducing a new way to bring Tableau analytics into Salesforce
 2020/09/21
Meet the Tableau Viz Lightning Web Component. Now, a Salesforce admin or developer can embed Tableau visualizations into a Salesforce Lightning page in just a few clicks. Read to learn more about this new feature and see a demo.
2020/09/21
Meet the Tableau Viz Lightning Web Component. Now, a Salesforce admin or developer can embed Tableau visualizations into a Salesforce Lightning page in just a few clicks. Read to learn more about this new feature and see a demo.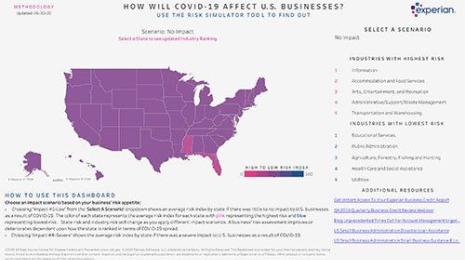 COVID-19
How will COVID-19 affect U.S. businesses in the long term? Experian's Risk Index dashboard reveals possible risk scenarios.
 2020/07/01
Experian built its COVID-19 Risk Index dashboard in Tableau to better assess the pandemic's impact on small businesses by geographic area.
2020/07/01
Experian built its COVID-19 Risk Index dashboard in Tableau to better assess the pandemic's impact on small businesses by geographic area.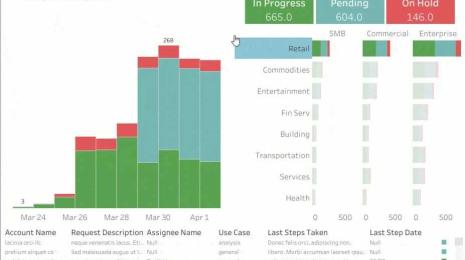 COVID-19
COVID-19 に対するビジネス継続性計画でデータを使用するための 4 つのステップ
 2020/05/26
このブログでは、新しいビジネスの方法に適応するためにデータと分析を使用する方法について、4 つのステップで構成されるフレームワークを提供します。ここでは、ウェビナー「Tableau における Tableau の利用: 変革を先導」からいくつかの例を共有します。このウェビナーでは、マーケティング、営業、財務などの Tableau のチーム全体で、危機への対応とリソースのより効率的な管理を行えるソリューションをどのように稼働させているかについて説明します。
2020/05/26
このブログでは、新しいビジネスの方法に適応するためにデータと分析を使用する方法について、4 つのステップで構成されるフレームワークを提供します。ここでは、ウェビナー「Tableau における Tableau の利用: 変革を先導」からいくつかの例を共有します。このウェビナーでは、マーケティング、営業、財務などの Tableau のチーム全体で、危機への対応とリソースのより効率的な管理を行えるソリューションをどのように稼働させているかについて説明します。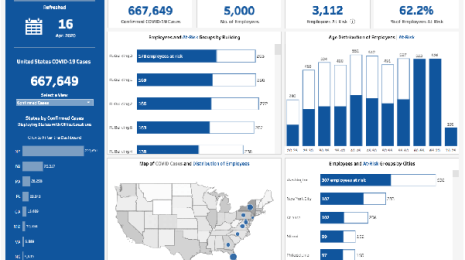 COVID-19
6 dashboards from Tableau partners to help you mitigate COVID-19 impacts
 2020/05/14
Data is a critical asset during this time—to understand, track, and mitigate the impacts of the COVID-19 pandemic. These dashboard solutions from Tableau partners—including dashboard templates and extensions—can help you move quickly and confidently. The solutions cover a variety of industries and use cases including healthcare, financial services, retail, and human resources.
2020/05/14
Data is a critical asset during this time—to understand, track, and mitigate the impacts of the COVID-19 pandemic. These dashboard solutions from Tableau partners—including dashboard templates and extensions—can help you move quickly and confidently. The solutions cover a variety of industries and use cases including healthcare, financial services, retail, and human resources.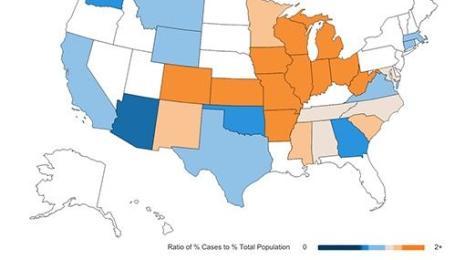 COVID-19
COVID-19 and communities of color: What the data tells us
 2020/05/13
The novel coronavirus is anything but “a great equalizer.” As the outbreak has progressed through the United States, black and brown communities are facing particularly extreme impacts.
2020/05/13
The novel coronavirus is anything but “a great equalizer.” As the outbreak has progressed through the United States, black and brown communities are facing particularly extreme impacts.