 Tableau Pulse
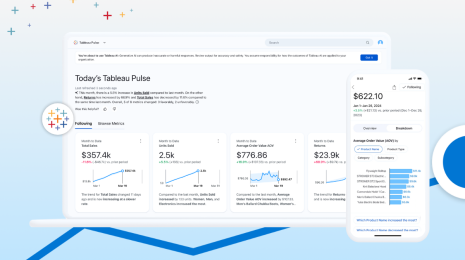
Top New Tableau Pulse Feature Releases to Know
Here are the top new Tableau Pulse features and capabilities to know. AI
AI4 Ways to Use Generative AI for Business Analytics
 26 Septiembre, 2024
Discover the four ways generative AI helps data analytics, including data collection and generation, data preparation, data modeling, and predictive analytics.
26 Septiembre, 2024
Discover the four ways generative AI helps data analytics, including data collection and generation, data preparation, data modeling, and predictive analytics.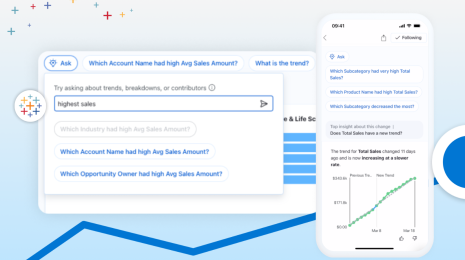 Tableau Pulse
How Tableau Pulse Approaches NLP with Q&A to Empower Everyone
 9 Julio, 2024
Reveal business insights proactively with AI–even before you ask a question–with the Tableau Pulse Q&A feature.
9 Julio, 2024
Reveal business insights proactively with AI–even before you ask a question–with the Tableau Pulse Q&A feature. Releases
Inside the Release: Tableau 2022.2 for Analysts and Business Users
 6 Julio, 2022
Learn what’s in Tableau 2022.2 for analysts and business users, including automated insights with Data Stories, autosave, Prep and Metrics enhancements, and more.
6 Julio, 2022
Learn what’s in Tableau 2022.2 for analysts and business users, including automated insights with Data Stories, autosave, Prep and Metrics enhancements, and more.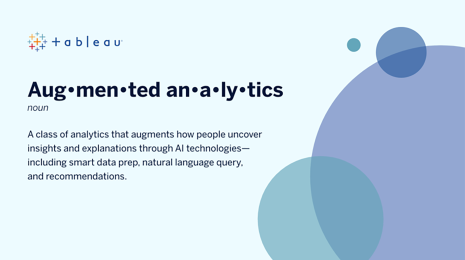 Product
Expandimos el análisis aumentado para ayudar a más personas a obtener respuestas con sus datos
 29 Junio, 2021
Conozca las inversiones que está realizando Tableau en el sector del análisis aumentado para que todos puedan responder sus preguntas de negocios con datos e inteligencia artificial accesible.
29 Junio, 2021
Conozca las inversiones que está realizando Tableau en el sector del análisis aumentado para que todos puedan responder sus preguntas de negocios con datos e inteligencia artificial accesible.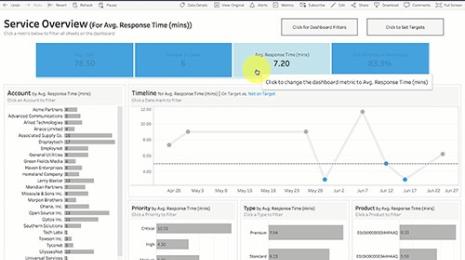 Product
How to analyze Salesforce Service Cloud data smarter with Tableau Dashboard Starters
 13 Octubre, 2020
Every department in an organization should be able to understand their data—and customer service organizations are no exception—which is why we’re excited to add the Service Overview and the Case Tracking dashboards to our collection of starters. These two Dashboard Starters are specifically made for the Salesforce Service Cloud and are a great launching pad for anyone introducing analytics to their service organization.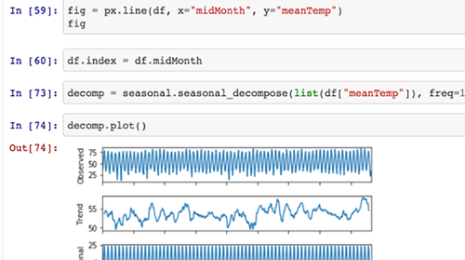 Product
Interactive, notebook-style analysis in Tableau for data science extensibility
 13 Octubre, 2020
In the past, the number one reason for the lower adoption of Tableau for data scientists was the lack of support of this code-driven, iterative development methodology. However, with the Dashboard Extensions API and the Analytics Extensions API things have changed. The platform for everyone offers the best from code-driven data science and easy-to-use, drag-and-drop visualization worlds.
13 Octubre, 2020
In the past, the number one reason for the lower adoption of Tableau for data scientists was the lack of support of this code-driven, iterative development methodology. However, with the Dashboard Extensions API and the Analytics Extensions API things have changed. The platform for everyone offers the best from code-driven data science and easy-to-use, drag-and-drop visualization worlds.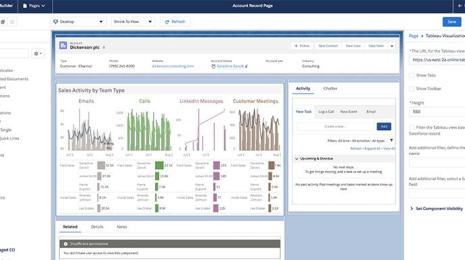 Product
Una nueva opción para incluir los análisis de Tableau en Salesforce
 21 Septiembre, 2020
Presentamos el componente web Tableau Viz Lightning. Ahora, un administrador o desarrollador de Salesforce puede incorporar visualizaciones de Tableau en una página de Salesforce Lightning con tan solo unos clics. Siga leyendo para obtener más información acerca de esta nueva funcionalidad y ver una demostración.
21 Septiembre, 2020
Presentamos el componente web Tableau Viz Lightning. Ahora, un administrador o desarrollador de Salesforce puede incorporar visualizaciones de Tableau en una página de Salesforce Lightning con tan solo unos clics. Siga leyendo para obtener más información acerca de esta nueva funcionalidad y ver una demostración.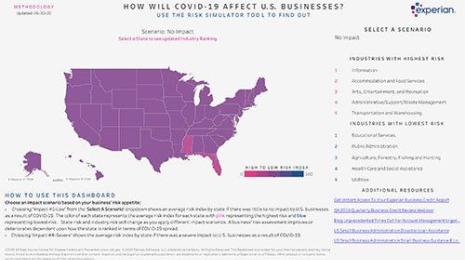 COVID-19
How will COVID-19 affect U.S. businesses in the long term? Experian's Risk Index dashboard reveals possible risk scenarios.
 1 Julio, 2020
Experian built its COVID-19 Risk Index dashboard in Tableau to better assess the pandemic's impact on small businesses by geographic area.
1 Julio, 2020
Experian built its COVID-19 Risk Index dashboard in Tableau to better assess the pandemic's impact on small businesses by geographic area.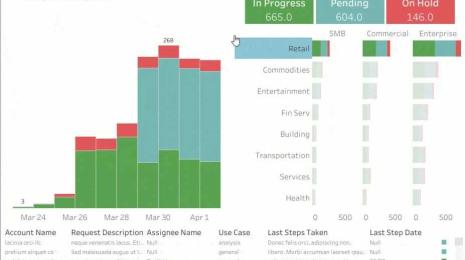 COVID-19
Cuatro pasos para usar los datos como parte del plan de continuidad del negocio en relación con la COVID-19
 26 Mayo, 2020
En este blog, ofrecemos un esquema de cuatro fases sobre el uso de los datos y el análisis para adaptarnos a las nuevas maneras de operar. Compartimos ejemplos de nuestro seminario web “Tableau según Tableau: cómo liderar el cambio” sobre cómo los equipos de las áreas de marketing, ventas y finanzas de Tableau, entre otras, elaboraron soluciones rápidamente para responder a la crisis y administrar mejor sus recursos.
26 Mayo, 2020
En este blog, ofrecemos un esquema de cuatro fases sobre el uso de los datos y el análisis para adaptarnos a las nuevas maneras de operar. Compartimos ejemplos de nuestro seminario web “Tableau según Tableau: cómo liderar el cambio” sobre cómo los equipos de las áreas de marketing, ventas y finanzas de Tableau, entre otras, elaboraron soluciones rápidamente para responder a la crisis y administrar mejor sus recursos.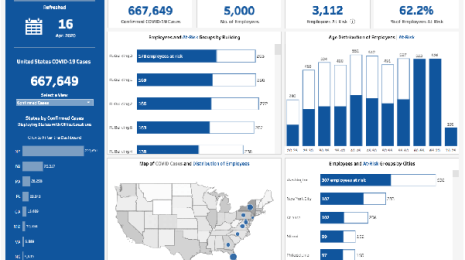 COVID-19
6 dashboards from Tableau partners to help you mitigate COVID-19 impacts
 14 Mayo, 2020
Data is a critical asset during this time—to understand, track, and mitigate the impacts of the COVID-19 pandemic. These dashboard solutions from Tableau partners—including dashboard templates and extensions—can help you move quickly and confidently. The solutions cover a variety of industries and use cases including healthcare, financial services, retail, and human resources.
14 Mayo, 2020
Data is a critical asset during this time—to understand, track, and mitigate the impacts of the COVID-19 pandemic. These dashboard solutions from Tableau partners—including dashboard templates and extensions—can help you move quickly and confidently. The solutions cover a variety of industries and use cases including healthcare, financial services, retail, and human resources.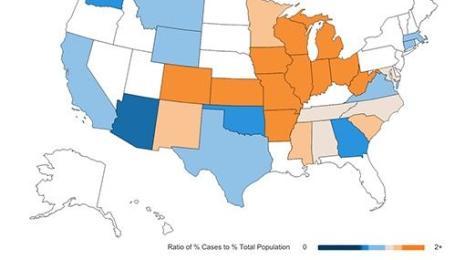 COVID-19
COVID-19 and communities of color: What the data tells us
 13 Mayo, 2020
The novel coronavirus is anything but “a great equalizer.” As the outbreak has progressed through the United States, black and brown communities are facing particularly extreme impacts.
13 Mayo, 2020
The novel coronavirus is anything but “a great equalizer.” As the outbreak has progressed through the United States, black and brown communities are facing particularly extreme impacts.