 Tableau Pulse
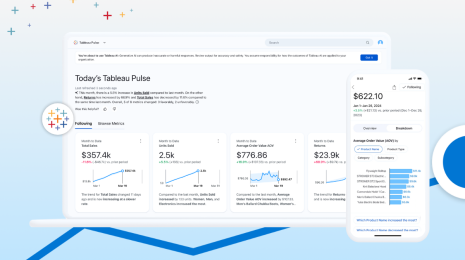
Top New Tableau Pulse Feature Releases to Know
Here are the top new Tableau Pulse features and capabilities to know. AI
AI4 Ways to Use Generative AI for Business Analytics
 2024/09/26
Discover the four ways generative AI helps data analytics, including data collection and generation, data preparation, data modeling, and predictive analytics.
2024/09/26
Discover the four ways generative AI helps data analytics, including data collection and generation, data preparation, data modeling, and predictive analytics.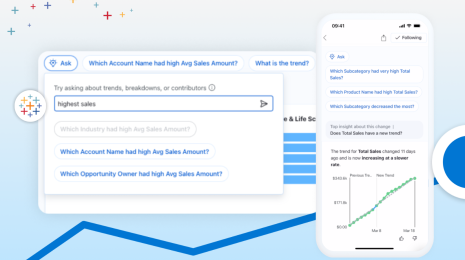 Tableau Pulse
How Tableau Pulse Approaches NLP with Q&A to Empower Everyone
 2024/07/09
Reveal business insights proactively with AI–even before you ask a question–with the Tableau Pulse Q&A feature.
2024/07/09
Reveal business insights proactively with AI–even before you ask a question–with the Tableau Pulse Q&A feature. Releases
Inside the Release: Tableau 2022.2 for Analysts and Business Users
 2022/07/06
Learn what’s in Tableau 2022.2 for analysts and business users, including automated insights with Data Stories, autosave, Prep and Metrics enhancements, and more.
2022/07/06
Learn what’s in Tableau 2022.2 for analysts and business users, including automated insights with Data Stories, autosave, Prep and Metrics enhancements, and more. Product
증강 분석을 확장하여 더 많은 사람이 데이터에서 답을 얻게 지원
 2021/06/29
접근성 높은 AI를 사용해 누구나 데이터에서 비즈니스 질문에 대한 답을 찾을 수 있도록 Tableau가 증강 분석에 어떠한 투자를 하고 있는지 알아보십시오.
2021/06/29
접근성 높은 AI를 사용해 누구나 데이터에서 비즈니스 질문에 대한 답을 찾을 수 있도록 Tableau가 증강 분석에 어떠한 투자를 하고 있는지 알아보십시오.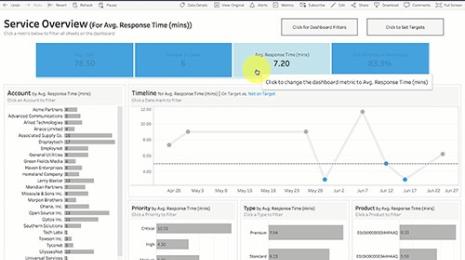 Product
How to analyze Salesforce Service Cloud data smarter with Tableau Dashboard Starters
 2020/10/13
Every department in an organization should be able to understand their data—and customer service organizations are no exception—which is why we’re excited to add the Service Overview and the Case Tracking dashboards to our collection of starters. These two Dashboard Starters are specifically made for the Salesforce Service Cloud and are a great launching pad for anyone introducing analytics to their service organization.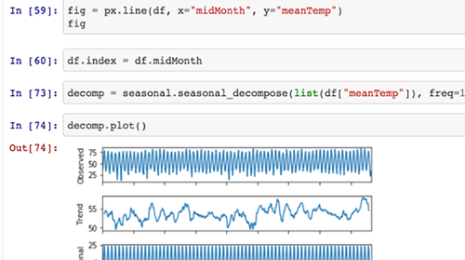 Product
Interactive, notebook-style analysis in Tableau for data science extensibility
 2020/10/13
In the past, the number one reason for the lower adoption of Tableau for data scientists was the lack of support of this code-driven, iterative development methodology. However, with the Dashboard Extensions API and the Analytics Extensions API things have changed. The platform for everyone offers the best from code-driven data science and easy-to-use, drag-and-drop visualization worlds.
2020/10/13
In the past, the number one reason for the lower adoption of Tableau for data scientists was the lack of support of this code-driven, iterative development methodology. However, with the Dashboard Extensions API and the Analytics Extensions API things have changed. The platform for everyone offers the best from code-driven data science and easy-to-use, drag-and-drop visualization worlds.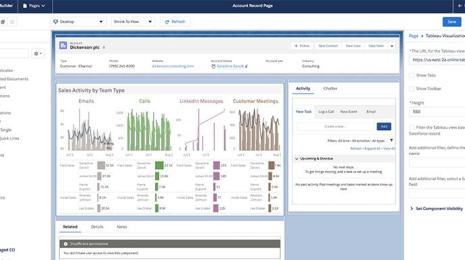 Product
Introducing a new way to bring Tableau analytics into Salesforce
 2020/09/21
Meet the Tableau Viz Lightning Web Component. Now, a Salesforce admin or developer can embed Tableau visualizations into a Salesforce Lightning page in just a few clicks. Read to learn more about this new feature and see a demo.
2020/09/21
Meet the Tableau Viz Lightning Web Component. Now, a Salesforce admin or developer can embed Tableau visualizations into a Salesforce Lightning page in just a few clicks. Read to learn more about this new feature and see a demo.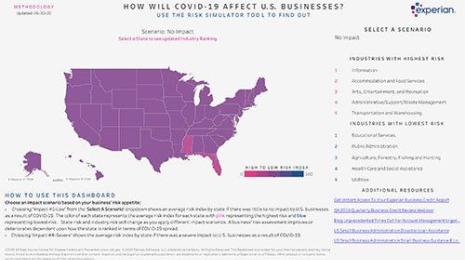 COVID-19
How will COVID-19 affect U.S. businesses in the long term? Experian's Risk Index dashboard reveals possible risk scenarios.
 2020/07/01
Experian built its COVID-19 Risk Index dashboard in Tableau to better assess the pandemic's impact on small businesses by geographic area.
2020/07/01
Experian built its COVID-19 Risk Index dashboard in Tableau to better assess the pandemic's impact on small businesses by geographic area.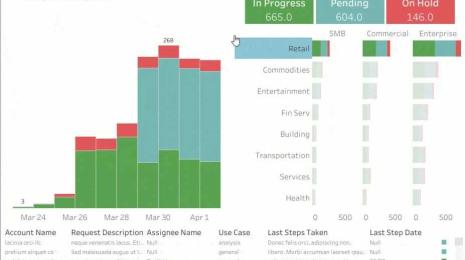 COVID-19
코로나19 대응 비즈니스 연속성 계획에 데이터를 활용하는 4단계
 2020/05/26
이 블로그에서, 새로운 기업 운영 방식에 적응할 때 데이터와 분석을 사용하는 방법에 관한 프레임워크를 네 부분으로 제시합니다. Tableau에서의 Tableau 사용: 변화 속에서 리더십 발휘 웨비나에서 본, 마케팅, 영업, 재무 부문의 여러 Tableau 팀이 위기에 대응하고 리소스를 더 잘 관리하기 위해 어떤 솔루션을 마련했는지에 관한 사례를 공유합니다.
2020/05/26
이 블로그에서, 새로운 기업 운영 방식에 적응할 때 데이터와 분석을 사용하는 방법에 관한 프레임워크를 네 부분으로 제시합니다. Tableau에서의 Tableau 사용: 변화 속에서 리더십 발휘 웨비나에서 본, 마케팅, 영업, 재무 부문의 여러 Tableau 팀이 위기에 대응하고 리소스를 더 잘 관리하기 위해 어떤 솔루션을 마련했는지에 관한 사례를 공유합니다.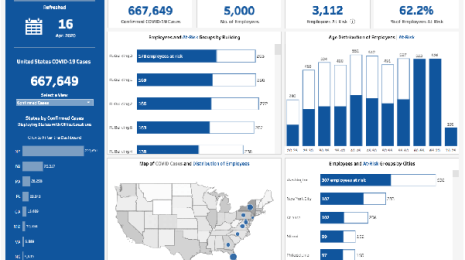 COVID-19
6 dashboards from Tableau partners to help you mitigate COVID-19 impacts
 2020/05/14
Data is a critical asset during this time—to understand, track, and mitigate the impacts of the COVID-19 pandemic. These dashboard solutions from Tableau partners—including dashboard templates and extensions—can help you move quickly and confidently. The solutions cover a variety of industries and use cases including healthcare, financial services, retail, and human resources.
2020/05/14
Data is a critical asset during this time—to understand, track, and mitigate the impacts of the COVID-19 pandemic. These dashboard solutions from Tableau partners—including dashboard templates and extensions—can help you move quickly and confidently. The solutions cover a variety of industries and use cases including healthcare, financial services, retail, and human resources.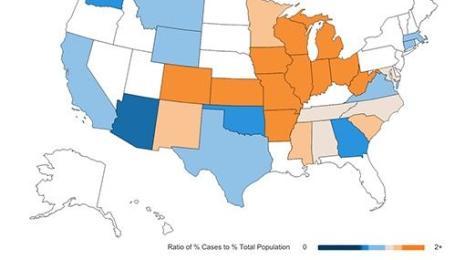 COVID-19
COVID-19 and communities of color: What the data tells us
 2020/05/13
The novel coronavirus is anything but “a great equalizer.” As the outbreak has progressed through the United States, black and brown communities are facing particularly extreme impacts.
2020/05/13
The novel coronavirus is anything but “a great equalizer.” As the outbreak has progressed through the United States, black and brown communities are facing particularly extreme impacts.