How to Improve Dashboard Load Times with People and Processes
When encountering a slow dashboard load, it’s natural to scream to the skies, blame the analytics platform, blame the server admin who set up your environment, and even blame your friendly account team. While this is a natural reaction, it’s critical to recognize that the typical cause of slow dashboards is not systems or support teams; it’s either slow data sources or inefficient dashboard design choices.
As these choices snowball across hundreds of dashboards on your server, your Tableau Deployment hardware becomes overwhelmed. As a result, it slows down performance for everyone—frustrating existing users, deterring new users, and vexing platform owners on how best to move forward.
And, the core cause of slow dashboards isn’t limited to Tableau Server. Unless your on-premises server is seriously underperforming, you’ll typically find that migrating your content to Tableau Cloud won’t magically result in vastly improved performance. The bottlenecks will still exist.
Whether your content is hosted on Tableau Server or Tableau Cloud, this blog provides the framework to help you articulate dashboard performance KPIs, propose the people and processes needed to drive improvements, and incorporate a system of rules to maintain quality going forward.
The Tableau Performance page summarizes the best, most up-to-date resources for troubleshooting and improving performance for your dashboards.
Performance framework
We break down the plan into four steps:
- Monitor performance
- Improve content
- Enable the community
- Enforce governance rules
Step 1: Monitor performance
Take a minute to think. Do you know the answer to the following questions?
- What is the average load time of my dashboards?
- What is defined as “slow” in my organization?
- What percentage of our management or client-facing dashboards are “slow?”
If you don’t, you’ll struggle to align your stakeholders around data-backed facts, and the perception around performance will default to the anecdotal opinions of the highest-paid complainer. Alignment is key to improving performance systematically, so the first step is monitoring and publishing performance KPIs.
Start with average dashboard load time. Pivoting this metric will establish the performance standard of truth, identify a shortlist of views needing help, and serve as a benchmark for future improvements.
You can find Dashboard Load Times Accelerators for Tableau Server and for Tableau Cloud on the Tableau Exchange as free, readily accessible resources. These downloadable workbooks extract data from Tableau Server’s repository and Tableau Cloud’s Admin Insights to quickly analyze the load times across your Tableau Server or Tableau Cloud deployment.
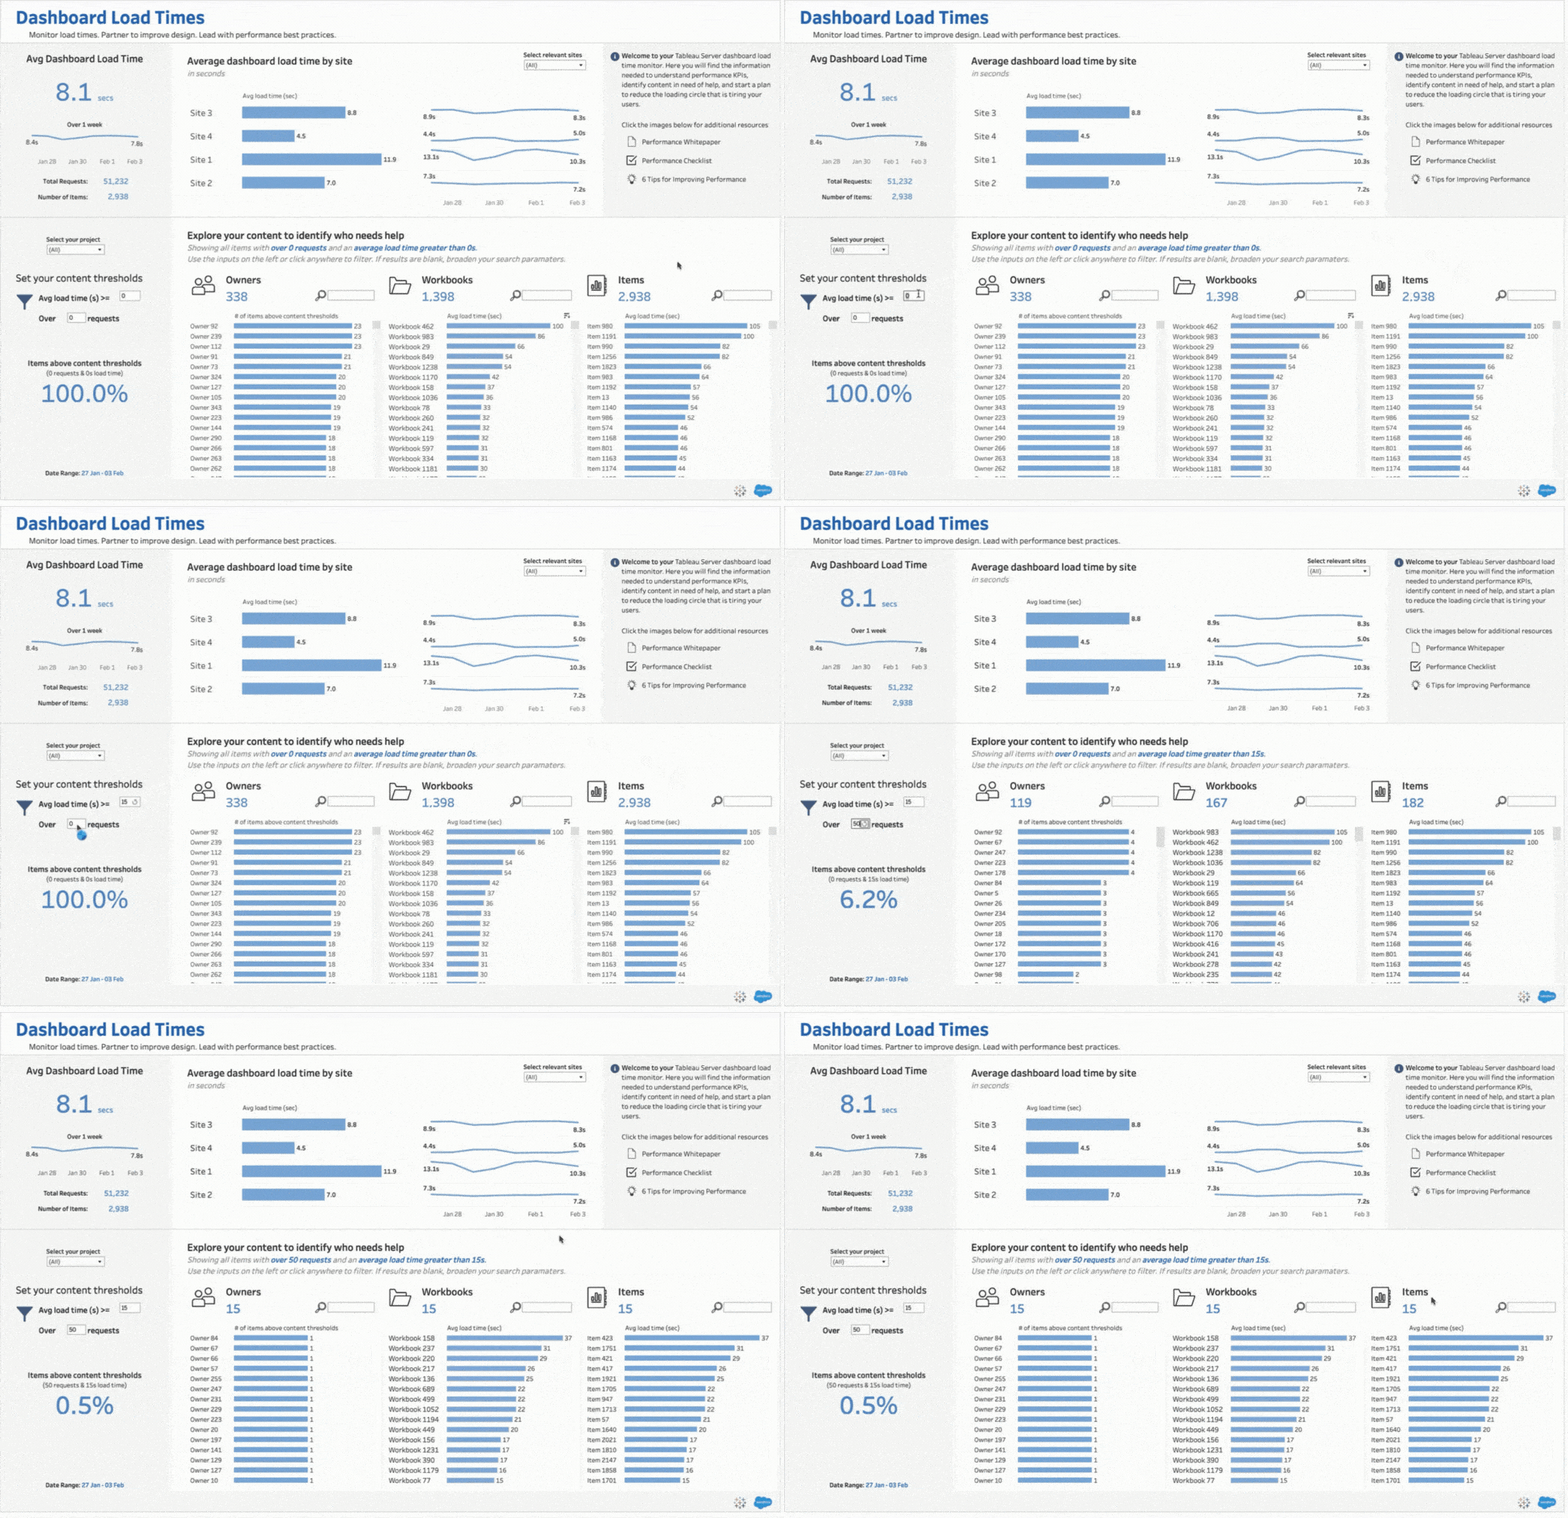
This sample shows how easy it is to know the average dashboard load times across the entire Tableau Server (top left), broken down by sites (top middle), and by owners, workbooks, and items (bottom middle). This shared understanding of performance will align your different groups to make decisions based on the same tangible data points.

Using the “Content Thresholds” parameters, filter for all items that take longer than 15 seconds to load and have over 50 requests. With two inputs, you’ve narrowed the pool of 2,938 total dashboards to a shortlist of 15 most in need of help. This shortlist prepares you for the next step—improving content.
Step 2: Improve content
By monitoring, you’ve identified which dashboards need help. Now what? Someone with performance best practice knowledge will need to go in and actually improve the dashboards. This step is about defining your organization’s approach. Where it starts depends on how you answer the following questions:
- Do you currently have internal experts who can diagnose and improve slow dashboards?
- Do those experts have bandwidth to help their colleagues in need?
If the answer is yes to both questions, this step will be about connecting experts with struggling dashboards. If the answer is no to either question, it will be challenging to improve content internally. Start by hiring professional services or a trusted partner to optimize your list of slow dashboards one by one and share the learnings with your centralized teams. If the budget is tight, you can upskill centralized teams with the concepts outlined in the Designing Efficient Workbooks whitepaper. As your centralized team ramps up, they can shoulder more performance responsibility and scale that knowledge onto the next step—enabling the community.
Step 3: Enable the community
Your centralized teams now understand common performance pitfalls. It’s time to repurpose these lessons and ensure your users have the knowledge and tools to self-serve their performance obstacles.
Start by driving best-practice awareness into existing analytics community engagements, such as user group meetings, analytics academies, and competitions. The success stories shared at these engagements will drive the message home that users have control over the performance of their dashboards.
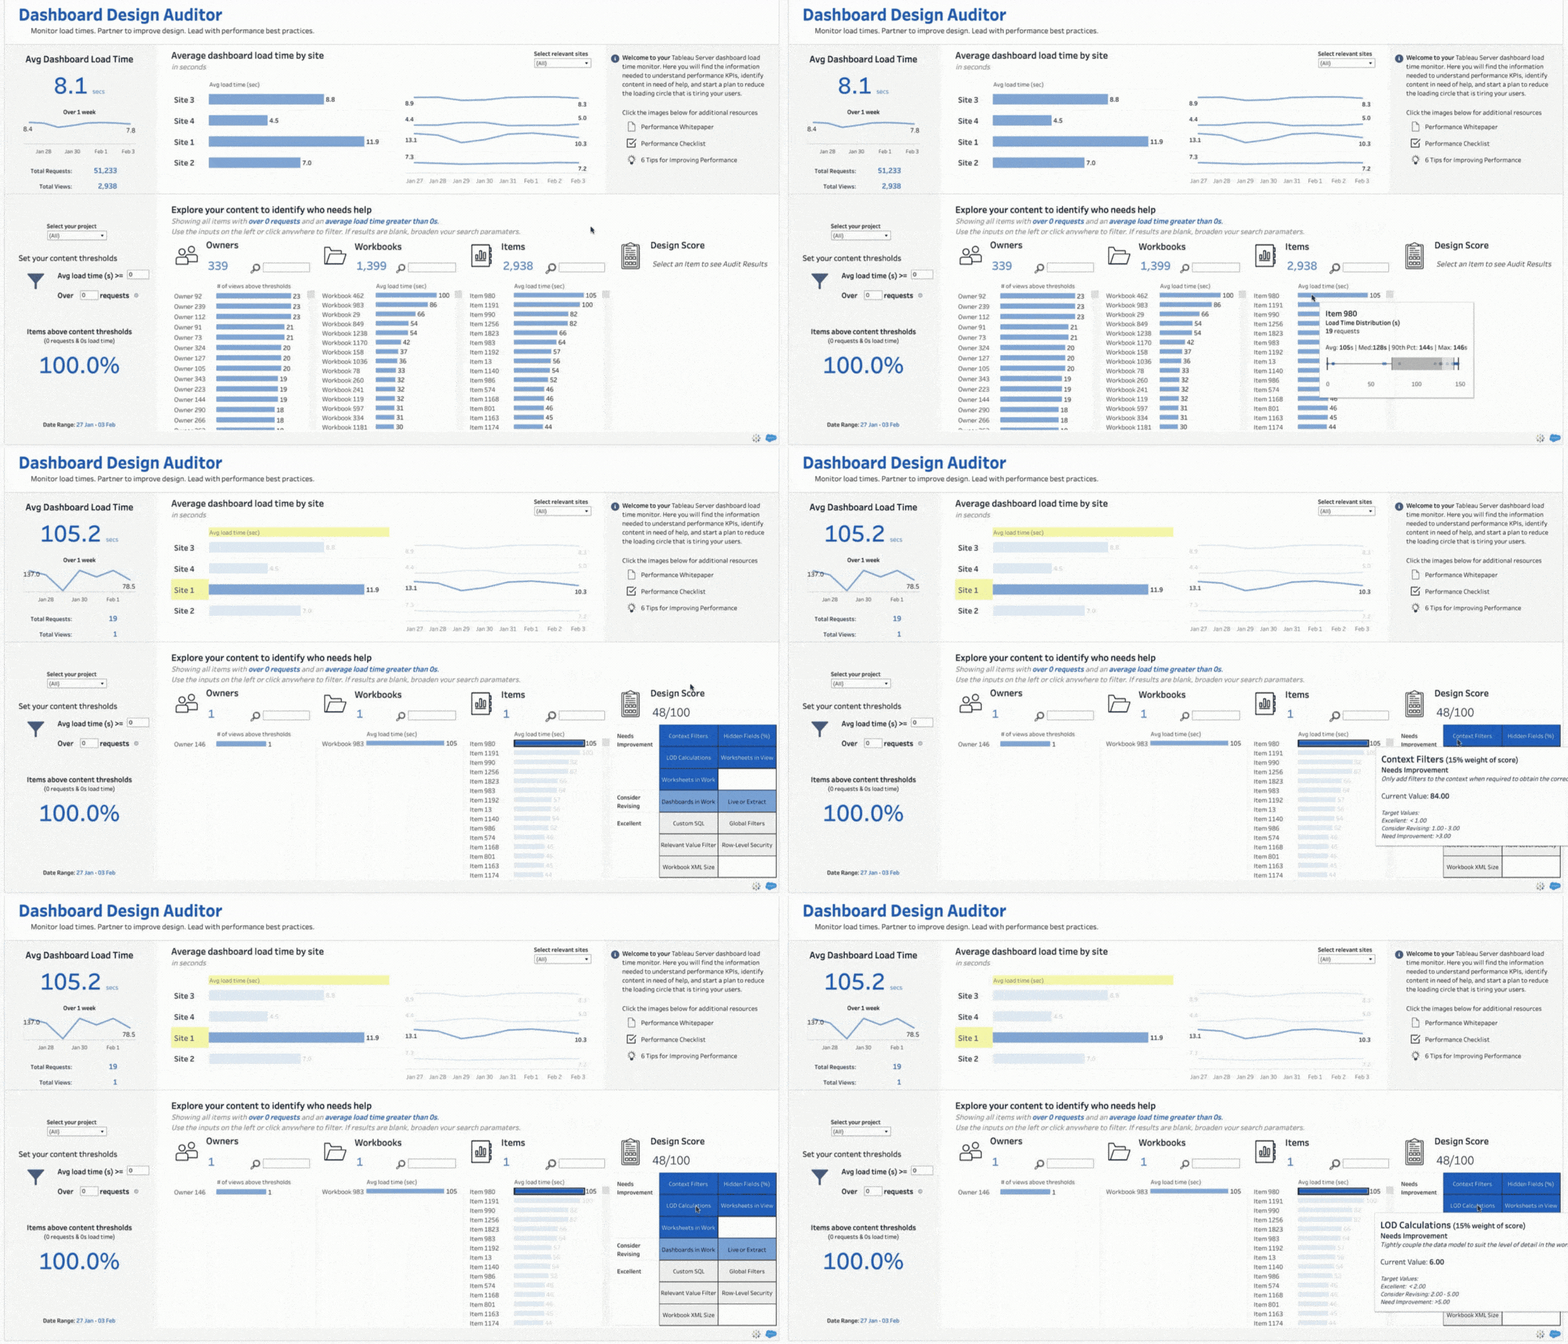
Next, equip users with the tools to diagnose and improve their workbooks. Our Design Auditor Accelerator below (Tableau Server only) combines Tableau’s metadata API and a custom Python script to help users identify struggling dashboards and provide suggested improvements.

Refer to the “Items” section on the accelerator, and you’ll see Item 980 is the slowest dashboard (105 seconds average load). At this stage, your user knows the dashboard is slow but doesn’t know why or how to improve it. Fortunately, the Python script has worked in the background to grade the dashboards along 12 performance variables to help out. Click on the bar to reveal a list of best practices for the user to prioritize, and hover to see how those grades relate to recommended thresholds. Now, your user is truly empowered to drive improvements on their own.
The Design Auditor Accelerator is a great way to centrally monitor and manage performance best practices across your server. However, If your organization is not interested in a centralized approach, users can still access suggested design improvements directly in Tableau Desktop through the Workbook Optimizer, released with Tableau 2022.1.
Publishing and driving awareness of these tools will empower users to take their dashboard performance into their own hands and allow you to hold them accountable to the rules set in the next step.
Step 4: Enforce governance rules
Now that users have the appropriate tools and knowledge, you can start holding them accountable to performance thresholds. Start by deciding the rules that work for your organization.
An example could be:
- ≥ 35s load time - Needs Improvement:
Action: Content is moved off the production environment to a sandbox until performance meets acceptable thresholds - ≥ 10s load time - Consider Revising:
Action: Content remains in production but must go through the performance improvement process defined in Step 2: Improve Content - < 10s load time - Excellent:
Action: Congratulations, you’re in production!
Consider your server’s standard load times before adopting the above thresholds. Thresholds should be challenging enough to push your users for improvement but not so challenging that it may demotivate users from trying.
Once your rules are defined, you’ll need to enforce them. Use data-driven alerts to identify the moment dashboards become non-compliant, and use the content migration tool to seamlessly move content across environments as performance dictates.
As your deployment’s governance capabilities around performance mature, you may see subsets of these rules revolving around different audiences. The 35s/10s/10s split works for internal use cases, but stricter guidelines may need to be in place for anything management or client-facing. Inversely, you may be more flexible with content in your sandbox.
These rules should be communicated to your users early and often as part of their responsibilities with the message that performant content is no longer a nice to have—it’s a mandatory requirement.
A framework for high-performing dashboards
The saying, if you can’t monitor it, you can’t manage it, can’t ring true enough regarding dashboard speed. Leveraging this framework will generate awareness around dashboard performance, install support structures to assist users in improvements, enable the community so all can participate, and establish rules to maintain accountability going forward. Only then will you have a well-informed, highly accountable user base that views dashboard load times as a tangible challenge to overcome, not a mysterious antagonist.
Want more? Remember to visit the Tableau Performance page for the best resources to help you troubleshoot and improve performance of your Tableau content.


